www.biogeosciences.net/9/3047/2012/ doi:10.5194/bg-9-3047-2012
© Author(s) 2012. CC Attribution 3.0 License.
Biogeosciences
Photoproduction of ammonium in the southeastern Beaufort Sea
and its biogeochemical implications
H. Xie1, S. B´elanger2, G. Song1, R. Benner3, A. Taalba1, M. Blais4, J.- ´E. Tremblay4, and M. Babin4,5
1Institut des Sciences de la Mer de Rimouski, Universit´e du Qu´ebec `a Rimouski, Rimouski, Qu´ebec, G5L 3A1, Canada 2D´epartement de Biologie, Chimie et G´eographie, Universit´e du Qu´ebec `a Rimouski, Rimouski, Qu´ebec, G5L 3A1, Canada 3University of South Carolina, Marine Science Program, Columbia, SC 29208, USA
4D´epartement de Biologie, Qu´ebec-Oc´ean and Takuvik, Universit´e Laval, Qu´ebec, G1V 0A6, Canada 5Laboratoire d’Oc´eanographie de Villefranche, CNRS & Univ. Pierre et Marie Curie, France
Correspondence to:H. Xie (huixiang xie@uqar.qc.ca)
Received: 5 March 2012 – Published in Biogeosciences Discuss.: 13 April 2012 Revised: 26 June 2012 – Accepted: 17 July 2012 – Published: 10 August 2012
Abstract. Photochemistry of dissolved organic matter
(DOM) plays an important role in marine biogeochemical cy-cles, including the regeneration of inorganic nutrients. DOM photochemistry affects nitrogen cycling by converting bio-refractory dissolved organic nitrogen to labile inorganic ni-trogen, mainly ammonium (NH+4). During the August 2009 Mackenzie Light and Carbon (MALINA) Program, the ab-sorbed photon-based efficiency spectra of NH+4 photopro-duction (i.e. photoammonification) were determined using water samples from the SE Beaufort Sea, including the Mackenzie River estuary, shelf, and Canada Basin. The pho-toammonification efficiency decreased with increasing wave-length across the ultraviolet and visible regimes and was higher in offshore waters than in shelf and estuarine wa-ters. The efficiency was positively correlated with the mo-lar nitrogen:carbon ratio of DOM and negatively corre-lated with the absorption coefficient of chromophoric DOM (CDOM). Combined with collateral measurements of CO2
and CO photoproduction, this study revealed a stoichiom-etry of DOM photochemistry with a CO2: CO : NH+4
mo-lar ratio of 165 : 11 : 1 in the estuary, 60 : 3 : 1 on the shelf, and 18 : 2 : 1 in the Canada Basin. The NH+4 efficiency spec-tra, along with solar photon fluxes, CDOM absorption co-efficients and sea ice concentrations, were used to model the monthly surface and depth-integrated photoammonifi-cation rates in 2009. The summertime (June–August) rates at the surface reached 6.6 nmol l−1d−1 on the Macken-zie Shelf and 3.7 nmol l−1d−1 further offshore; the depth-integrated rates were correspondingly 8.8 µmol m−2d−1and
11.3 µmol m−2d−1. The offshore depth-integrated rate in August (8.0 µmol m−2d−1) was comparable to the missing dissolved inorganic nitrogen (DIN) source required to sup-port the observed primary production in the upper 10-m layer of that area. The yearly NH+4 photoproduction in the entire study area was estimated to be 1.4×10⁸moles, with 85 % of it being generated in summer when riverine DIN input is low. Photoammonification could mineralize 4 % of the annual dis-solved organic nitrogen (DON) exported from the Macken-zie River and provide a DIN source corresponding to 7 % of the riverine DIN discharge and 1400 times the riverine NH+4 flux. Under a climate warming-induced ice-free sce-nario, these quantities could increase correspondingly to 6 %, 11 %, and 2100 times. Photoammonification is thus a signifi-cant nitrogen cycling term and may fuel previously unrecog-nized autotrophic and heterotrophic production pathways in the surface SE Beaufort Sea.
1 Introduction
laboratories and from different samples. While many stud-ies observed environmentally relevant rates of photoammoni-fication (e.g. Bushaw et al., 1996; Gao and Zepp, 1998; V¨ah¨atalo et al., 2003; Smith and Benner, 2005; V¨ah¨atalo and Zepp, 2005; Kitidis et al., 2006; Stedmon et al., 2007; Aarnos et al., 2012), others reported little or no NH+4 pho-toproduction (e.g. Buffam and McGlathery, 2003; Jørgensen et al., 1998; Bertilsson et al., 1999; Wiegner and Seitzinger, 2001) or even photochemical loss of NH+4 (Kieber et al., 1997; Koopmans and Bronk, 2002; V¨ah¨atalo et al., 2003). These contrasting results have been attributed to variations in DOM’s intrinsic properties and prior light exposure history, environmental controls (e.g. pH, iron, oxygen), ambient con-centrations of NH+4, and possibly methodological differences as well (Kieber et al., 1997; Gao and Zepp, 1998; Wang et al., 2000; Mopper and Kieber, 2002; Koopmans and Bronk, 2002; Buffam and McGlathery, 2003; Kitidis et al., 2008). The wide range of photoammonification results makes cross-region extrapolation difficult and consequently hampers the evaluation of the overall biogeochemical role of this process. DON in Arctic rivers is generally more enriched rel-ative to dissolved inorganic nitrogen (DIN) compared to other world rivers (Holmes et al., 2011). The Macken-zie River, the largest North American Arctic river, deliv-ers 2.2×10⁹mol DON yr−1to the Mackenzie Shelf and the Beaufort Sea (Holmes et al., 2011), but little is known of the transformation and fate of this terrestrial DON pool. Soluble reactive phosphorus in the surface southeastern (SE) Beau-fort Sea continues to decline after nitrate is exhausted by the vernal phytoplankton bloom (Simpson et al., 2008; Tremblay et al., 2008). This observation has led to propositions that new sources of bioavailable nitrogen, such as labile riverine DON (e.g. urea) and photochemically produced NH+4, may sustain primary production to some extent after the nitrate depletion (Tremblay et al., 2008).
DOM photochemistry becomes increasingly pertinent to Arctic biogeochemical cycles due to the sensitivity of the Arctic environments to climate warming (Amon, 2004; B´elanger et al., 2006; Osburn et al., 2009; Xie et al., 2009). Rising temperatures lead to sea ice decline, allowing more solar radiation available for DOM photooxidation in the wa-ter column. Tank et al. (2011) modeled Pan-Arctic photoam-monification rates using published apparent quantum yield (AQY) spectra from the Baltic Sea. Their results demon-strate that photoammonification in the top 10 m of the Arctic Ocean during the summer melting season can mineralize 5 % of the annual riverine DON input. In view of the potentially large cross-system varibility of photoammonification afore-mentioned, the validity of applying non-Arctic AQY data to Arctic environments is unclear. The present study, for the first time, measured the AQY spectra of tion in an Arctic marine system, modeled photoammonifica-tion rates using the obtained AQY data, and evaluated the biogeochemical implications of this photochemical process in the SE Beaufort Sea.
2 Methods
2.1 Sampling
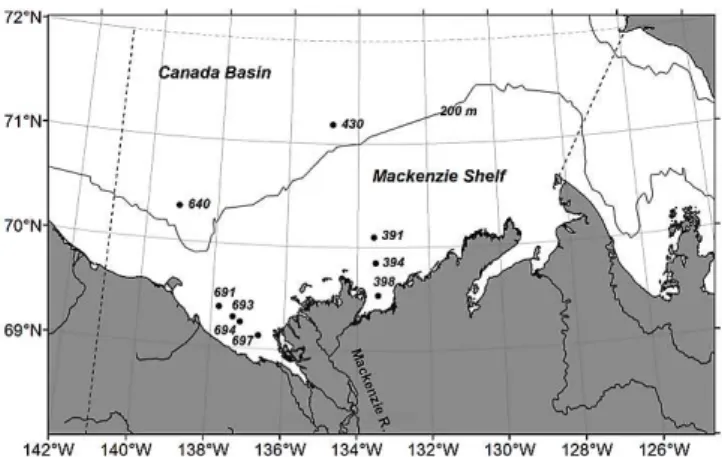
Fieldwork was carried out during the Mackenzie Light and Carbon (MALINA) program aboard theCCGS Amundsenin the SE Beaufort Sea from 31 July to 25 August 2009. Sam-pling stations for photoammonification experiments were distributed along two salinity-gradient transects extending from the mouth of the Mackenzie estuary to the Macken-zie Shelf (Fig. 1). Transect 390, encompassing Sta. 391, 394, 398, was located off the east channel of the estuary while transect 690, covering Sta. 691, 693, 694, 697, was situ-ated off the west channel. Also visited were two stations in the Canada Basin (Sta. 430 and 640). Twelve-liter standard Niskin bottles, mounted on a conductivity-temperature-depth (CTD) rosette, were used to take waters from the surface (3.3 m) at Sta. 640 and from 150 m at Sta. 430. The latter depth was located within the upper halocline of the Beaufort Sea water column. A small boat, released from theCCGS Amundsen, traversed the two estuarine transects character-ized by shallow waters. Surface waters were collected with a clean high-density polyethylene (HDPE) bucket into 10-l acid-c10-leaned HDPE jugs or co10-l10-lapsib10-le bags. Bu10-lk waters in both Niskin bottles and plastic jugs/bags were immedi-ately gravity-filtered through a Whatman Polycap 75 AS fil-ter capsule sequentially containing a 0.2 µm glass microfiber filter and a 0.2 µm Nylon membrane filter. Prior to sample collection, the capsules were thoroughly rinsed with Nanop-ure water and sample water to avoid potential contamination. The filtered samples were transferred into acid-cleaned 4-l clear-glass bottles, stored in darkness at 4◦C, and transported to a land-based laboratory for further treatment within two months of sample collection. Detailed sampling information is given in Table 1.
2.2 Irradiations
Samples brought back from the field were re-filtered with 0.2 µm polyethersulfone membrane filters immediately be-fore they were irradiated for determination of the AQY spectra of photoammonification (symbol 8NH+
4). Each re-filtered sample was directly poured into pre-combusted (420◦C) quartz-windowed cylindrical cells (i.d: 3.4 cm; length: 11.4 cm). Irradiations followed the procedure re-ported by Zhang et al. (2006). Briefly, the sample-filled quartz cells were irradiated in a temperature-controlled in-cubator (4◦C) using a SUNTEST CPS solar simulator
Table 1.Sampling information and physical and chemical properties of samples for8NH+ 4
determinations.
Lat. Long. Sa. Total T acdom,412
Location Sta. Date (◦N) (◦W) deptha depth Salinity (◦C) (m−1) SRb
(m) (m)
Transect 390
391 16/08 70.095 133.539 0 34.6 27.82 3.2 0.11 1.458 394 16/08 69.846 133.490 0 11.5 21.45 8.8 0.72 1.055 398 16/08 69.534 133.424 0 2.2 16.37 8.8 1.15 1.024
Transect 690
691 13/08 69.387 137.792 0 42.6 23.61 5.2 0.37 1.149 693 13/08 69.296 137.398 0 32.3 15.00 8.8 1.09 0.998 694 13/08 69.251 137.202 0 10.9 9.43 9.3 1.57 0.985 697 13/08 69.125 136.681 0 1.0 0.15 10.3 1.98 0.992
Offshore 430 18/08 71.184 134.748 150 1300 33.13 −1.4 0.17 1.527 640 11/08 70.334 139.099 3.3 550 21.43 2..2 0.29 1.323
a0 m depth indicates bucket samples. bS
R=S275–295/S350–400whereS275–295andS350–400are CDOM’s absorption spectral slopes over the wavelength ranges of 275–295 nm and
350–400 nm, respectively (Helms et al., 2008). Spectral slopes were calculated from the modelacdom,λ=acdom,λ0×exp[S×(λ0−λ)]whereλ0is a reference wavelength.
Fig. 1.Map of sampling stations. Solid line denotes the 200-m iso-bath and dashed line delimits the area for which NH+4 photoproduc-tion was modeled.
filter (least filtered light) was 706.3 W m−2in the wavelength range from 280–800 nm. Irradiation lasted from ca. 4–7 d, depending on the sample’s initial absorption coefficient. Par-allel incubations in darkness showed negligible thermal NH+4 production.
2.3 Analysis
Determination of NH+4 concentrations followed the fluoro-metric method of Holmes et al. (1999). Samples were mixed with a working regent containingo-phthaldialdehyde (OPA), sodium sulfite, and sodium borate. The addition of sodium sulfide minimizes potential interference from amino acids (Holmes et al., 1999). The sample and working reagent mix-ture was allowed to stay in the dark for 2.5 h before its flu-orescence was measured with a Trilogy Laboratory Fluo-rometer (Turner Designs). The procedure was calibrated
us-ing freshly prepared ammonium chloride aqueous solutions covering concentrations from 0 to 1.6 µmol l−1. Corrections were made for the sample’s background fluorescence and matrix effect caused by substances such as sea salts and DOM (Holmes et al., 1999). The amount of NH+4 photo-chemically produced was taken as the difference between the NH+4 concentration in the irradiated sample and that in the parallel dark control.
CDOM absorbance spectra were recorded at room temper-ature from 250 nm to 800 nm at 1 nm increments using a dual beam UV-visible spectrometer (Perkin Elmer, Lambda 35) fitted with a 5-cm quartz flow cell and referenced to HPLC-grade pure water (Ricca Chemical Company). A baseline correction was applied by subtracting the absorbance value averaged over an interval of 5 nm around 685 nm from all the spectral values (Babin et al., 2003). CDOM absorption coef-ficient (basee) at wavelengthλ,acdom,λ(m−1), is calculated as 2.303 times the absorbance divided by the cell’s light path-length in meters. The lower detection limit ofacdomanalysis,
defined as three times the standard deviation of five replicate blank measurements using Nanopure water, was 0.02 m−1 over 250 nm to 700 nm.
on freshly collected samples using an Autoanalyzer 3 (Bran + Luebbe) with colorimetric methods adapted from Grasshoff et al. (1999). Total dissolved amino acids (TDAA) were measured as OPA derivatives using an Agilent 1100 high performance liquid chromatography system with a flu-orescence detector (Davis and Benner, 2005). Salinity (ex-cept bucket samples) and temperature were recorded using a SeaBird 911+ CTD profiler. Salinity for bucket samples was determined using an AutoSal 8400B salinometer (precision:
±0.002).
2.4 Retrieval of ammonium AQY
The spectral AQY of NH+4,8NH+
4,λ, is defined as the number of moles of NH+4 produced per mole of photons absorbed by CDOM at wavelengthλ. The number of photons absorbed by CDOM at λ, Qa,λ (mol photons s−1nm−1), was calculated according to Eq. (1) (Hu et al., 2002):
Qa,λ=A×Q0,λ× acdom,λ acdom+w,λ
1−exp −acdom+w,λ×L
, (1)
whereA(m−2) andL(m) denote, respectively, the cross sec-tion and pathlength of the irradiasec-tion cell,Q0,λ the photon flux just below the front window of the cell, andacdom+w,λ the sum of absorption by CDOM (acdom,λ) and water (aw,λ). Values of aw,λ were taken from Pope and Fry (1997) and Buiteveld et al. (1994) for the visible and UV domains, re-spectively.
8NH+
4,λ was derived with an iterative curve-fit protocol previously established to model AQYs of CO and CO2
pho-toproduction under polychromatic light (Johannessen and Miller, 2001; Zhang et al., 2006). Ziolkowski and Miller (2007) confirmed that this multi-spectral approach agrees with the conventional monochromatic method for retriev-ing CO AQY spectra. Briefly, this method assumed an ap-propriate mathematical form with unknown parameters to express the change of8NH+
4 as a function of wavelength. The amount of NH+4 produced in an irradiation cell over the exposure time could then be predicted as the product of the assumed 8NH+
4 function and the number of pho-tons absorbed by CDOM integrated over the 280–500 nm wavelength range, assuming negligible NH+4 production at wavelengths>500 nm (Sect. 3.2). The optimum values of the unknown parameters in the assumed 8NH+
4 function were obtained by varying these parameters from initial es-timates until the minimum difference between the measured and predicted production is achieved. The following quasi-exponential form was adopted to fit the data:
8NH+ 4,λ
=m1×exp
m
2 λ+m3
(2) wherem1,m2, andm3are fitting parameters. This function
generally performs better, particularly in the long UV and visible wavelengths, than the simple 2-parameter exponen-tial form (Supplement Table SM1) (B´elanger et al., 2006;
Zhang et al., 2006; Xie et al., 2009). It is similar to the two-part exponential equation adopted by several previous stud-ies to characterize the multiple exponential behavior of CO AQY spectra (Zafiriou et al., 2003; Stubbins et al., 2006; Zi-olkowski and Miller, 2007). NH+4 production rates predicted from the retrieved8NH+
4 spectra agreed well with measured rates, withr2ranging from 0.976–0.997 (Table 2).
2.5 Blank, reproducibility and linearity
The blank, reproducibility, and linearity of NH+4 photopro-duction were tested only with radiation under cutoff filter WG280 and on a limited number of samples due to con-strains on irradiation time and sample volumes. To deter-mine the blank, six quartz cells were filled with HPLC-grade pure water (Ricca Chemical Company) and irradi-ated for 9.8 d. This gave an NH+4 photoproduction rate of−0.08±2.6 nmol l−1d−1(mean±2 s.d., 95 % confidence interval; all uncertainty expressions hereinafter are based on the 95 % confidence interval). The reproducibility was eval-uated on the sample from Sta. 430 (irradiation time: 11.5 d), arriving at a rate of 17.9±3.6 nmol l−1d−1 or 20 % (n=
6). The 10 % relative standard deviation should represent or approach the uncertainties for NH+4 photoproduction un-der shortwave cutoff irradiations described above (WG280, WG295, WG320) but likely to underestimate the uncertain-ties under longwave cutoff irradiations (WG345, GG395, GG435) where NH+4 productions were substantially lower (Sect. 3.2). A time-course irradiation was performed on a filtration-sterilized Mackenzie River water sample collected from the east channel of the Mackenzie Delta slightly up-stream of Inuvik, the Northwest Territory of Canada, on 11 June 2009. NH+4 concentration increased linearly within the first 6.74 d, close to the longest irradiation times for8NH+ 4 determination (Sect. 2.2). Photoammonification continued thereafter at a lower rate (Fig. 2), consistent with previous studies (e.g. Bushaw et al., 1996; V¨ah¨atalo and Zepp, 2005). Similar kinetic patterns are expected for samples collected from the two estuarine transects, which were strongly influ-enced by the Mackenzie runoff. The kinetic behavior for off-shore Sta. 640 and 430 was, however, less certain, since the riverine impact there was weaker.
3 Results and discussion
3.1 Physicochemical properties
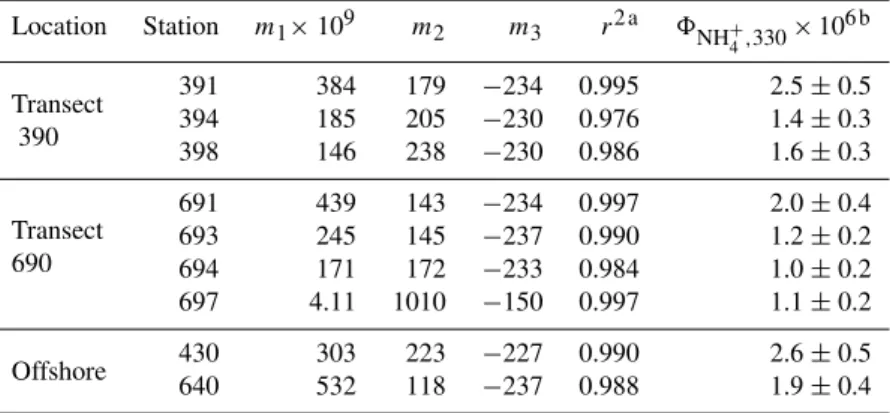
Table 2.Fitted parameters for Eq. (2) and AQY of photoammonification at 330 nm (unit: mol NH+4 (mol quanta)−1).
Location Station m1×109 m2 m3 r2 a 8NH+4,330×106 b
Transect 391 384 179 −234 0.995 2.5±0.5
390 394 185 205 −230 0.976 1.4±0.3
398 146 238 −230 0.986 1.6±0.3
Transect
691 439 143 −234 0.997 2.0±0.4
690
693 245 145 −237 0.990 1.2±0.2 694 171 172 −233 0.984 1.0±0.2 697 4.11 1010 −150 0.997 1.1±0.2
Offshore 430 303 223 −227 0.990 2.6±0.5 640 532 118 −237 0.988 1.9±0.4
aCoefficients of determination (r2) are from linear regressions between modeled and measured
ammonium production rates.
b95 % confidence interval calculated from the combined varibility of factors used to determine8 NH+4,λ
(i.e. measured NH+
4 photoproduction rate,Q0,λandacdom,λin Eq. 1).
Fig. 2.NH+4 concentration as a function of irradiation time for the sample collected in June 2009 from the mid-channel of the Macken-zie River off Inuvik, the Northwest Territory of Canada. The sample was exposed to full-spectrum irradiation. Line connects mean of du-plicates at each irradiation time point.
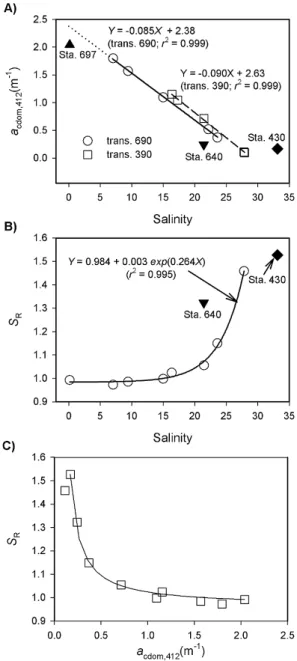
lower than those at Sta. 391 and 691 on the Mackenzie Shelf. Sea surface temperature (SST) trended inversely to salinity, decreasing from inshore to offshore. SST ranged from 5.2◦C to 10.3◦C along transect 690 and from 3.2◦C to 8.8◦C along transect 390, with the lowest SST occurring at Sta. 640 (2.2◦C). CDOM absorption coefficients (as examplified by acdom,412) were negatively correlated with salinity for both
transects excluding Sta. 697 (Fig. 3a), indicating conserva-tive mixing behavior across the land-ocean transitional zone. However,acdom,412at the innermost Sta. 697 was 20 % lower
(1.98 m−1vs. 2.38 m−1) than expected from the linear fit for the outer section of transect 690, suggesting CDOM input slightly downstream of Sta. 697. The process responsible for this input was unclear but could be linked to episodic sedi-ment resuspensions due to shallow water depths there. The CDOM mixing line of transect 390 was consistently above
that of transect 690 within the encountered salinity range (Fig. 3a), implying a larger CDOM end member in the east channel of the Mackenzie River. Sta. 640’sacdom,412lay
be-low the mixing lines of the two transects, since sea ice melt-water was depleted with CDOM (Matsuoka et al., 2012). On the contrary, Sta. 430’s subsurface sample (150 m deep) ex-hibitedacdom,412far greater than inferred from the two
mix-ing lines (Fig. 3a). This observation is consistent with the finding that the upper halocline water of the Beaufort Sea, originating from the Pacific winter water mass formation, entrains organic-rich freshwater during its northward transit along the Alaska coast (Matsuoka et al., 2012).
The spectral slope ratio, SR, as defined in Table 1, has
been used as an indicator of CDOM molecular weight with a lower SR, implying high molecular weight typical of a
stronger terrestrial CDOM signature (Helms et al., 2008). TheSRvs. salinity relationship for the combined data of
tran-sects 390 and 690 could be well described by a 3-parameter exponential function (Fig. 3b).SR displayed little variation
at salinity<21.5 but increased rapidly with salinity at val-ues>23. Station 640’sSRwas well above the trendline for
the two transects, whereas Sta. 430’s was far below it. There-fore, CDOM was of more marine character at Sta. 640 but of more terrestrial nature at Sta. 430 than expected from their salinities. IfSRwas plotted againstacdom,412, all data points
closely followed the mixing line constructed from Sta. 697 and Sta. 430 as end members, (Fig. 3c), suggesting that CDOM was a more conservative tracer than salinity for de-scribing the dynamics ofSR.SRremained quite constant at acdom,412>0.7 m−1 and rose quickly withacdom,412 at
val-ues<0.4 m−1. Both theSR-salinity and SR-acdom,412plots
thus categorize the sampling stations into two groups. Group 1, covering Sta. 394, 398, 693, 694 and 697 withSRranging
Fig. 3.Plots of CDOM absorption coefficient at 412 nm vs. salin-ity (A) and plots of spectral slope ratio vs. salinity (B) and
acdom,412(C). Panel(A)solid and dashed lines are best fits for tran-sects 690 (excluding Sta. 698) and 390, respectively; dotted line is the extrapolation from the solid line. Panel(B)circles represent data combining transects 390 and 690 (excluding Sta. 430 and Sta. 640); line is best fit of circles. Panel(C)line is the conservative mixing line ofSRvs.acdom,412using Sta. 697 as the riverine end member
and Sta. 430 as the marine end member.
691 withSRranging from 1.149–1.527, carried CDOM
hav-ing a significant marine signature. It should be pointed out that photobleaching also increasesSR(Helms et al., 2008).
The largely conservative behaviors ofacdom(Fig. 3a) andSR
(Fig. 3c), however, suggested that photoleaching should not be the dominant factor controllingSRin the study area. The
lack of substantial photobleaching observed in the present study is consistent with the conclusion of a previous photo-bleaching modeling study for the Mackenzie Shelf area (Os-burn et al., 2009).
3.2 Indicators of ammonium photoproduction
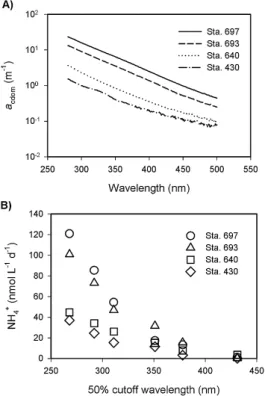
Figure 4 shows typical coastal and offshore CDOM absorp-tion spectra and the corresponding NH+4 photoproduction rates as a function of cutoff wavelength observed in labo-ratory irradiations. NH+4 production rate decreased rapidly with increasing cutoff wavelength with the production under cutoff filter GG435 (50 % transmittance cutoff at 430 nm) being <8 % of the production under cutoff filter WG280 (50 % transmittance cutoff at 268 nm). High-CDOM samples consistently gave high NH+4 production rates, particularly at short cutoff wavelengths. NH+4 production decreased approx-imately linearly with salinity (r2=0.718,n=9,p <0.01), excluding the June Mackenzie River water sample. The lat-ter showed a much higher NH+4 production rate compared to the freshest sample (Sta. 697, salinity 0.15) that was taken in August (Fig. 5a). However, such inconsistency was es-sentially absent for the relationship of NH+4 production to CDOM (Fig. 5b). The two exhibited a good positive, lin-ear correlation (r2=0.945,n=10,p <0.01). NH+4 produc-tion also increased linearly with DON (r2=0.912, n=7, p <0.01) and TDAA (Fig. 5c and d). For TDAA, Sta. 691 was an exception whose NH+4 production was much lower than expected from the highly elevated TDAA level. Conse-quently, NH+4 production was only weakly related to TDAA (r2=0.492,n=7,p >0.05). Hence amino acids, of which >90 % were combined forms (R. Benner, unpublished data, 2012), were probably not the predominant precursors of NH+4 photoproduction. Tarr et al. (2001) reached a similar conclusion based on a mechanism study on photoammonifi-cation of natural organic matter. Our supposition is also in line with the finding that the concentrations of TDAA in the Broad River, South Carolina, are controlled primarily by mi-crobial utilization rather than photodegradation (Benner and Kaiser, 2011).
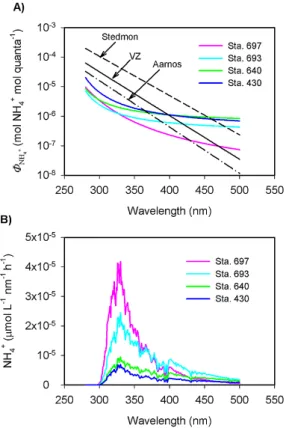
3.3 AQYs of ammonium photoproduction
Fitted parameters for Eq. (2) are shown in Table 2 and 8NH+
4 spectra representative of coastal and offshore wa-ters are displayed in Fig. 6a. Offshore wawa-ters (Sta. 430 and 640) had higher 8NH+
4 values than did coastal wa-ters (Sta. 693 and 697) at wavelengths >300 nm. 8NH+ 4 for Sta. 697 decreased with wavelength more quickly than 8NH+
Fig. 4.Typical CDOM absorption spectra(A)and their correspond-ing NH+4 photoproduction rates as a function of cutoff wavelength observed from laboratory irradiations(B).
are generally lower in the UV wavelengths and sim-ilar or higher in the visible wavelengths (Fig. 6a). The overall range of AQY at 330 nm in the present study was from 1.0×10⁻⁶mol NH+4 (mol quanta)−1 to 2.6×10⁻⁶mol NH+4 (mol quanta)−1, which are far be-low those observed by V¨ah¨atalo and Zepp (2005) (range: 11×10−6–61×10−6mol NH+4 (mol quanta)−1) and Sted-mon et al. (2007) (range: 27×10−6–144×10−6mol NH+4 (mol quanta)−1) but close to the lower end of those reported by Aarnos et al. (2012) (range: 3.5×10⁻⁶– 11×10−6mol NH+4 (mol quanta)−1). To the best of our knowledge, these are the only published photoammonifi-cation AQYs and they were all obtained from the Baltic Sea, with the data of Aarnos et al. (2012) covering larger spatiotemporal scales. Our lower AQY values, particularly in the most photochemically active UV wavelengths, may indicate a lower photoreactivity of DON in our sampling area, reflecting the fact that the water discharged into the Baltic Sea is much more strongly impacted by human ac-tivity (e.g. agriculture) than the water flowing into the Beau-fort Sea. However, the lower irradiation temperature adopted in the present study, 4◦C vs. near room temperature in the studies by V¨ah¨atalo and Zepp (2005) and Stedmon et al. (2007), should also have decreased the AQY values, since DOM photochemical reactions, such as CO photoproduction (Zhang et al., 2006), can be temperature dependent. Aarnos
Fig. 5.Plots of ammonium photoproduction rate vs. salinity(A), CDOM absorption coefficient(B), dissolved organic nitrogen(C), and total dissolved amino acids(D). Data labels represent station numbers and MKZR denotes the June 2009 sample collected in the Mackenzie River near Inuvik (see Sect. 2.5). No DON and TDAA data are available for the MKZR station. NH+4 photoproduction rates were determined under cutoff filter WG280.
et al. (2012) used a similarly low irradiation temperature (5◦C), which may partly explain the much smaller differ-ence between their results and ours. Hdiffer-ence, photoammonifi-cation is plausibly a strong temperature-dependent process. Note that our lower AQYs could also be partly caused by the relatively long exposure periods (4–7 d), since8NH+
Fig. 6.Examples of apparent quantum yield(A) and action(B)
spectra of photoammonification. Also shown in panel(A)are AQY spectra from the literature. VZ stands for V¨ah¨atalo and Zepp (2005) (station LL12), Stedmon for Stedmon et al. (2007) (station Kotka), and Aarnos for Aarnos et al. (2012) (station III-Gulf of Finland).
2005). The linear relationship between photoammonification and irradiation time (Fig. 2; at irradiation times<7 d), how-ever, implied that the photoammonificable DON was not the limiting factor, at least for the riverine DOM-dominated sam-ples. Because the offshore samples were subjected to longer exposures but had higher8NH+
4 compared with the nearshore samples, substrates did not appear to be exhausted in the offshore samples either. The linear correlation between the photoammonification rate under the WG280 cutoff filter and acdom(Fig. 5a) further corroborated that substrate-limitation
was unimportant, since samples under the WG280 cutoff filter received the highest UV irradiance and CDOM ab-sorbed very different amounts of photons among different samples. Use of aged samples (see Sect. 2.1) might lead to lower8NH+
4 values as well if loss of photoammonificable DON occurred during sample storage. Nevertheless, acdom
changed little over the two-month storage period (Supple-ment Fig. SM1), which, combined with the linear relation-ship between the photoammonification rate andacdom,
sug-gested that the storage effect was minimal.
To evaluate the spectral dependence of photoammonifica-tion in natural waters, acphotoammonifica-tion spectra were calculated asQλ×
acdom,λ×8NH+
4,λ, whereQλ(mol photons m
−2s−1nm−1) is
the surface spectral solar photon fluxes at 70◦N, 133◦W at
14:00 local time on 1 July, simulated using the SMARTS model (Simple Model of the Atmospheric Radiative Trans-fer of Sunshine; Gueymard, 2001) under mid-summer Arc-tic atmospheric and cloudless conditions with an ozone col-umn burden of 330 Dobson Units. The NH+4 action spectra (Fig. 6b), characterized by a non-Gaussian shape with a long tail in the visible, are like those of CO and CO2(Zhang et al.,
2006; White et al., 2010). They demonstrate that UVB radi-ation (280–320 nm) contributed 8–18 %, UVA (320–400 nm) 58–71 %, and visible (400–500 nm) 11–33 % of the surface NH+4 photoproduction integrated over the full active wave-length range (280–500 nm). The dominant role of UVA ob-served in the present study is consistent with previous results (Bushaw et al., 1996; V¨ah¨atalo and Zepp, 2005; Stedmon et al., 2007; Aarnos et al., 2012). Notably, the offshore sites (Sta. 430 and 640) held the lowest contributions from UVB (10 % and 8 %) and the highest contributions from the visi-ble (31 % and 33 %) while the most nearshore sites (Sta. 398 and 697) behaved conversely, 13 % and 18 % from UVB and 21 % and 11 % from the visible. This spectral contribution pattern is consistent with the8NH+
4 spectra of the nearshore samples being steeper than those of the offshore samples (Fig. 6a). Notwithstanding the widely differing values and/or spectral shapes of acdom and 8NH+4 (Figs. 4a and 6a), all
action spectra converge at the same wavelength (330 nm) giving the maximum NH+4 production rates (Fig. 6b). This wavelength is similar to the peak production wavelengths ex-hibited by CO and CO2action spectra (Zhang et al., 2006;
White et al., 2010).
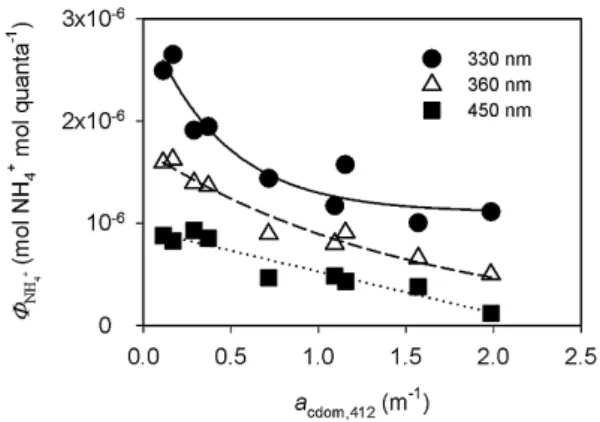
Previous studies have revealed that CO AQYs are linearly and positively correlated with CDOM absorption coefficients (Xie et al, 2009; Stubbins et al., 2011). Here we also tested the relationship between8NH+
4 andacdomand found the two variables to be inversely correlated. Based on the residual sum of squares (RSS) and the adjusted coefficient of deter-mination (adjusted r2) of the regression between the pre-dicted and determined8NH+
4, the relationship between8NH + 4 andacdom switched from being linear over 421–500 nm to
a 2-parameter single exponential over 350–420 nm to a 3-parameter single exponential over 290–349 (Fig. 7). It should be noted that the8NH+
4 versusacdompatterns identified here did not necessarily imply a causative relationship between the two parameters. 8NH+
4 was more likely controlled by the chemical characteristics of CDOM than by CDOM abun-dance. As low-CDOM samples contained a larger component of CDOM of marine origin (Sect. 3.1), the inverse correspon-dence between 8NH+
Fig. 7.Regression analysis between NH+4 apparent quantum yields and CDOM absorption coefficients at 412 nm at three selected wavelengths, 330 nm, 360 nm, and 450 nm. Data were fitted to the equations ofY =1.1×10⁻⁶+1.9×10⁻⁶exp(−2.3X)at 330 nm (solid line;r2=0.914),Y =1.7×10⁻⁶exp(−0.65X)at 360 nm (dashed line;r2=0.960), andY =9.3×10⁻⁷−4.1X(dotted line;
r2=0.912).
salinity (Fig. 3), it is not surprising that 8NH+
4 increased with salinity (data not shown), excluding the ice meltwater-influenced Sta. 640. Aarnos et al. (2012) identified a similar 8NH+
4-salinity relationship for the Baltic Sea. A closer exam-ination further revealed that8NH+
4 co-varied with the molar DON : DOC ratio (Fig. 8), the latter increasing linearly with salinity (r2=0.718,n=7,p <0.02). The higher8NH+
4 in offshore waters was thus likely linked to the higher quality of DOM in terms of the relative DON abundance.
3.4 Modeling ammonium photoproduction
The photoammonification rate at the surface (0 m), PNH+
4,0(mol NH + 4 m
−3d−1), were calculated using Eq. (3):
PNH+ 4,0=
500
Z
290
Q0−,λ×acdom,λ×8NH+
4,λ×dλ (3) Q0−,λ denotes the scalar photon flux just beneath the surface (mol photons m−2d−1nm−1), which was estimated as 1.3 times the downwelling photon flux, Qd0−,λ (Gor-don, 1989). Assuming negligible backscattering of light to the atmosphere and vertical homogeneity of 8NH+
4 and light-absorbing constituents in the photic layer, the wa-ter column or depth-integrated photoammonification rate, PNH+
4,col(mol NH +
4 m−2d−1), is given by Eq. (4):
PNH+ 4,col
=
500
Z
290
Qd0−,λ× acdom,λ
at,λ
×8NH+ 4,λ
×dλ. (4)
Hereat,λ denotes the total absorption coefficient (m−1), i.e. the sum of the absorption coefficients of CDOM, par-ticles, and seawater. The study area was divided into two
Fig. 8.Plot of NH+4 apparent quantum yield at 330 nm vs. the molar DON : DOC ratio. Data labels represent station numbers.
sub-regions: the Mackenzie Shelf with total water depths <200 m and the Canada Basin farther offshore (Fig. 1). Monthlyacdom,λ:at,λratios andat,412values were retrieved
from the ocean color data of the Sea Wide field-of-view Sen-sor (SeaWiFS) using the empirical algorithm of B´elanger et al. (2008) and the quasi-analytical algorithm of Lee et al. (2002; IOCCG, 2006), respectively. Thenacdom,412 was
calculated as the product of theacdom,λ:at,λratio andat,412
(B´elanger, 2006). 8NH+
4,λ was fitted to acdom,412 based on the wavelength-specific relationships shown in Fig. 7. Fitting results are presented as online supplemental materials (Sup-plement Table SM2). DailyQd0−,λ values were computed at 5-nm intervals using pre-computed look-up-table (LUT) generated using the Santa Barbara DISORT Atmospheric Ra-diative Transfer (SBDART) software tool (Ricchiazzi et al., 1998). The LUT inputs were the solar zenith angle, total ozone concentration, cloud fraction over the pixel, and cloud optical thickness. The last three parameters, derived from satellite data following the method developed by Zhang et al. (2004) to produce global radiative flux data (FD), were obtained from the International Satellite Cloud Climatol-ogy Project (ISCCP) website. The ISCCP-FD data were dis-tributed on a 280-km equal-area grid at 3-h intervals for dates between January 1983 and December 2009. This method was previously validated against in situ irradiance measurements (Xie et al., 2009). Daily surface ice concentration data de-rived from passive microwaves sensors (SSMI) were pro-vided by the US National Snow and Ice Data Center. Monthly and annualPNH+
4,0 andPNH +
4,col were calculated at spatial resolutions of one L3 SeaWiFS pixel (9.28 km×9.28 km).
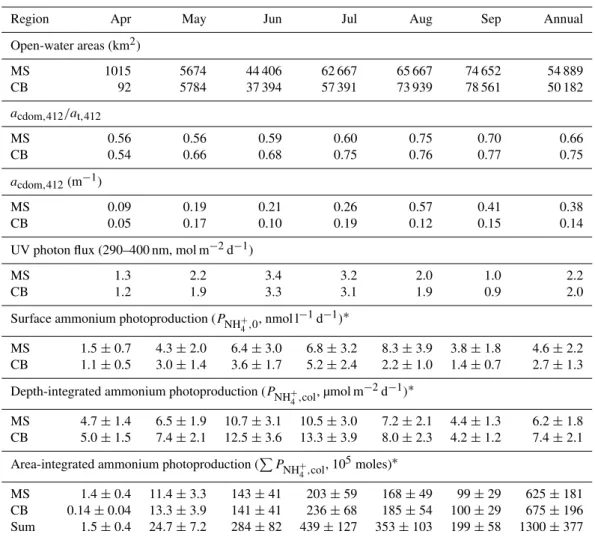
Table 3 summarizes PNH+
4,0 and PNH +
4,col, along with other relevant parameters for each sub-region. Seasonally, PNH+
4,col reached maximum in June on the Mackenzie Shelf (10.7 µmol m−2d−1) and in July in the Canada Basin (13.3 µmol m−2d−1), and decreased gradually toward suc-cessively earlier and later months of the year. As the June or July acdom:at ratio was not highest on a yearly
Table 3.Modeled monthly ammonium photoproduction rates in open waters of the SE Beaufort Sea in 2009, along with open-water areas, ocean color-derivedacdom,412:at,412ratios andacdom,412, and downwelling UV photon fluxes. Open-water areas excluded those where no
ocean-color data were available. Lack of ocean color data also left out October and November. December to March were omitted due to nearly complete ice cover. MS stands for Mackenzie Shelf and CB for Canada Basin.
Region Apr May Jun Jul Aug Sep Annual
Open-water areas (km2)
MS 1015 5674 44 406 62 667 65 667 74 652 54 889
CB 92 5784 37 394 57 391 73 939 78 561 50 182
acdom,412/at,412
MS 0.56 0.56 0.59 0.60 0.75 0.70 0.66
CB 0.54 0.66 0.68 0.75 0.76 0.77 0.75
acdom,412(m−1)
MS 0.09 0.19 0.21 0.26 0.57 0.41 0.38
CB 0.05 0.17 0.10 0.19 0.12 0.15 0.14
UV photon flux (290–400 nm, mol m−2d−1)
MS 1.3 2.2 3.4 3.2 2.0 1.0 2.2
CB 1.2 1.9 3.3 3.1 1.9 0.9 2.0
Surface ammonium photoproduction (PNH+ 4,0
, nmol l−1d−1)∗
MS 1.5±0.7 4.3±2.0 6.4±3.0 6.8±3.2 8.3±3.9 3.8±1.8 4.6±2.2 CB 1.1±0.5 3.0±1.4 3.6±1.7 5.2±2.4 2.2±1.0 1.4±0.7 2.7±1.3
Depth-integrated ammonium photoproduction (PNH+ 4,col
, µmol m−2d−1)∗
MS 4.7±1.4 6.5±1.9 10.7±3.1 10.5±3.0 7.2±2.1 4.4±1.3 6.2±1.8 CB 5.0±1.5 7.4±2.1 12.5±3.6 13.3±3.9 8.0±2.3 4.2±1.2 7.4±2.1
Area-integrated ammonium photoproduction (P
PNH+ 4,col
, 105moles)∗
MS 1.4±0.4 11.4±3.3 143±41 203±59 168±49 99±29 625±181 CB 0.14±0.04 13.3±3.9 141±41 236±68 185±54 100±29 675±196 Sum 1.5±0.4 24.7±7.2 284±82 439±127 353±103 199±58 1300±377
∗95 % confidence intervals calculated from the combined variability of factors used to determineP
NH+4,0(i.e.Q0−,λ,acdom,λ, and 8
NH+ 4,λ
in Eq. 3) andP NH+
4,col
(i.e.Qd0−,λ,acdom,λ/at,λ, and8NH+ 4,λ
in Eq. 4).
PNH+
4,col in both sub-regions. The seasonality of PNH + 4,0 in the Canada Basin parelleled that of PNH+
4,col, attain-ing a peak value of 5.2 nmol l−1d−1 in July. The maxi-mum PNH+
4,0 on the shelf, however, occurred in August (8.3 nmol l−1d−1), two months later than the maximum PNH+
4,col, due to the much higheracdom in August as com-pared to June (acdom,412: 0.57 m−1vs. 0.21 m−1). This
pat-tern could be attributed to the characteristic CDOM dynam-ics occurring on the Mackenzie Shelf revealed by satellite-derived ocean color data (B´elanger et al., 2006). CDOM from freshwater runoff is held close to the shore by sea ice in spring and extends offshore after sea ice breakup in early summer. Consequently, riverine CDOM is more extensively spread over the shelf in August, about two to three months after the peak discharge of the Mackenzie River, resulting
in a larger amount of photochemically active solar energy being absorbed near the sea surface. Spatially,PNH+
4,0was higher on the shelf than in the basin as a result of higher shelfacdom(Table 3).PNH+
4,col, nevertheless, exhibited a pat-tern opposite to that ofPNH+
4,0, since both theacdom:at ra-tio and8NH+
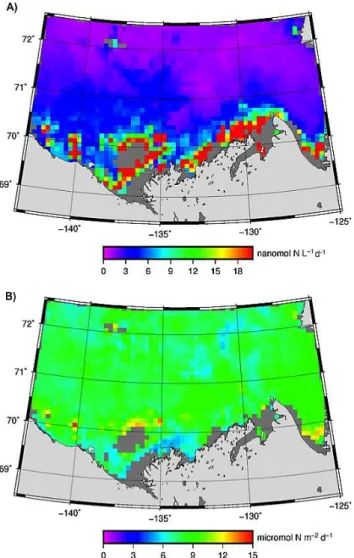
4 were higher offshore. Finer distributional pat-terns ofPNH+
4,0andPNH +
4,colcan be gleaned from their con-tour maps (Fig. 9). Consistent with decreasing acdom
sea-ward, PNH+
4,0 steadily declined from the shore to the open ocean.PNH+
4,colin the basin displayed relatively small vari-ations and clearly exceeded PNH+
4,col in particles-rich wa-ters close to the land. There existed a narrow strip of high PNH+
4,col, particularly west of 135 ◦
Fig. 9.Contour maps of modeled NH+4 photoproduction rates at the sea surface (PNH+
4,0,A) and in the entire water column (PNH + 4,col,
B) in August 2009. Grey color denotes lack of satellite ocean color data due to sea ice, persistent cloud cover or extreme turbidity.
with highly elevatedacdom:atratios, reaching up to 90 % at
412 nm, in a similarly confined zone observed by B´elanger et al. (2008; their Fig. 9). Note that the onshore–offshore pat-terns of photoammonification rates revealed in the present study were relatively consistent across a fairly broad expanse of the Beaufort Sea. It is, therefore, worthwhile to verify in future studies if similar patterns also exist in other Arc-tic seas. At the same time, caution should be exercised to apply our photoammonification rates to other coastal waters of the Arctic Ocean, given that the chemical characteristics (e.g. DON and DOC concentrations, particle loads) of the Mackenzie River are quite different from those large Siberian rivers (Dittmar and Kattner, 2003; Holmes et al., 2011).
V¨ah¨atalo and Zepp (2005) modeled the summer-season (May–August) photoammonification rates in the Baltic Sea using a simplified approach. They yielded surface
produc-tion rates spanning from 31 nmol l−1d−1to 331 nmol l−1d−1 (mean: 143 nmol l−1d−1) and water column produc-tion rates from 16 µmol m−2d−1 to 102 µmol m−2d−1 (mean: 53 µmol m−2d−1), which are substantailly higher than our summertime (June–August) surface (range: 2.9– 8.1 nmol l−1d−1; mean: 5.5 nmol l−1d−1) and water column (range: 7.1–12.9 µmol m−2d−1; mean: 10.0 µmol m−2d−1) production rates. Main elements contributing to this differ-ence are the much smaller 8NH+
4 in the UV wavelengths (Sect. 3.3) and relatively lower solar insolation in the SE Beaufort Sea as compared to those in Baltic Sea. The as-sumption made by V¨ah¨atalo and Zepp (2005) that all light in the water column is absorbed by CDOM (i.e. acdom, λ:at,λ=1) should also somewhat bias their rates upward (see B´elanger et al., 2008). In a more recent Baltic Sea survey, Aarnos et al. (2012) reported much lower summer-time production rates ranging from∼6 to 22 µmol m−2d−1 (mean:∼13 µmol m−2d−1), which are close to our rate for the SE Beaufort Sea. Tank et al. (2011) modeled the Pan-Arctic photoammonification rates using AQY spectra re-proted in the literature and arrived at a summertime (June– August) rate of∼33 µmol m−2d−1, with a range across an order of magnitude, depending on the choice of the AQY spectrum. The summertime rates we obtained for the SE Beaufort Sea are within the lower end of their range.
Area-integrated NH+4 photoproduction,PP
NH+4,col,
dis-played similar seasonal and regional patterns to those of PNH+
4,col, reaching a maximum in July and ascending from nearshore to offshore (Table 3). April was an exception, when P
PNH+
4,col was much lower in the basin than on the shelf (0.14×10⁵ vs. 1.4×10⁵moles) due obviously to the much smaller ice-free surface area in the former re-gion in early spring (92 vs. 1015 km2). The total annual NH+4 photoproduction in the entire study area was estimated to be 1.3×10⁸ moles, of which 85 % (1.1×10⁸ moles) was contributed by the summer season (June–August). Note that this assessment omitted the open water areas where no satellite-based ocean color data were available. The underes-timation stemming from this omission was calculated to be 1.2×10⁷ moles, assuming a constantacdom,412:at,412 ratio
of 0.70 and a constantat,412of 0.15 m−1based on a previous
estimates by 30 % as well, i.e. 1.8×10⁸mol yr−1under ac-tual ice-cover conditions or 2.7×10⁸mol yr−1under totally ice-free conditions, assuming equal AQYs of POM- and DOM-based photoammonification, as is generally the case for CO (Xie and Zafiriou, 2009; G. Song et al., unpublished data, 2012).
3.5 Biogeochemical implications
The biogeochemical ramifications of photoammonification can be evaluated by comparision with other major nitrogen fluxes in the SE Beaufort Sea. The Mackenzie River annually supplies 2.2×10⁹moles of DON, 1.9×10⁹moles of DIN (Holmes et al., 2011), and 1.0×10⁵ moles of NH+4 (Mc-Clelland et al., 2008) to the Beaufort Sea. A yearly NH+4 production of 1.4×10⁸ moles, therefore, provides a DIN source equivalent to 7 % of the riverine DIN input and 1400 times the riverine NH+4 discharge. A yearly NH+4 produc-tion of 2.1×10⁸ moles for the completely ice-free
situa-tion would raise these quantities correspondingly to 11 % and 2100 times under otherwise identical conditions. Assuming 80 % ofacdomon the shelf and 50 % ofacdomin the basin to
be of terrestrial origin (B´elanger et al., 2006), we estimated that photoammonification in the study area could mineralize 4 % (8.8×10⁷moles yr−1) and 6 % (1.3×10⁸moles yr−1) of the annual riverine DON discharge under the actual ice-cover and totally ice-free scenario, respectively. Regarding the role of photoammonification as a DIN source, more im-portant than the numeric values is the timing of this process. As discussed in Sect. 3.4, 85 % of the annual NH+4 photo-production took place between June and August, over which the Mackenzie River only delivers 30 % of its annual DIN (mainly nitrate) flux (Emmerton et al., 2008; Holmes et al., 2011). Nitrogen is the limiting element for the growth of heterotrophic prokaryotes on the Mackenzie Shelf in sum-mer (Ortega-Retuerta et al., 2012). Riverine DIN can thus be essentially used up on the shelf before being exported offshore. Ecosystem modeling has, however, demonstrated that currently recognized DIN sources are short of support-ing offshore primary productivity observed in the MALINA sampling season (August) (V. Lefouest, unpublished data, 2012). A missing DIN source of 6.0 µmol m−2d−1, which accounts for 25 % of total DIN uptake in the top 10-m layer, is required to fill the gap. This missing nitrogen is com-parable in magnitude to the August NH+4 photoproduction rate (8.0 µmol m−2d−1) obtained from the present study (Ta-ble 3). Hence, photoammonification probably drives a pre-viously unrecognized primary production pathway that is at least partly responsible for the continued decline of solu-ble reactive phosphorus after nitrate is depleted in the upper SE Beaufort Sea following the spring phytoplankton bloom (Tremblay et al., 2008). Notably, heterotrophic prokaryotes compete with primary producers for photochemically formed NH+4, since heterotrophic prokaryotic activity in the offshore Beaufort Sea surface water is also nitrogen-limited in
sum-mertime (Ortega-Retuerta et al., 2012). The relative impor-tance of these two NH+4 uptake pathways remains to be elu-cidated.
3.6 Stoichiometry of DOM photooxidation
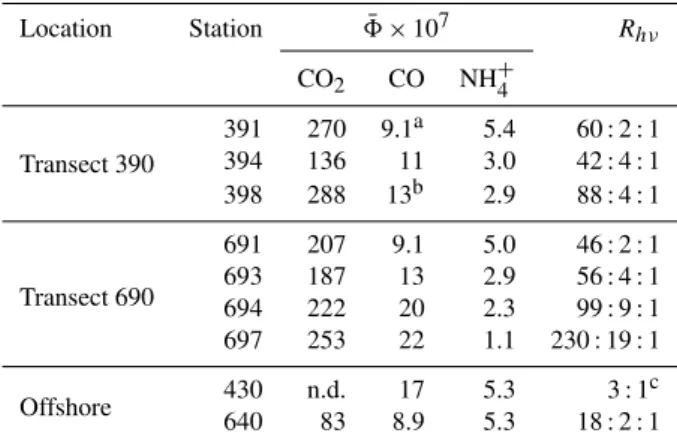
In addition to8NH+
4, AQYs of CO (8CO) and CO2(8CO2) were concomitantly determinated (G. Song et al., unpub-lished data, 2012). Methods for8COand8CO2 determina-tions can be found in the studies by B´elanger et al. (2006), Zhang et al. (2006), and Xie et al. (2009). Such concur-rent measurements made it feasible to explore the stoichiom-etry among the three photoproducts, i.e. the molar ratio of CO2: CO : NH+4 (Rhν). Rhν was, however, wavelength-dependent, since the shape of AQY vs. wavelength differed among the three species (data not shown). To minimize the varibility ofRhν, we derived a solar spectrum-weighted mean AQY (8¯) using Eq. (5) (Zhang et al., 2006):
¯
8=
λ2 R
λ1
Qλ×8λ×dλ
600
R
290
Qλ×dλ
. (5)
Qλ is defined in Sect. 3.3. The wavelength range of inte-gration for the numerator is denoted by λ1 and λ2, being
290–500 nm for NH+4, and 290–600 nm for CO2 and CO
(B´elanger et al., 2006; Xie et al., 2009). This normalization reduced the AQY spectrum to a single value corresponding to the solar insolation-normalized production of a compound in the entire water column in which all solar radiation over 280– 600 nm was absorbed by CDOM. The calculated8¯ andRhν are shown in Table 4. Both the CO2: NH+4 and CO : NH
+ 4
ra-tios decreased from nearshore to offshore and increased ex-ponentially withacdom,412(Fig. 10) due to the opposing trend
between the AQYs of CO2 and CO and that of NH+4 with
respect toacdom.Rhν changed from 165 : 11 : 1 in the
estu-ary (Sta. 398, 694, 697) to 60 : 3 : 1 on the shelf (Sta. 391, 394, 691, 693) and 18:2:1 in the basin (Sta. 430, 640). This Rhν pattern suggests differing mechanims of and/or envi-ronmental control on CO2, CO, and NH+4 photoproduction.
Because the DOC : DON ratios for these stations fell into a relatively narrow range of 26 to 37 (Fig. 10), DOM pho-totransformation tended to enrich its nitrogen proportion in neashore waters but to diminish it in offshore waters. Fi-nally, as a reference to Sect. 3.3,8¯NH+
4 for Group 2 stations (5.2×10⁻⁷±0.4×10⁻⁷mol NH+4 (mol quanta)−1) differed from Group 1 stations (2.4×10⁻⁷±0.8×10⁻⁷mol NH+4 (mol quanta)−1) by the same factor (i.e. 2) as that based on 8NH+
Table 4.Comparision of8¯ among NH+
4, CO2and CO.8¯ is defined
in Eq. (5) in the text.Rhνis the molar ratio of CO2: CO : NH+4 and
equal to8¯CO
2:8¯CO:8¯NH+4. n.d. = not determined.
Location Station 8¯ ×107 Rhν
CO2 CO NH+4
Transect 390
391 270 9.1a 5.4 60 : 2 : 1 394 136 11 3.0 42 : 4 : 1 398 288 13b 2.9 88 : 4 : 1
Transect 690
691 207 9.1 5.0 46 : 2 : 1 693 187 13 2.9 56 : 4 : 1 694 222 20 2.3 99 : 9 : 1 697 253 22 1.1 230 : 19 : 1
Offshore 430 n.d. 17 5.3 3 : 1
c
640 83 8.9 5.3 18 : 2 : 1
aNo data are avaiable for CO at Sta. 391. Data shown are from Sta. 392, whose
salinity (27.90) andacdom,412(0.10 m−1) values are similar to those of Sta. 391
(27.82, 0.11 m−1).
bNo data are avaiable for CO
2and CO at Sta. 398. Data shown are from Sta. 396,
whose salinity (17.27) andacdom,412(1.04 m−1) values are similar to those of
Sta. 398 (16.37, 1.15 m−1).
cMolar ratio of CO : NH+ 4 only.
4 Conclusions
Photoammonification was detected in all samples collected from both nearshore and offshore warters of the SE Beaufort Sea. The rate of photoammonification was positively corre-lated to CDOM absorbance and DON concentration. On an absorbed-photon basis, photoammonification, however, was inversely related to CDOM absorbance, leading to8NH+
4 in-creasing seaward. The UVA (320–400 nm) component of the solar spectrum dominated photoammonification at the sea surface. The photochemical ratio of CO2: CO : NH+4 varied
from 165 : 11 : 1 in the estuary to 60 : 3 : 1 on the shelf and 18 : 2 : 1 in the basin, indicating a greater photoreactivity of terrestrial DOM with respect to CO2and CO than to NH+4.
Coupled optical-photochemical modeling yielded photoam-monification rates of 7.3 nmol l−1d−1 (Mackenzie Shelf) and 3.5 nmol l−1d−1(Canada Basin) at the sea surface and 9.2 µmol m−2d−1(Mackenzie Shelf) and 10.8 µmol m−2d−1 (Canada Basin) in the entire water column. The modeled off-shore NH+4 photoproduction in August (8.0 µmol m−2d−1) was comparable to the missing DIN source that supported primary production in the upper 10-m layer after nitrate depletion. Annual NH+4 photoproduction in the SE Beau-fort Sea in 2009 amounted to 1.4×10⁸ moles, of which 85 % was formed in the summer season when nitrate is usu-ally depleted. Photoammonification under a completely ice-free scenario, generating 2.1×10⁸moles of NH+4 per year, could mineralize 6 % of the annual DON transported from the Mackenzie River and provide a DIN source representing 11 % of the riverine DIN export and 2100 times the riverine
Fig. 10.Plots of photochemical molar ratios of CO2to NH+4 and
CO to NH+4 vs. CDOM absorption coefficient at 412 nm. Data were fitted to the equation ofY=20.4 exp(1.17X)for CO2: NH+4 (solid
line;r2=0.908,n=8) and Y=0.90 exp(1.53X)for CO : NH+4 (dashed line; r2=0.968, n=9). Superimposed is the plot of DON : DOC ratio vs. CDOM absorption coefficient.
NH+4 discharge. This light-initiated process thus plays a sig-nificant role in nitrogen cycling and biological production in the SE Beaufort Sea.
Future studies should resolve potential seasonality of 8NH+
4 and increase sampling resolutions, especially in off-shore waters. A quantitative assessment of the temperature dependence of photoammonification is particularly relevant to this climatically sensitive region. Rising surface water temperatures can directly increase the efficiency of photoam-monification (Sect. 3.3), which would support additional pri-mary production and perhaps lead to more riverine photoam-monificable DON being used closer to the shore.
Supplementary material related to this article is available online at: http://www.biogeosciences.net/9/ 3047/2012/bg-9-3047-2012-supplement.pdf.
Acknowledgements. R. M. Holmes helped with collecting the Mackenzie River water sample near Inuvik. Y. Zhang assisted in the preparation of Fig. 1. We thank the captain, crew, and colleagues of the CCGS Amundsen cruise for their cooperation. Reviewers’ suggestions improved the manuscript. This study was supported by grants from the Natural Sciences and Engineering Re-search Council (NSERC) to HX and SB and the National Science Foundation (NSF 0713915) to RB. It was conducted as part of the Malina Scientific Program funded by ANR (Agence nationale de la recherche), INSU-CNRS (Institut national des sciences de l’univers – Centre national de la recherche scientifique), CNES (Centre national d’´etudes spatiales) and ESA (European Space Agency).
References
Aarnos, H., Yl¨ostalo, P., and V¨ah¨atalo, A. V.: Seasonal photo-transformation of dissolved organic matter to ammonium, dis-solved inorganic carbon, and labile substrates supporting bac-terial biomass across the Baltic Sea, J. Geophys. Res., 117, G01004, doi:10.1029/2010JG001633, 2012.
Amon, R. M. W.: The role of dissolved organic matter for the or-ganic carbon cycle in the Arctic Ocean, in: The Oror-ganic Carbon Cycle in the Arctic Ocean, edited by: Stein, R. and MacDonald, R. W., Springer, New York, 83–99, 2004.
Babin, M., Stramski, D., Ferrari, G. M., Claustre, H., Bricaud, A., Obolensky, G., and Hoepffner, N.: Variations in the light absorp-tion coefficients of phytoplankton, nonalgal particles, and dis-solved organic matter in coastal waters around Europe, J. Geo-phys. Res., 108, 3211, doi:10.1029/2001JC000882, 2003. B´elanger, S.: Response of light-related carbon fluxes in the Arctic
Ocean to climate change: Quantification and monitoring of dis-solved organic matter photo-oxidation in the Beaufort Sea using satellite remote sensing, Ph.D. thesis, Universit´e Pierre et Marie Curie (UPMC – Paris XI), Paris, France, 2006.
B´elanger, S., Xie, H., Krotkov, N., Larouche, P., Vincent, W. F., and Babin, M.: Photomineralization of terrigenous dissolved or-ganic matter in Arctic coastal waters from 1979 to 2003: Interan-nual variability and implications of climate change, Global Bio-geochem. Cy., 20, GB4005, doi:10.1029/2006GB002708, 2006. B´elanger, S., Babin, M., and Larouche, P.: An empirical ocean color algorithm for estimating the contribution of chro-mophoric dissolved organic matter to total light absorption in optically complex waters, J. Geophys. Res. 113, C04027, doi:10.1029/2007JC004436, 2008.
Benner, R. and Kaiser, K.: Biological and photochemical transfor-mations of lignin phenols and amino acids in riverine dissolved organic matter, Biogeochemistry, 102, 209–222, 2011.
Bertilsson, S., Stepanauskas, R., Cuadros-Hansson, R., Gran´eli, W., Wikner, J., and Tranvik, L.: Photochemically induced changes in bioavailable carbon and nitrogen pools in a boreal watershed, Aquat. Microb. Ecol., 19, 47–56, 1999.
Buffam, I. and McGlathery, K. J.: Effect of ultraviolet light on dis-solved nitrogen transformations in coastal lagoon water, Limnol. Oceanogr., 48, 723–734, 2003.
Buiteveld, H., Hakvoort, J. M. H., and Donze, M.: The optical prop-erties of pure water, in: SPIE Proceedings on Ocean Optics XII, edited by: Jaffe, J. S., The Society of Photo-Optical Instrumenta-tion Engineers, Bellingham, Washington, USA, 174–183, 1994. Bushaw, K. L., Zepp, R. G., Tarr, M. A., Schultz-Jander, D.,
Bour-bonniere, R. A., Hodson, R. E., Miller, W. L., Bronk, D. A., and Moran, M. A.: Photochemical release of biologically avail-able nitrogen from aquatic dissolved organic matter, Nature, 381, 404–407, 1996.
Davis, J. and Benner, R.: Seasonal trends in the abundance, com-position and bioavailability of particulate and dissolved organic matter in the Chukchi/Beaufort Seas and western Canada Basin, Deep-Sea Res. Pt. II, 52, 3396–3410, 2005.
Dittmar, T. and Kattner, G.: The biogeochemistry of the river and shelf ecosystem of the Arctic Ocean: a review, Mar. Chem., 83, 105–120, 2003.
Emmerton, C. A., Lesack, L. F. W., and Vincent. W. F.: Macken-zie River nutrient delivery to the Arctic Ocean and effects of the Mackenzie Delta during open water conditions, Global
Bio-geochem. Cy., 22, GB1024, doi:10.1029/2006GB002856, 2008. Gao, H. and Zepp, R. G.: Factors influencing photoreactions of dissolved organic matter in a coastal river of the Southeastern United States, Environ. Sci. Technol., 32, 2940–2946, 1998. Gordon, H. R.: Can the Lambert-Beer law be applied to the diffuse
attenuation coefficient of ocean water, Limnol. Oceanogr., 34, 1389–1409, 1989.
Grasshoff, K., Kremling, K., and Ehrhardt, M.: Methods of Sea-water Analysis, Wiley-VCHVerlag GmbH, Weinheim, Germany, 1999.
Gueymard, C.: Parameterized transmittance model for direct beam and circumsolar spectral irradiance, Sol. Energy, 71, 325–346, 2001.
Helms, J. R., Stubbins, A., Ritchie, J. D., Minor,E. C., Kieber, D. J., and Mopper, K.: Absorption spectral slopes and slope ratios as indicators of molecular weight, source, and photobleaching of chromophoric dissolved organic matter, Limnol. Oceanogr., 53, 955–969, 2008.
Holmes, R. M., Aminot, A., Ke`ırouel, R., Hooker, B. A., and Pe-terson, B. J.: A simple and precise method for measuring ammo-nium in marine and freshwater ecosystems, Can. J. Fish. Aquat. Sci., 56, 1801–1808, 1999.
Holmes, R. M., McClelland, J. W., Peterson, B. J., Tank, S. E., Bu-lygina, E., Eglinton, T. I., Gordeev, V. V., Gurtovaya, T. Y., Ray-mond, P. A., Repeta, D. J., Staples, R., Striegl, R. G., Zhulidov, A. V., and Zimov, S. A.: Seasonal and annual fluxes of nutrients and organic matter from large rivers to the Arctic Ocean and sur-rounding seas, Estuar. Coast., 35, 369–382, doi:10.1007/s12237-011-9386-6, 2011.
Hu, C., Muller-Karger, F. E., and Zepp, R. G.: Absorbance, ab-sorption coefficient, and apparent quantum yield: A comment on common ambiguity in the use of these optical concepts, Limnol. Oceanogr., 47, 1261–1267, 2002.
IOCCG: Remote sensing of inherent optical properties: Fundamen-tals, tests of algorithms, and applications, in: Reports of the In-ternational Ocean-Colour Coordinating Group, No. 5, edited by: Lee, Z.-P., IOCCG, Dartmouth, Canada, 2006.
Johannessen, S. C. and Miller, W. L.: Quantum yield for the photo-chemical production of dissolved inorganic carbon in seawater, Mar. Chem., 76, 271–283, 2001.
Jørgensen, N. O. G., Tranvik, L., Edling, H., Graneli, W., and Lin-dell, M.: Effects of sunlight on occurrence and bacterial turnover of specific carbon and nitrogen compounds in lake water, FEMS Microbiol. Ecol., 25, 217–227, 1998.
Kieber, R. J., Hydro, L. H., and Seaton, P. J.: Photooxidation of triglycerides and fatty acids in seawater: Implication toward the formation of marine humic substances, Limnol. Oceanogr., 42, 1454–1462, 1997.
Kitidis, V., Uher, G., Upstill-Goddard, R. C., Mantoura, R. F. C., Spyres, G., and Woodward, E. M. S.: Photochemical produc-tion of ammonium in the oligotrophic Cyprus Gyre (Eastern Mediterranean), Biogeosciences, 3, 439–449, doi:10.5194/bg-3-439-2006, 2006.
Kitidis, V., Uher, G., Woodward, E. M. S., Owens, N. J. P., and Upstill-Goddard, R. C.: Photochemical production and consump-tion of ammonium in a temperate river–sea system, Mar. Chem., 112, 118–127, 2008.
organic nitrogen in waters of two estuaries and adjacent surficial groundwaters, Aquat. Microb. Ecol., 26, 295–304, 2002. Lee, Z.-P., Carder, K. L., and Arnone, R. A.: Deriving inherent
op-tical properties from water color : a multiband quasi-analyop-tical algorithm for optically deep waters, Appl. Opt., 41, 5755–5772, 2002.
Matsuoka, A., Bricaud, A., Benner, R., Para, J., Semp´er´e, R., Prieur, L., B´elanger, S., and Babin, M.: Tracing the transport of colored dissolved organic matter in water masses of the Southern Beau-fort Sea: relationship with hydrographic characteristics, Biogeo-sciences, 9, 925–940, doi:10.5194/bg-9-925-2012, 2012. Mayer, L. M., Schick, L. L., Hardy, K. R, and Estapa, M. L.:
Pho-todissolution and other photochemical changes upon irradiation of algal detritus, Limnol. Oceanogr., 54, 1688–1698, 2009. McClelland, J. W., Holmes, R. M., Peterson, B. J., Amon, R. M. W.,
Brabets, T., Cooper, L., Gibson, J., Gordeev, V. V., Guay, C., Mil-burn, D., Staples, R., Raymond, P. A., Shiklomanov, I., Striegl, R., Zhulidov, A., Gurtovaya, T., and Zimov, S.:, Development of a Pan-Arctic database for river chemistry, Eos Trans. AGU, 89, 217, doi:10.1029/2008EO240001, 2008.
Mopper, K. and Kieber, J. K.: Photochemistry and the cycling of carbon, sulfur, nitrogen and phosphorus, in: Biogeochemistry of Marine Dissolved Organic Matter, edited by: Hansell, D. A. and Carlson, C. A., Academic Press, 455–489, 2002.
Ortega-Retuerta, E., Jeffrey, W. H., Ghiglione, J. F., and Joux, F.: Evidence of heterotrophic prokaryotic activity limitation by ni-trogen in the Western Arctic Ocean during summer, Polar Biol., 35, 785–794, 2012.
Osburn, C. L., Retamal, L., and Vincent, W. F.: Photoreactivity of chromophoric dissolved organic matter transported by the Mackenzie River to the Beaufort Sea, Mar. Chem., 115, 10–20, 2009.
Pope, R. M. and Fry, E. S.: Absorption spectrum (380–700 nm) of pure water, II: Integrating cavity measurements, Appl. Optics, 36, 8710–8723, 1997.
Ricchiazzi, P., Yang, S., Gautier, C., and Sowle, D.: SBDART: A research and teaching software tool for plane-parallel radiative transfer in the earth’s atmosphere, B. Am. Meteorol. Soc., 79, 2101–2114, 1998.
Simpson, K. G., Tremblay, J.- ´E., Gratton, Y., and Price, N. M.: An annual study of inorganic and organic nitrogen and phosphorus and silicic acid in the southeastern Beaufort Sea, J. Geophys. Res., 113, C07016, doi:10.1029/2007JC004462, 2008.
Smith, E. M. and Benner, R.: Photochemical transformations of riverine dissolved organic matter: effects on estuarinebacterial metabolism and nutrient demand, Aquat. Microb. Ecol., 40, 37– 50, 2005.
Stedmon, C. A., Markager, S., Tranvik, L., Kronberg, L., Sl¨atis, T., and Martinsen, W.: Photochemical production of ammonium and transformation of dissolved organic matter in the Baltic Sea, Mar. Chem., 104, 227–240, 2007.
Stubbins, A., Uher, G., Law, C. S., Mopper, K., Robinson, C., and Upstill-Goddard, R. C.: Open-ocean carbon monoxide photopro-duction, Deep-Sea Res. Pt. II, 53, 1695–1705, 2006.
Stubbins, A., Law, C. S., Uher, G., and Upstill-Goddard, R. C.: Car-bon monoxide apparent quantum yields and photoproduction in
the Tyne estuary, Biogeosciences, 8, 703–713, doi:10.5194/bg-8-703-2011, 2011.
Tank, S. E., Manizza, M., Holmes, R. M., McClelland, J. W., and Peterson, B. J.: The Processing and impact of dissolved river-ine nitrogen in the Arctic Ocean, Estuar. Coast., 35, 401–415, doi:10.1007/s12237-011-9417-3, 2011.
Tarr, M. A., Wang, W., Bianchi, T. S., and Engelhaupt, E.: Mecha-nisms of ammonia and amino acid photoproduction from aquatic humic and colloidal matter, Water Res., 35, 3688–3696, 2001. Tremblay, J.- ´E., Simpson, K., Martin, J., Miller, L., Gratton, Y.,
Barber, D., and Price, N. M.: Vertical stability and the an-nual dynamics of nutrients and chlorophyll fluorescence in the coastal, southeast Beaufort Sea, J. Geophys. Res., 113, C07S90, doi:10.1029/2007JC004547, 2008.
V¨ah¨atalo, A. V. and Zepp, R. G.: Photochemcial mineralisation of dissolved organic nitrogen to ammonium in the Baltic Sea, Env-iron. Sci. Technol., 39, 6985–6992, 2005.
V¨ah¨atalo, A. V., Salonen, K., M¨unster, U., J¨avinen, M., and Wetzel, R. G.: Photochemical transformation of allochthonous organic matter provides bioavailable nutrients in a humic lake, Arch. Hy-drobiol., 156, 287–314, 2003.
Wang, W., Tarr, M. A., Bianchi, T. S., and Engelhaupt, E.: Ammo-nium Photoproduction from Aquatic Humic and Colloidal Mat-ter, Aquatic Geochemistry, 6, 275–292, 2000.
White, E. M., Kieber, D. J., Sherrard, J., Miller, W. L., and Mop-per, K.: Carbon dioxide and carbon monoxide photoproduction quantum yields in the Delaware Estuary, Mar. Chem., 118, 11– 21, 2010.
Wiegner, T. N. and Seitzinger, S. P.: Photochemical and microbial degradation of external dissolved organic matter inputs to rivers, Aquat. Microb. Ecol., 24, 27–40, 2001.
Xie, H. and Zafiriou, O. C.: Evidence for signi?cant photochemi-cal production of carbon monoxide by particles in coastal and oligotrophic marine waters, Geophys. Res. Lett., 36, L23606, doi:10.1029/2009GL041158, 2009.
Xie, H., B´elanger, S., Demers, S., Vincent, W. F., and Papakyri-akou, T. N.: Photobiogeochemical cycling of carbon monoxide in the southeastern Beaufort Sea in spring and autumn, Limnol. Oceanogr., 54, 234–249, 2009.
Zafiriou, O. C., Andrews, S. S., and Wang, W.: Concordant esti-mates of oceanic carbon monoxide source and sink processes in the Pacific yield a balanced global “blue-water” CO budget, Global Biogeochem. Cy., 17, 1015–1027, 2003.
Zhang, Y., Rossow, W. B., Lacis, A. A., Oinas, V., and Mishchenko, M. I.: Calculation of radiative fluxes from the surface to top of atmosphere based on ISCCP and other global data sets: Refine-ments of the radiative transfer model and the input data, J. Geo-phys. Res., 109, D19105, doi:10.1029/2003JD004457, 2004. Zhang, Y., Xie, H., and Chen, G.: Factors affecting carbon
monoxide photoproduction in the St. Lawrence estuarine system (Canada), Environ. Sci. Technol., 40, 771–777, 2006.