Transmitted Antiretroviral Drug Resistance in New York
State, 2006-2008: Results from a New Surveillance
System
Adam C. Readhead1., Daniel E. Gordon2., Zhengyan Wang2
, Bridget J. Anderson2,
Kathleen S. Brousseau2, Maria A. Kouznetsova2, Lisa A. Forgione1, Lou C. Smith2, Lucia V. Torian1* 1The New York City Department of Health and Mental Hygiene, HIV Epidemiology and Field Services Program, New York, New York, United States of America,2The New York State Department of Health, Bureau of HIV/AIDS Epidemiology, Albany, New York, United States of America
Abstract
Background:HIV transmitted drug resistance (TDR) is a public health concern because it has the potential to compromise antiretroviral therapy (ART) at the population level. In New York State, high prevalence of TDR in a local cohort and a multiclass resistant case cluster led to the development and implementation of a statewide resistance surveillance system.
Methodology:We conducted a cross-sectional analysis of the 13,109 cases of HIV infection that were newly diagnosed and reported in New York State between 2006 and 2008, including 4,155 with HIV genotypes drawn within 3 months of initial diagnosis and electronically reported to the new resistance surveillance system. We assessed compliance with DHHS recommendations for genotypic resistance testing and estimated TDR among new HIV diagnoses.
Principal Findings:Of 13,109 new HIV diagnoses, 9,785 (75%) had laboratory evidence of utilization of HIV-related medical care, and 4,155 (43%) had a genotype performed within 3 months of initial diagnosis. Of these, 11.2% (95% confidence interval [CI], 10.2%–12.1%) had any evidence of TDR. The proportion with mutations associated with any antiretroviral agent in the NNRTI, NRTI or PI class was 6.3% (5.5%–7.0%), 4.3% (3.6%–4.9%) and 2.9% (2.4%–3.4%), respectively. Multiclass resistance was observed in,1%. TDR did not increase significantly over time (p for trend = 0.204). Men who have sex with men were not more likely to have TDR than persons with heterosexual risk factor (OR 1.0 (0.77–1.30)). TDR to EFV+TDF+FTC
and LPV/r+TDF+FTC regimens was 7.1% (6.3%–7.9%) and 1.4% (1.0%–1.8%), respectively.
Conclusions/Significance:TDR appears to be evenly distributed and stable among new HIV diagnoses in New York State; multiclass TDR is rare. Less than half of new diagnoses initiating care received a genotype per DHHS guidelines.
Citation:Readhead AC, Gordon DE, Wang Z, Anderson BJ, Brousseau KS, et al. (2012) Transmitted Antiretroviral Drug Resistance in New York State, 2006-2008: Results from a New Surveillance System. PLoS ONE 7(8): e40533. doi:10.1371/journal.pone.0040533
Editor:Genevie`ve Cheˆne, Institut National de la Sante´ et de la Recherche Me´dicale, France ReceivedOctober 28, 2011;AcceptedJune 12, 2012;PublishedAugust 6, 2012
Copyright:ß2012 Readhead et al. This is an open-access article distributed under the terms of the Creative Commons Attribution License, which permits unrestricted use, distribution, and reproduction in any medium, provided the original author and source are credited.
Funding:The analysis was supported in part by a cooperative agreement with the Centers for Disease Control and Prevention, PS08-80202,#UC62/CCU223595, and in part by New York City and New York state government funding for HIV/AIDS surveillance. The funders had no role in study design, data collection and analysis, decision to publish, or preparation of the manuscript.
Competing Interests:The authors have declared that no competing interests exist. * E-mail: ltorian@health.nyc.gov
.These authors contributed equally to this work.
Introduction
The widespread use of anti-retroviral therapy (ART) and the extended survival of HIV-infected individuals have produced a growing population of ART-experienced persons who may develop antiretroviral (ARV) drug resistance. Individuals with ARV resistance have reduced responsiveness to ART, delayed or incomplete viral suppression and poor outcomes [1,2]. Moreover, they may transmit resistant infection to others. Transmitted drug resistance (TDR) is a public health concern because it has the potential to compromise ART at the population level. In New York State, a report of increasing TDR in a local cohort [3] and a case cluster involving transmission of a multi-class resistant virus [4–6] suggested the need to monitor TDR statewide. In 2005, building on existing HIV surveillance, which already included routine reporting of viral loads, CD4 counts and positive Western
blots, [7–10] New York State introduced mandatory electronic reporting of viral nucleotide sequences for the purpose of conducting resistance surveillance [11,12]. We report results of the first three years of data from the New York State resistance surveillance system, the first of its kind in the U.S.
Methods
Data Sources
The HIV/AIDS surveillance systems of the New York State Department of Health (NYSDOH) and the New York City Department of Health and Mental Hygiene (NYC DOHMH) have been described previously [13–15]. Nucleotide sequences from HIV genotypes, along with other HIV-related tests and conditions, are reportable by law [7–12]. Laboratory and provider
reports are transmitted to NYSDOH where they are matched to the New York State HIV registry; data relating to cases within New York City are forwarded to NYC DOHMH where they are matched to the NYC HIV registry. Incoming data at the state or city level that do not match an existing registry record initiate a field investigation to confirm the case, date and disposition of diagnosis and collect other data required by surveillance. An analysis dataset was created based on diagnoses and laboratory results dated January 1, 2006, through December 31, 2008, reported by April 30, 2010, and added to the NYS HIV registry as of May 31, 2010. A total of 14,046 persons aged 13 and older and not perinatally infected had an initial diagnosis date between January 1, 2006, and December 31, 2008; 937 (6.7%) were excluded because of missing or discrepant data on date of initial diagnosis or genotype, leaving 13,109 for analysis.
Data definitions
Diagnosis refers to a new diagnosis of HIV with or without a concurrent diagnosis of AIDS. Concurrent diagnosis was defined as AIDS diagnosis within 31 days of initial diagnosis of HIV. Region at diagnosis was categorized as New York City or New York State excluding New York City. Poverty area was defined as residence at diagnosis in a ZIP code tabulation area in which at least 20% of residents per US Census 2000 met the federal definition of poverty. Poverty area was not calculated for homeless or sheltered persons or for persons residing in zip codes created after 2000. Cases with missing risk factor were assigned to the category, ‘‘no identified risk.’’ Initial resistance test was defined as the first HIV genotype (if any) within 3 months of diagnosis. The 3 month interval was chosen to limit the number of persons that may have started ART before resistance testing and to allow comparison with results from the Centers for Disease Control’s (CDC) Variant, Atypical, and Resistant HIV Surveillance (VARHS) system [16–17]. In addition to nucleotide sequences, laboratory data included the first CD4 count and viral load drawn within 3 months of diagnosis. Persons with a viral load, CD4 count or resistance test within 3 months of diagnosis were considered in care because these tests must be ordered by a physician [14]. CD4 counts were dichotomized as .350 cells/ml or ,350 cells/ml because Department of Health and Human Services (DHHS) guidelines in place during the reporting period recommended initiation of ART at this threshold [18]. Viral loads were grouped into three intervals,,10,000 copies/ml, 10,000–100,000 copies/ ml, and.100,000 copies/ml.
Resistance Analysis
HIV genotype testing was performed by commercial laborato-ries using various test kits, including ViroseqTM, GenoSureTM, TRUGENETM and in-house kits. Only protease and reverse transcriptase sequences of thepolgene were reported. Nucleotide sequences were analyzed using the Resistance Analysis System (RAS), version 2.0 (Frontier Science & Technology Research Foundation, Amherst, New York), a program built specifically to facilitate NYS resistance surveillance. Mutations were ascertained by a comparison of aligned sequences with the Los Alamos National Laboratory subtype B consensus sequence [19]. ARV-specific predicted resistance was calculated using code developed by Frontier Science and scores from the Stanford HIVDB algorithm, version 6.0.9; [20,21] this algorithm was also used to determine HIV-1 subtype. Sequences that did not meet the minimum processing requirement of the HIVDB algorithm could not be analyzed [20].
Transmitted drug resistance was defined as the presence of 1 or more mutations in the surveillance drug resistance mutation list
(SDRM) [22]. ARVs were categorized by class. Single, double or triple class resistance was defined as 1 or more surveillance drug mutation within one, two or three antiretroviral drug classes respectively. Predicted resistance to specific antiretroviral drugs was defined as sequences with a score of $4 on the Stanford HIVDB 5-point resistance scale [20].
Statistical Analysis
Multivariate logistic regression was used to assess the likelihood of an initial resistance test and the likelihood of TDR as a function of demographic and clinical characteristics. Unadjusted and adjusted odd ratios with 95% confidence intervals (CIs) were calculated. Concurrent diagnosis of HIV/AIDS was excluded from the regression analysis of testing patterns because it is partially defined by CD4 count. Variables significant (p,0.05) on bivariate analysis were entered into multivariate logistic regression models for the two outcome variables, testing and TDR. Confidence limits for proportions were calculated using exact CIs for the binomial proportion. Trends were examined using the Cochran-Armitage test and are reported with two-sided p-values. All statistical tests were performed using SAS, version 9.1.3 (SAS Institute, Cary, North Carolina).
Results
Population Demographics and Resistance Testing Patterns
Of the 13,109 persons included in the analysis, 4,155 (31.7%) received their first resistance test within 3 months of diagnosis (‘‘initial resistance test’’); 1,311 (10.0%) were first genotyped.3– 12 months after diagnosis, 7,643 (13.3%) were first genotyped .12 months after diagnosis, and 44.9% were never genotyped. Of all persons ever genotyped, three-quarters were genotyped within three months of initial diagnosis. Patients never genotyped differed significantly from patients ever genotyped by age, race, risk factor, and disease stage at diagnosis (data not shown). Patients with CD4,350, VL.100,000 and concurrent HIV/AIDS at diagno-sis, i.e., patients meeting DHHS guidelines for ART, were more likely to have ever been genotyped.
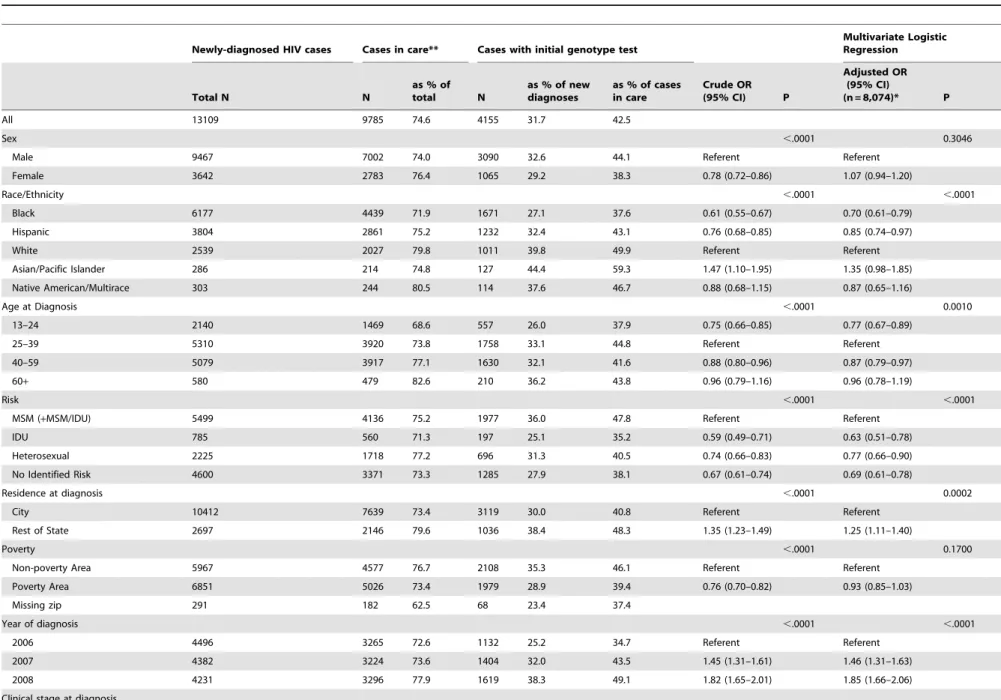
Initial resistance testing among newly diagnosed persons differed significantly by sex, race/ethnicity, age, risk factor, region of diagnosis, poverty area, year of diagnosis, and disease stage at diagnosis (Table 1). Among persons with new diagnoses, 9,785 (74.6%) showed evidence of care (i.e., saw a physician) within 3 months of diagnosis. Of persons in care, 4,155 (43%) had initial resistance tests. Among all newly diagnosed, the proportion with an initial resistance test increased from 25% in 2006 to 38% in 2008 (p for trend,0.0001). Subsequent analyses were conducted among persons in care within three months (N = 9,785 or 74.6% of the total number of newly diagnosed) because these would be the only persons in the database who would have had the opportunity for initial resistance testing.
In the multivariate analysis of initial resistance testing among newly diagnosed persons in care, blacks and Hispanics were less likely to be tested than whites (AOR 0.70 (0.61–0.79), AOR 0.85 (0.74–0.97)) (Table 1). Persons aged 13–24 or 40–59 at diagnosis were slightly less likely to be tested than those 25–39 (AOR 0.77 (0.67–0.89); AOR 0.87 (0.79–0.97)), while persons 60 and older were no more likely to be tested (AOR 0.96 (0.79–1.19)). Compared with men who have sex with men (including men who have sex with men and use injection drugs (MSM+MSM/ IDU)), persons with heterosexual transmission risk were less likely to be tested (AOR 0.77 (0.66–0.90)).
Transmitted Antiretroviral Drug Resistance
Table 1.Frequency of ARV drug resistance testing within 3 months of HIV diagnosis, New York State 2006–2008{.
Newly-diagnosed HIV cases Cases in care** Cases with initial genotype test
Multivariate Logistic Regression
Total N N
as % of total N
as % of new diagnoses
as % of cases in care
Crude OR (95% CI) P
Adjusted OR (95% CI)
(n = 8,074)* P
All 13109 9785 74.6 4155 31.7 42.5
Sex ,.0001 0.3046
Male 9467 7002 74.0 3090 32.6 44.1 Referent Referent
Female 3642 2783 76.4 1065 29.2 38.3 0.78 (0.72–0.86) 1.07 (0.94–1.20)
Race/Ethnicity ,.0001 ,.0001
Black 6177 4439 71.9 1671 27.1 37.6 0.61 (0.55–0.67) 0.70 (0.61–0.79)
Hispanic 3804 2861 75.2 1232 32.4 43.1 0.76 (0.68–0.85) 0.85 (0.74–0.97)
White 2539 2027 79.8 1011 39.8 49.9 Referent Referent
Asian/Pacific Islander 286 214 74.8 127 44.4 59.3 1.47 (1.10–1.95) 1.35 (0.98–1.85)
Native American/Multirace 303 244 80.5 114 37.6 46.7 0.88 (0.68–1.15) 0.87 (0.65–1.16)
Age at Diagnosis ,.0001 0.0010
13–24 2140 1469 68.6 557 26.0 37.9 0.75 (0.66–0.85) 0.77 (0.67–0.89)
25–39 5310 3920 73.8 1758 33.1 44.8 Referent Referent
40–59 5079 3917 77.1 1630 32.1 41.6 0.88 (0.80–0.96) 0.87 (0.79–0.97)
60+ 580 479 82.6 210 36.2 43.8 0.96 (0.79–1.16) 0.96 (0.78–1.19)
Risk ,.0001 ,.0001
MSM (+MSM/IDU) 5499 4136 75.2 1977 36.0 47.8 Referent Referent
IDU 785 560 71.3 197 25.1 35.2 0.59 (0.49–0.71) 0.63 (0.51–0.78)
Heterosexual 2225 1718 77.2 696 31.3 40.5 0.74 (0.66–0.83) 0.77 (0.66–0.90)
No Identified Risk 4600 3371 73.3 1285 27.9 38.1 0.67 (0.61–0.74) 0.69 (0.61–0.78)
Residence at diagnosis ,.0001 0.0002
City 10412 7639 73.4 3119 30.0 40.8 Referent Referent
Rest of State 2697 2146 79.6 1036 38.4 48.3 1.35 (1.23–1.49) 1.25 (1.11–1.40)
Poverty ,.0001 0.1700
Non-poverty Area 5967 4577 76.7 2108 35.3 46.1 Referent Referent
Poverty Area 6851 5026 73.4 1979 28.9 39.4 0.76 (0.70–0.82) 0.93 (0.85–1.03)
Missing zip 291 182 62.5 68 23.4 37.4
Year of diagnosis ,.0001 ,.0001
2006 4496 3265 72.6 1132 25.2 34.7 Referent Referent
2007 4382 3224 73.6 1404 32.0 43.5 1.45 (1.31–1.61) 1.46 (1.31–1.63)
2008 4231 3296 77.9 1619 38.3 49.1 1.82 (1.65–2.01) 1.85 (1.66–2.06)
Clinical stage at diagnosis
Transmitted
Antiretr
oviral
Drug
Resistance
PLoS
ONE
|
www.plos
one.org
3
August
2012
|
Volume
7
|
Issue
8
|
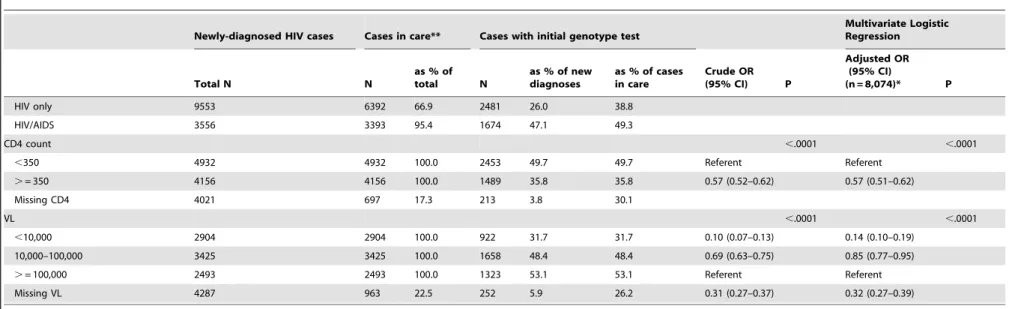
Table 1.Cont.
Newly-diagnosed HIV cases Cases in care** Cases with initial genotype test
Multivariate Logistic Regression
Total N N
as % of total N
as % of new diagnoses
as % of cases in care
Crude OR (95% CI) P
Adjusted OR (95% CI)
(n = 8,074)* P
HIV only 9553 6392 66.9 2481 26.0 38.8
HIV/AIDS 3556 3393 95.4 1674 47.1 49.3
CD4 count ,.0001 ,.0001
,350 4932 4932 100.0 2453 49.7 49.7 Referent Referent
.= 350 4156 4156 100.0 1489 35.8 35.8 0.57 (0.52–0.62) 0.57 (0.51–0.62)
Missing CD4 4021 697 17.3 213 3.8 30.1
VL ,.0001 ,.0001
,10,000 2904 2904 100.0 922 31.7 31.7 0.10 (0.07–0.13) 0.14 (0.10–0.19)
10,000–100,000 3425 3425 100.0 1658 48.4 48.4 0.69 (0.63–0.75) 0.85 (0.77–0.95)
.= 100,000 2493 2493 100.0 1323 53.1 53.1 Referent Referent
Missing VL 4287 963 22.5 252 5.9 26.2 0.31 (0.27–0.37) 0.32 (0.27–0.39)
{Excludes persons aged 12 years or younger and persons perinatally infected.
*Multivariate logistic regression excludes cases with missing data except for missing VL and missing risk which is categorized as ‘‘No identifiable risk’’. **Represents total after removal of 3324 cases missing CD4, VL and/or genotype within three months of diagnosis.
doi:10.1371/journal.pone.0040533.t001
Transmitted
Antiretr
oviral
Drug
Resistance
PLoS
ONE
|
www.plos
one.org
4
August
2012
|
Volume
7
|
Issue
8
|
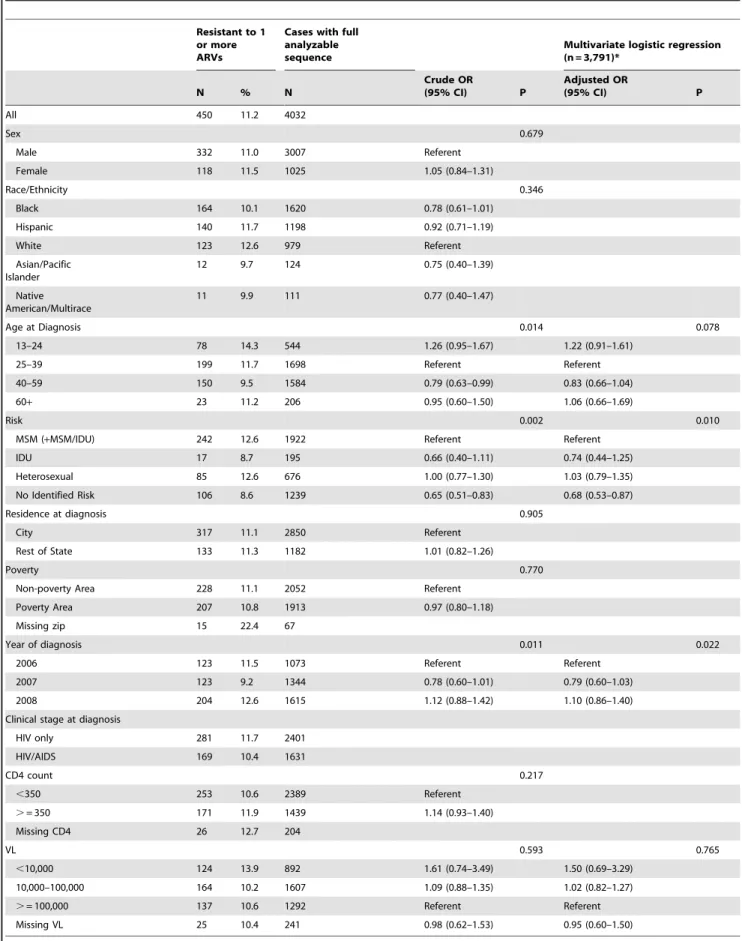
Table 2.Frequency of TDR genotypes by demographic characteristics, New York State 2006–2008.
Resistant to 1 or more ARVs
Cases with full analyzable sequence
Multivariate logistic regression (n = 3,791)*
N % N
Crude OR
(95% CI) P
Adjusted OR
(95% CI) P
All 450 11.2 4032
Sex 0.679
Male 332 11.0 3007 Referent
Female 118 11.5 1025 1.05 (0.84–1.31)
Race/Ethnicity 0.346
Black 164 10.1 1620 0.78 (0.61–1.01)
Hispanic 140 11.7 1198 0.92 (0.71–1.19)
White 123 12.6 979 Referent
Asian/Pacific Islander
12 9.7 124 0.75 (0.40–1.39)
Native American/Multirace
11 9.9 111 0.77 (0.40–1.47)
Age at Diagnosis 0.014 0.078
13–24 78 14.3 544 1.26 (0.95–1.67) 1.22 (0.91–1.61)
25–39 199 11.7 1698 Referent Referent
40–59 150 9.5 1584 0.79 (0.63–0.99) 0.83 (0.66–1.04)
60+ 23 11.2 206 0.95 (0.60–1.50) 1.06 (0.66–1.69)
Risk 0.002 0.010
MSM (+MSM/IDU) 242 12.6 1922 Referent Referent
IDU 17 8.7 195 0.66 (0.40–1.11) 0.74 (0.44–1.25)
Heterosexual 85 12.6 676 1.00 (0.77–1.30) 1.03 (0.79–1.35)
No Identified Risk 106 8.6 1239 0.65 (0.51–0.83) 0.68 (0.53–0.87)
Residence at diagnosis 0.905
City 317 11.1 2850 Referent
Rest of State 133 11.3 1182 1.01 (0.82–1.26)
Poverty 0.770
Non-poverty Area 228 11.1 2052 Referent
Poverty Area 207 10.8 1913 0.97 (0.80–1.18)
Missing zip 15 22.4 67
Year of diagnosis 0.011 0.022
2006 123 11.5 1073 Referent Referent
2007 123 9.2 1344 0.78 (0.60–1.01) 0.79 (0.60–1.03)
2008 204 12.6 1615 1.12 (0.88–1.42) 1.10 (0.86–1.40)
Clinical stage at diagnosis
HIV only 281 11.7 2401
HIV/AIDS 169 10.4 1631
CD4 count 0.217
,350 253 10.6 2389 Referent
.= 350 171 11.9 1439 1.14 (0.93–1.40)
Missing CD4 26 12.7 204
VL 0.593 0.765
,10,000 124 13.9 892 1.61 (0.74–3.49) 1.50 (0.69–3.29)
10,000–100,000 164 10.2 1607 1.09 (0.88–1.35) 1.02 (0.82–1.27)
.= 100,000 137 10.6 1292 Referent Referent
Missing VL 25 10.4 241 0.98 (0.62–1.53) 0.95 (0.60–1.50)
*Multivariate logistic regression excludes cases with missing data except for missing risk which is categorized at ‘‘No identifiable risk’’. doi:10.1371/journal.pone.0040533.t002
Transmitted Antiretroviral Drug Resistance
Persons diagnosed in New York State excluding New York City were more likely to have a resistance test than persons diagnosed in New York City (AOR 1.25 (1.11–1.40)), as were persons diagnosed in 2008 in comparison to those diagnosed in 2006 (AOR 1.85 (1.66–2.06)). Persons living in a non-poverty area were not significantly more likely to have a resistance test than those living in a poverty area (AOR 0.93 (0.85–1.03)). Persons with initial CD4 count $350 cells/ml were less likely to have a resistance test than persons with CD4 count,350 cells/ml (AOR 0.57 (0.51–0.62)), and persons with viral loads of,10,000 copies/ mL or 10,000–100,000 copies/mL were less likely to have a resistance test than persons with.100,000 copies/mL (AOR 0.14 (0.10–0.19), AOR 0.85 (0.77–0.95)).
Resistance patterns
Of the 4,155 initial resistance tests, 123 were reported with partial nucleotide sequences, and 4,032 (97.0%) had analyzable sequences. Among these, 450 (11.2% (10.2%–12.1%)) had evidence of TDR (Table 2). TDR did not significantly increase over time (p for trend = 0.204). In the multivariate analysis, risk, year of diagnosis and viral load remained significantly associated with TDR., However persons with a heterosexual risk factor were no more likely to have resistance than MSM (AOR 1.03 (0.79– 1.35)). In addition, black and Hispanic MSM were no more likely to have TDR in comparison with other race and risk groups (OR 1.10 (0.82–1.49) data not shown). Persons with no identified risk (NIR) were significantly less likely to have TDR than MSM (AOR 0.68 (0.53–0.87)).
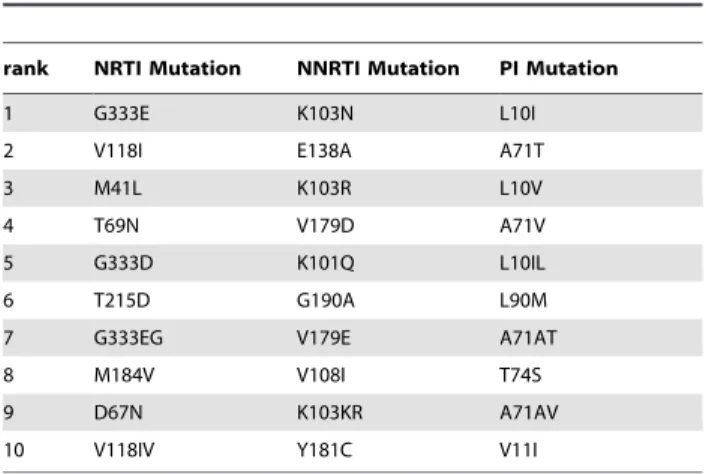
TDR varied by drug class. Resistance was highest to NNRTIs (6.3% (5.5%–7.0%)) and was significantly higher than resistance to NRTIs (4.3% (3.6%–4.9%)) and PIs (2.9% (2.4%–3.4%)) (Table 3). Over time, there was no significant increase in resistance in the NNRTI, NRTI or PI classes (p = 0.144, p = 0.686, p = 0.851, respectively). Resistance in two classes was highest in the NRTI-NNRTI (0.8%) combination; resistance in three classes was minimal (,0.5%). The most frequently observed polymorphisms by drug class are shown in Table 4.
We also examined predicted resistance to 1 or more compo-nents of selected starting regimens recommended by DHHS [18]. Resistance to 1 or more ARVs within the NNRTI-inclusive regimen EFV+TDF+FTC was observed in 7.1% (6.3%–7.9%) of
cases (data not shown). In contrast, 1.4% (1.0%–1.8%) were resistant to 1 or more drugs in the PI-inclusive regimen LPV/ r+TDF+FTC. Among individual NRTIs, resistance was highest to AZT and D4T (1.8% (1.4%–2.2%) and 1.6% (1.2%–2.0%)) and lower to TDF (0.3% (0.1%–0.5%) and FTC (0.9% (0.6%–1.2%), the two agents with recently demonstrated efficacy in pre-exposure prophylaxis [23]. 3TC, which in the treatment setting can be used interchangeably with FTC, showed similarly low resistance (0.9% (0.6%–1.2%)).
Most analyzed sequences (92.8%) were subtype B; 118 (2.9%) were CRF02_AG; and 83 (2.1%) were subtype C. Persons residing in NYC at diagnosis were no more likely to have non-B subtypes than persons residing in New York State excluding New York City (7.7% vs. 6.0%, p = 0.0611).
Discussion
Resistance Testing Patterns
Within the U. S., this analysis represents the first use of routinely reported surveillance data to estimate TDR and to describe resistance testing patterns as well as the largest number of sequences used for resistance surveillance to date [16,24]. More than half of newly diagnosed persons who entered care within three months did not receive an initial resistance test per DHHS guidelines, although the proportion receiving initial resistance tests increased between 2006 and 2008. The observed increase is consistent with the adoption of the 2007 DHHS guidelines recommending resistance testing for all newly diagnosed persons [18,25]. Previous guidelines recommended resistance testing for acute infection and patients initiating or failing ART [23]. Significant differences in resistance testing by demographic characteristics, including race, age and transmission risk, are concordant with literature on initiation, source, and utilization of care [26–28]. Potential candidates for initiation of ART per DHHS guidelines (CD4,350) were more likely to be tested than others, likely reflecting the decision by some providers to postpone resistance testing until initiation of ART. Similarly, persons with low viral loads (,10,000) were less likely to be tested. While this could be evidence of the impact of viral load on a provider’s decision to genotype, it may also be affected by the failure of amplification and genotyping at low viral loads (failed genotypes are not reported). Resistance testing was less common among NYC residents than residents in the rest of the state, an unexpected finding given the concentration of training hospitals and designated AIDS centers in the city. Further analysis is needed
Table 3.Transmitted Drug Resistance by drug class. New York State 2006–2008.
Total
N % 95% CI
Genotypes Analyzed 4032
-Any 450 11.2% 10.2% 12.1%
NRTI 172 4.3% 3.6% 4.9%
NNRTI 252 6.3% 5.5% 7.0%
PI 116 2.9% 2.4% 3.4%
Two Class
NRTI-NNRTI 33 0.8% 0.5% 1.1%
NRTI-PI 15 0.4% 0.2% 0.6%
NNRTI-PI 16 0.4% 0.2% 0.6%
Three Class
NRTI-NNRTI-PI 13 0.3% 0.1% 0.5%
doi:10.1371/journal.pone.0040533.t003
Table 4.Top 10 mutations by drug class.
rank NRTI Mutation NNRTI Mutation PI Mutation
1 G333E K103N L10I
2 V118I E138A A71T
3 M41L K103R L10V
4 T69N V179D A71V
5 G333D K101Q L10IL
6 T215D G190A L90M
7 G333EG V179E A71AT
8 M184V V108I T74S
9 D67N K103KR A71AV
10 V118IV Y181C V11I
doi:10.1371/journal.pone.0040533.t004
Transmitted Antiretroviral Drug Resistance
to elucidate the relationship between resistance testing, provider type, and utilization of care.
Transmitted Drug Resistance
The prevalence of TDR among persons with new diagnoses in NYS in 2006–2008 was 11.2% (10.2%–12.1%). There was no significant change in TDR over time. Worldwide estimates of TDR range from 8%–24%, though comparison between these results is difficult due to differences in the mutations used to define TDR [29–38]. Our estimate, based on the SDRM list [22], is higher than the national prevalence estimate (8.3%) for the time period 1997–2001 [39] but is substantially lower than a previous report of resistance in a NYC sample of MSM in 2003–2004 (24.1%) [3]. Both of these studies used modified IAS-USA mutation lists. Wheeler et al. estimated the national prevalence of transmitted drug resistant mutations (TDRM) in 2006 to be 14.6% using a modified SDRM list [16]. We estimated the New York State TDR to be 24.2% using the same mutation list (results not shown). Further analysis is needed to test the utility of the SDRM and TDRM lists in the U.S. epidemic.
In contrast to previous findings of increasing TDR and high levels of TDR among MSM, we found stable resistance evenly distributed between MSM and heterosexual risk groups [3,40]. Better risk factor ascertainment would allow us to measure the TDR by risk factor more accurately and/or to understand the unexpected findings of this analysis. Our data show that 1 in 9 persons newly diagnosed with HIV in NYS has TDR and 1 in 50 is predicted to have a suboptimal response to a standard ART regimen. Key populations considered to be on the leading edge of the epidemic, e.g., young black and Hispanic MSM, showed no more TDR than others. Ongoing surveillance will confirm the significance and durability of these observations.
Limitations
Our analysis has important limitations. HIV surveillance data contain limited person-level information; duration of infection and ART history are not available. Newly-diagnosed persons are assumed to be ARV-naı¨ve but may not be. Despite the CDC-sponsored routine interstate duplication review (RIDR) and comprehensive field investigation, persons may be incorrectly identified as newly diagnosed because there is incomplete date information or because they were diagnosed out of state and subsequently received HIV care in New York State. In such cases acquired resistance may be incorrectly classified as TDR. The number of resistance tests reported is an underestimate of the number ordered by providers because resistance tests in which viral RNA amplification fails are not reportable.
Integrating resistance data into the existing surveillance system was logistically and technically challenging. Laboratories certified by NYSDOH to perform resistance testing were required to report nucleotide sequences beginning on June 1, 2005. However, laboratories acquired full capacity to report resistance data at different times after the regulations were enacted, which meant that much of the data was reported retrospectively. Laboratories were required to resubmit when incomplete data were identified; however, some laboratories were not able to do so. Completeness of laboratory reporting was estimated by comparing self-reported laboratory testing logs to received data transmissions. Complete-ness was estimated to be 82% in 2006, 89% in 2007, and 98% in 2008. Adjusting for completeness, the proportion of persons with new diagnoses with initial resistance tests increased from 29% in 2006 to 39% in 2008 (p,.0001) (Figure 1). Incomplete data in key fields (e.g. name and date of birth) affected the matching of some reports to the surveillance registry. However, the proportion of resistance tests that could be matched was similar to other reportable tests.
The completeness and accuracy of risk ascertainment is an ongoing challenge for surveillance. Misclassification of
heterosex-Figure 1. Proportion of cases receiving genotype within 3 months of diagnosis, with adjustment for completeness of reporting.
doi:10.1371/journal.pone.0040533.g001
Transmitted Antiretroviral Drug Resistance
ual transmission as NIR and misclassification of MSM as heterosexual may account for our observations of reduced risk associated with NIR and equivalent risk in MSM and heterosex-uals [41].
Our TDR estimate may be biased because it is based on genotypes for less than one-third of persons with new diagnoses and less than one-half of those initiating care within 3 months. It is possible that TDR in persons not genotyped is significantly different from the TDR patterns reported here. In addition, our estimate may under-represent clinically important resistance; minority quasispecies, not detectable by genotypes reported to NYSDOH, have been shown to be prevalent in untreated persons and to reduce treatment efficacy [42]. Finally, current reporting does yet not allow the monitoring of resistance certain classes of ARVs including integrase strand-transfer inhibitors, entry inhib-itors or CCR5 receptor antagonists.
Conclusion
Using the New York State HIV resistance surveillance system, we have taken an important step in addressing transmitted drug resistance as a public health concern. In contrast to earlier local reports, our data suggest that TDR is not increasing and that multiclass TDR is not prevalent. Furthermore, TDR is not isolated to a specific subgroup, and common starting regimens are still effective for most new diagnoses in New York State. This information will help shape our response to the epidemic in both the public health and medical communities.
This analysis suggests that continuing routine resistance surveillance is appropriate for three reasons. First, more data are needed to verify the trend in TDR. Resistance surveillance systems such as the one describe here are uniquely qualified to provide consistent, long-term monitoring. Methodological differences between short-term studies make it difficult to evaluate trends in TDR. Second, treatment-intensive community strategies such as ‘Test and Treat’ and PrEP may increase TDR. Third, in contrast to surveillance based on specimen salvage, which is costly and logistically difficult, resistance surveillance through routine elec-tronic reporting is relatively low cost and scalable. If improved TDR estimation is found to be necessary, routine reporting could be supplemented with specimen salvage from new diagnoses without routine genotype results.
This work illustrates the power of surveillance to establish baselines and monitor progress toward goals established to achieve epidemic mitigation and control [43]. However, broader provider uptake of genotype testing is needed to better estimate population TDR and to understand the TDR prevalence at which routine genotyping and surveillance of new diagnoses provide clinically and epidemiologically significant information.
Author Contributions
Conceived and designed the experiments: AR LT DG. Performed the experiments: AR LT DG ZW KB MK BA LS. Analyzed the data: AR LT DG ZW LF. Contributed reagents/materials/analysis tools: KB MK BA LS. Wrote the paper: AR LT DG. Interpreted the data: AR LT DG.
References
1. Kuritzkes DR, Lalama CM, Ribaudo HJ, Marcial M, Meyer WA, et al. (2008) Preexisting resistance to nonnucleoside reverse-transcriptase inhibitors predicts virologic failure of an efavirenz-based regimen in treatment-naive HIV-1-infected subjects. J Infect Dis 197(6): 867–870.
2. Borroto-Esoda K, Waters JM, Bae AS, Harris JL, Hinkle JE, et al. (2007) Baseline genotype as a predictor of virological failure to emtricitabine or stavudine in combination with didanosine and efavirenz. AIDS Res Hum Retroviruses 23(8): 988–995.
3. Shet A, Berry L, Mohri H, Mehandru S, Chung C, et al. (2006) Tracking the prevalence of transmitted antiretroviral drug-resistant HIV-1: a decade of experience. J Acquir Immune Defic Syndr 41(4): 439–446.
4. Markowitz M, Mohri H, Mehandru S, Shet A, Berry L, et al. (2005) Infection with multidrug resistant, dual-tropic HIV-1 and rapid progression to AIDS: a case report. Lancet 365(9464): 1031–1038.
5. Torian LV, Blank S, Kellerman SE, Frieden TR, Ho DD, et al. (2006) Investigation of a new diagnosis of multidrug-resistant, dual-tropic HIV-1 infection – New York City. MMWR Morb Mortal Wkly Rep 55(29): 793–796. 6. Blick G, Kagan RM, Coakley E, Petropoulos C, Maroldo L, et al. (2007) The probable source of both the primary multidrug-resistant (MDR) HIV-1 strain found in a patient with rapid progression to AIDS and a second recombinant MDR strain found in a chronically HIV-1-infected patient. J Infect Dis 195(9): 1250–1259.
7. State of New York.Code of Administrative Rules and Regulations(2000) Vol Title 10 Part 63.
8. State of New York.Public Health Law(1998) Vol Article 21, Title 3. 9. State of New York.Public Health Law(1988) Vol Article 27-F. 10. State of New York.Public Health Law(1983) Vol Article 21.
11. State of New York.Code of Administrative Rules and Regulations(2006). Notice of Adoption, Title 10, Part 63. ed.: New York Register.
12. State of New York.Code of Administrative Rules and Regulations(2005) Notice of Emergency Rule Making, Title 10 Part 63. ed.: New York Register. 13. Torian LV, Henning KJ, Kellerman SE, Frieden TR (2007) Striving toward
comprehensive HIV/AIDS surveillance: the view from New York City. Public Health Rep 122 Suppl 1: 4–6.
14. Torian LV, Wiewel EW, Liu KL, Sackoff JE, Frieden TR (2008) Risk factors for delayed initiation of medical care after diagnosis of human immunodeficiency virus. Arch Intern Med 168(11): 1181–1187.
15. New York State Department of Health, Bureau of HIV/AIDS Epidemiology (2008)New York State HIV/AIDS Surveillance Report.
16. Wheeler WH, Ziebell RA, Zabina H, Pieniazek D, Prejean J, et al. (2010) Prevalence of transmitted drug resistance associated mutations and HIV-1 subtypes in new HIV-1 diagnoses, U.S.-2006. AIDS 24(8): 1203–1212. 17. Centers for Disease Control, National Center for HIV/AIDS, Viral Hepatitis,
STD, and TB Prevention (2007). Annual Report 2007.
18. Department of Health and Human Services (2007) Guidelines for the use of antiretroviral agents in HIV-1-infected adults and adolescents. Available: http://www. aidsinfo.nih.gov/guidelines. Accessed 2010 Nov 12.
19. http://www.hiv.lanl.gov/content/sequence/HIV.Accessed 2010 Nov 12. 20. Liu TF, Shafer RW (2006) Web resources for HIV type 1 genotypic-resistance
test interpretation. Clin Infect Dis 42(11): 1608–1618.
21. HIV Drug Resistance database. Available: http://www.hivdb.stanford.edu. Accessed 2010 Nov 12.
22. Bennett DE, Camacho RJ, Otelea D, Kuritzkes DR, Fleury H, et al. (2009) Drug resistance mutations for surveillance of transmitted HIV-1 drug-resistance: 2009 update. PLoS One 4(3): e4724.
23. Grant RM, Lama JR, Anderson PL, McMahan V, Liu AY, et al. (2010) Preexposure chemoprophylaxis for HIV prevention in men who have sex with men. N Engl J Med 363(27): 2587–2599.
24. Youmans E, Tripathi A, Albrecht H, Gibson JJ, Duffus WA (2011) Transmitted antiretroviral drug resistance in individuals with newly diagnosed HIV infection: South Carolina 2005–2009. South Med J 104(2): 95–101.
25. Department of Health and Human Services (2006) Guidelines for the use of antiretroviral agents in HIV-1-infected adults and adolescents. Available: www.hiv.lanl. gov. Accessed 2010 Nov 12.
26. Sohler NL, Li X, Cunningham CO (2009) Gender disparities in HIV health care utilization among the severely disadvantaged: can we determine the reasons? AIDS Patient Care STDS 23(9): 775–783.
27. Mimiaga MJ, Reisner SL, Bland S, Skeer M, Cranston K, et al. (2009) Health system and personal barriers resulting in decreased utilization of HIV and STD testing services among at-risk black men who have sex with men in Massachusetts. AIDS Patient Care STDS 23(10): 825–835.
28. Smedley BD, ed (2003) Unequal Treatment: confronting racial and ethnic disparities in health care. Washington, DC: National Academy Press. 29. SPREAD Programme (2008) Transmission of drug-resistant HIV-1 in Europe
remains limited to single classes. AIDS 22(5): 625–635.
30. Cane P, Chrystie I, Dunn D, Evans B, Geretti Am, et al (2005) Time trends in primary resistance to HIV drugs in the United Kingdom: multicentre observational study. BMJ. 331(7529): 1368.
31. Descamps D, Chaix ML, Andre P, Brodard V, Cottalorda J, et al. (2005) French national sentinel survey of antiretroviral drug resistance in patients with HIV-1 primary infection and in antiretroviral-naive chronically infected patients in 2001–2002. J Acquir Immune Defic Syndr 38(5): 545–552.
32. Grant EC (2002) Hormone replacement therapy and risk of breast cancer. JAMA287(18):2360; author reply 2361.
33. Hurt CB, McCoy SI, Kuruc J, Nelson J, Kerkau M, et al. (2009) Transmitted antiretroviral drug resistance among acute and recent HIV infections in North Carolina from 1998 to 2007. Antivir Ther 14(5): 673–678.
Transmitted Antiretroviral Drug Resistance
34. Jain V, Liegler T, Vittinghoff E, Hartogensis W, Bacchetti P, et al. (2010) Transmitted drug resistance in persons with acute/early HIV-1 in San Francisco, 2002–2009. PLoS One 5(12): e15510.
35. Jayaraman GC, Archibald CP, Kim J, Rekart ML, Singh AE, et al. (2006) A population-based approach to determine the prevalence of transmitted drug-resistant HIV among recent versus established HIV infections: results from the Canadian HIV strain and drug resistance surveillance program. J Acquir Immune Defic Syndr 42(1): 86–90.
36. Ross L, Lim ML, Liao Q, Wine B, Rodriguez AE, et al. (2007) Prevalence of antiretroviral drug resistance and resistance-associated mutations in antiretro-viral therapy-naive HIV-infected individuals from 40 United States cities. HIV Clin Trials 8(1): 1–8.
37. Truong HM, Grant RM, McFarland W, Kellogg T, Kent C, et al. (2006) Routine surveillance for the detection of acute and recent HIV infections and transmission of antiretroviral resistance. AIDS 20(17): 2193–2197.
38. Yerly S, von Wyl V, Ledergerber B, Bo¨ni J, Schupbach J, et al. (2007) Transmission of HIV-1 drug resistance in Switzerland: a 10-year molecular epidemiology survey. AIDS 21(16): 2223–2229.
39. Weinstock HS, Zaidi I, Heneine W, Bennett D, Garcia-Lerma JG, et al. (2004) The epidemiology of antiretroviral drug resistance among drug-naive HIV-1-infected persons in 10 US cities. J Infect Dis 189(12): 2174–2180.
40. Little SJ, Holte S, Routy JP, Daar ES, Markowitz M, et al. (2002) Antiretroviral-drug resistance among patients recently infected with HIV. N Engl J Med 347(6): 385–394.
41. McDavid K, McKenna MT (2006) HIV/AIDS risk factor ascertainment: A critical challenge. AIDS Patient Care STD 20(4): 285–292.
42. Johnson JA, Li JF, Wei X, Lipscomb J, Irlbeck D, et al. (2008) Minority HIV-1 drug resistance mutations are present in antiretroviral treatment-naive populations and associate with reduced treatment efficacy. PLoS Med 5(7): e158. 43. White House Office of National AIDS Policy (2010).National HIV/AIDS strategy for the United States. Available: http://aids.gov/federal-resources/policies/ national-hiv-aids-strategy/nhas.pdf. Accessed 2011 Mar 28.
Transmitted Antiretroviral Drug Resistance