Roselaine Ruviaro ZaniniI Anaelena Bragança de MoraesI Elsa Regina Justo GiuglianiII João RiboldiII
I Departamento de Estatística. Centro de Ciências Naturais e Exatas. Universidade Federal de Santa Maria. Santa Maria, RS, Brasil
II Programa de Pós-Graduação em
Epidemiologia. Universidade Federal do Rio Grande do Sul. Porto Alegre, RS, Brasil Correspondence:
Roselaine Ruviaro Zanini Av. Roraima, 1000 CCNE - Prédio 13 - Camobi 97105-900 - Santa Maria, RS, Brasil E-mail: [email protected] Received: 8/21/2009 Approved: 8/23/2010
Article available from: www.scielo.br/rsp
Contextual determinants of
neonatal mortality using two
analysis methods, Rio Grande
do Sul, Brazil
ABSTRACT
OBJECTIVE: To analyze neonatal mortality determinants using multilevel logistic regression and classic hierarchical models.
METHODS: Cohort study including 138,407 live births with birth certifi cates and 1,134 neonatal deaths recorded in 2003, in the state of Rio Grande do Sul, Southern Brazil. The Information System on Live Births and mortality records were linked for gathering information on individual-level exposures. Sociodemographic data and information on the pregnancy, childbirth care and characteristics of the children at birth were collected. The associated factors were estimated and compared by traditional and multilevel logistic regression analysis.
RESULTS: The neonatal mortality rate was 8.19 deaths per 1,000 live births. Low birth weight, 1- and 5-minute Apgar score below eight, congenital malformation, pre-term birth and previous fetal loss were associated with neonatal death in the traditional model. Elective cesarean section had a protective effect. Previous fetal loss did not remain signifi cant in the multilevel model, but the inclusion of a contextual variable (poverty rate) showed that 15% of neonatal mortality variation can be explained by varying poverty rates in the microregions.
CONCLUSIONS: The use of multilevel models showed a small effect of contextual determinants on the neonatal mortality rate. There was found a positive association with the poverty rate in the general model, and the proportion of households with water supply among preterm newborns.
DESCRIPTORS: Neonatal Mortality (Public Health). Mortality Registries. Risk Factors. Socioeconomic Factors. Cohort Studies.
INTRODUCTION
Of the 130 million children born worldwide every year, about 4 million die during the neonatal period, though this proportion depends on the overall mortality rate.25 Daily risk of death varies signifi cantly and infants are at greatest
risk during the fi rst week of life.11
Almost all neonatal deaths (99%) are in low- or middle-income countries.11
Children born in poor countries have a higher risk of death and neonatal mortality rate is 19% to 44% higher in poor families.10
births in 1990 to 13.1 in 2008. During that same period, neonatal mortality (zero to 27 days of age) and post-neonatal (28–364 days of age) in Rio Grande do Sul decreased from 14.7‰ to 8.3‰ and from 11.5‰ to 4.5‰ respectively, showing a signifi cant death reduc-tion in children 28 days old or more.
Mother and child characteristics are analyzed as determinants of child mortality and its components, socioeconomic characteristics, perinatal procedures, management and maternal diseases, birth weight, prematurity, type of childbirth and birth defects have been extensively investigated.13,15
Regional and social differences may infl uence the composition of population groups9 and the success of
local health promotion programs. Living in poor areas can have negative effects on children’s health.19
Traditional models of analysis assume independence of observations and homogeneity of variance but they do not take into account a hierarchy of predictors, i.e., observations originated from the same unit may be more similar than those coming from different units. It can lead to overestimation of clustering effects and inaccurate conclusions.9
Multilevel regression analysis is an alternative method to more traditional models as it takes into account the outcome measured at the individual level and expla-natory variables at any level. These models allow a separate analysis of the effect of different levels and provide information on global variability.9 The
litera-ture has recognized its strengths,9,15 though there is no
consensus on the conceptual and operational aspects of the contextual variables used.
Hence, to broaden the understanding of factors asso-ciated with neonatal death, the present study aimed to analyze neonatal mortality determinants using multi-level logistic regression analysis and the traditional hierarchical model.
METHODS
Static historical cohort study including 138,407 live births to women living in the state of Rio Grande do Sul, Southern Brazil, and with birth certifi cates (BC) recorded between January 1st, 2003 and December 3rd,
2003. Deaths were identifi ed by selecting common variables and linking them to birth and death databases (linkage). Survivors were those live newborns with BC not linked to a related DC, assuming no migra-tion or loss of observamigra-tions during the study period. Fields used for linkage included: code of the mother’s residence city, date of birth, gender, birth weight,
a Souza LM. Avaliação do Sistema de Informação sobre Nascidos Vivos – SINASC, Minas Gerais e Mesorregiões [Master’s dissertation]. Belo Horizonte: Universidade Federal de Minas Gerais; 2004.
mother’s age, type of delivery and pregnancy. There were excluded 122 certifi cates due to missing informa-tion in the DC.
The dependent variable was occurrence of death or not in children aged less than 28 days.
Information on exposure at the individual level was obtained from BCs and DCs recorded in the Brazilian National Live Birth Database (Sistema de Informações sobre Nascidos Vivos – SINASC) and Death Database (Sistena de Informações sobre Mortalidade – SIM), respectively, included in the Brazilian National Health System Database (DATASUS).
Intrauterine growth charts of Lubchenco,4 adapted by
Souza (2004),a provide an expected distribution of
weight per gestational age, and they were used as a parameter to detect errors in data records. The following were considered errors: gestational age <22 weeks; birth weight <500 g; gestational age <27 weeks and birth weight > 1500 g; gestational age <31 weeks and birth weight >2500 g; and gestational age >37 weeks and birth weight <1500 g. According to these criteria, there were excluded 175 (0.13%) records, and 14 (0.01%) children whose mother’s age did not match their parity (e.g., mother aged 18 with 16 children).
The proximal determinants were: 1- and 5-minute Apgar scores; birth weight; gestational age; number of prenatal visits; gender; single or multiple pregnancy; previous fetal loss; type of delivery; presence of birth defects; in-hospital birth or other; and small for gestational age (simplifi ed SGA). As information on BCs about pregnancy duration at predetermined intervals does not allow the classifi cation of live births by adequacy of weight for gestational age, we used the simplifi ed defi nition of SGA:6 live births weighing <2500 g and
gestational age >37 weeks.
Intermediate variables included mother’s age and parity, and distal determinants included skin color/ethnicity; maternal education; marital status; and mother’s occu-pation (homemaker; employed).
There were evaluated the characteristics that refl ect the socioeconomic and demographic background of 35 microregions in Rio Grande do Sul and that, based on the theoretical reference, are major determinants of child mortality and its components:13,15 urbanization
the minimum wage); hospitalization rate due to assault, murder; participation in the labor market (percentage of economically active people at productive age); gross domestic product (per capita GDP); household density (percentage of people living in households with a density greater than two); immunization coverage in the fi rst year of life (tuberculosis [Bacille Calmette-Guerin – BCG], measles); Family Health Strategy (percentage of people enrolled); water supply (proportion of households with water supply system) and sanitation system (percentage of households with sanitation system); proportion of cesarean deliveries; proportion of women attending seven or more prenatal care visits; health insurance (percentage of people with private insurance for consulta-tions, tests or hospitalizations); proportion of physicians (including resident doctors) and hospital beds per 1,000 inhabitants; and per capita spending with primary care.
The variables were obtained from the Instituto Brasileiro de Geografi a e Estatística (IBGE – Brazilian Institute of Geography and Statistics); DATASUS National Immunization Program, Primary Care Database, and Brazilian National Agency for Supplementary Health Care; Institute of Applied Economic Research; Foundation of Economics and Statistics; National System of Urban Indicators; and Socioeconomic Atlas of Rio Grande do Sul.
The contextual variables were evaluated in a continuous scale (centered on the average), in quintiles or quartiles, or dichotomized.
Univariate and multivariate analyses were performed to test the association of predictors with neonatal mortality and measures of association included crude and adjusted odds ratios (ORs) and their related 95% confi dence intervals.
Multiple logistic regression was used to adjust for confounders, and the Wald test and likelihood ratio test were used to examine the signifi cance of the models.
The hierarchical model was adapted as proposed by Mosley & Chen (1984)17 to identify determinants of
child mortality in developing countries. Biological and social variables were divided into proximal (child health status), intermediate (maternal factors) and distal (socioeconomic and health service in the microregions). The variables were included in the model step by step and those with p<0.25 in the univariate analysis were included in the model.
Live births were included, even those with missing information for some variables.
For the selection of contextual variables, in addition to the theory reference, a correlation analysis was conducted to assess multicollinearity.
The analysis included all live births divided by preterm and full-term gestational age.
The multilevel logistic regression analysis took into account inherent data hierarchy: microregions (cluster of neighboring municipalities intended to integrate the organization, planning and implementation of shared public functions) as level 2 and live births as level 1. A random intercept model was adjusted assuming that all coeffi cients of the multilevel regression model are the same for all the regions, but their intercepts may vary.
At the end of each stage, statistical signifi cance of the estimates and the variation at each level were assessed, and then estimated the Bayesian deviance information criterion (DIC) for model comparison and selection.9
Traditional and multilevel analyses were performed using SPSS 13.0 (SPSS Inc., Chicago, USA) and MLwiN 2.02 (Center for Multilevel Modeling, Bristol, UK), respectively.
The study was approved by the Research Committee at Universidade Federal do Rio Grande do Sul (UFRGS) School of Medicine, and approval by a research ethics committee was not required as secondary data of public domain were used.
RESULTS
The proportion of newborns classifi ed as SGA was 4.1%. The percentage of cesarean sections was 44.7% for the total population of newborns, and was higher (57.5%) among children born with very low birth weight (<1500 g) and premature infants (52.4%).
The neonatal mortality rate was 8.19 ‰, 5.55 ‰ in the early neonatal and 2.64 ‰ in the late neonatal period.
A total of 769 (67.8%) of deaths occurred in the early neonatal period (zero to six days of age), of which 587 (76.3%) had birth weight <2500 g and 173 (22.5%) very low birth weight. Of the 365 (32.2%) late neonatal deaths (seven to 27 days of age), 269 (73.7%) were children born with low birth weight and 173 (47.4%) with very low birth weight.
Among deaths, the mean weight was 1,700.26 g (stan-dard deviation [SD] = 968.57), the average 1- and 5-minute Apgar scores were 4.68 (SD = 2.93) and 6.33 (SD = 2.87) and cesarean rate was 41.4%.
Newborns characteristics, the mortality rate and the results of the univariate analysis and traditional logistic regression are presented in Table 1. Table 2 shows the results for preterm and full-term newborns.
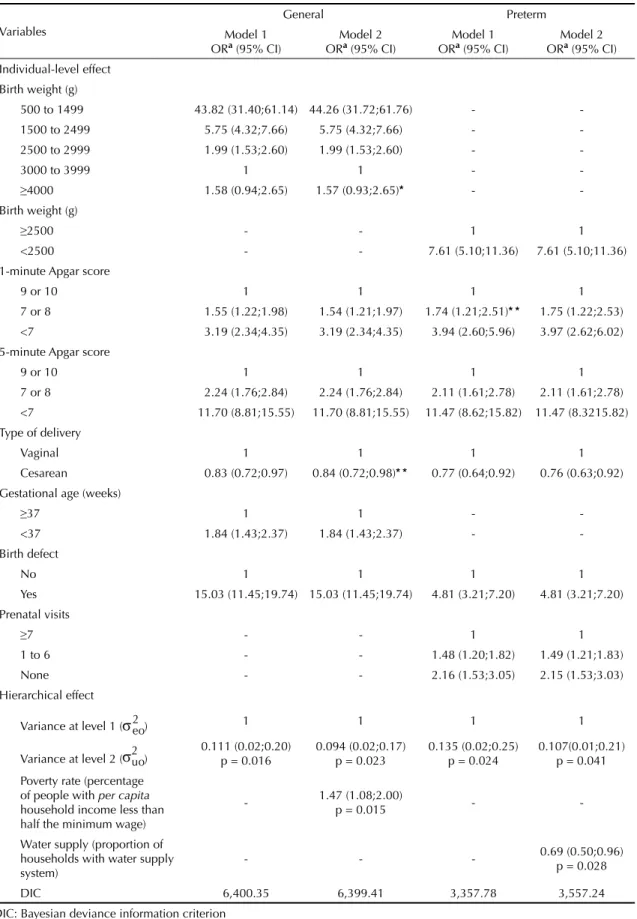
The results of the multilevel logistic regression are presented in Table 3. The model for full-term newborns showed no signifi cant residual variance at microregion level (p = 0.266).
The extra-binomial variation at level 1 (over-dispersion = 0.993) showed no signifi cant evidence that the data did not follow a binomial distribution.
The estimate of the residual variance at the microregion level was signifi cant (p = 0.011) for the entire cohort of newborns. The estimated within microregion corre-lation9 indicated that most of the outcome variance
(97.7%) occurred among individuals, and that 2.3% are due to variation between microregions.
Poverty rate, hospitalization rate due to assault and life expectancy at birth remained signifi cant in the combined analysis of individual-level and contextual variables. However, when they were included in the model at the same time, only poverty rate, dichotomized at the 66th percentile (28.5%), remained signifi cant.
The reduction in the model variance indicates that about 15% of the variation in neonatal mortality can be explained by poverty rate in each area.
The residual variance of the model without covariates at the microregion level was signifi cant (p = 0.004) for preterm newborns, which suggests that 5.4% of the outcome variance was due to variability between microregions.
In this model, only the proportion of households with water supply system, dichotomized at the median (71.7%), was statistically signifi cant. The inclusion
of the contextual variable after the inclusion of indi-vidual variables reduced the variance, which suggests that about 21% of the variability in neonatal mortality can be explained by the coverage of water supply in each area.
For the analysis of residues of the model for preterm newborns, the lowest estimated risk of neonatal death compared to the overall mean was seen in the microre-gion of Porto Alegre (state capital), while the estimates were not signifi cantly different from the mean for all other microregions.
The Figure illustrates the residual variance between microregions in the general model, in order of magni-tude, in which two subpopulations are associated with a particular low or high risk of death. The lowest predicted risk of neonatal death is seen in the microregion of Porto Alegre and the highest risks are seen in the microregions of Passo Fundo and Litoral Lagunar. The risks were not signifi cant in the remaining microregions.
DISCUSSION
Rio Grande do Sul has one of the best SINASC and SIM coverages, allowing record linkage in cohort studies. There were inconsistencies and missing information, as reported in other studies,1,24 but their relative weight was
small in this study. A study conducted in all Brazilian states in 2002 pointed to SINASC as a potential source
Note: (1) Santa Rosa, (2) Três Passos, (3) Frederico Westphalen, (4) Erechim, (5) Sananduva, (6) Cerro Largo, (7) Santo Ângelo, (8) Ijuí, (9) Carazinho, (10) Passo Fundo, (11) Cruz Alta, (12) Não-me-Toque, (13) Soledade, (14) Guaporé, (15) Vacaria, (16) Caxias do Sul, (17) Santiago, (18) Santa Maria, (19) Restinga Seca, (20) Santa Cruz, (21) Lajeado-Estrela, (22) Cachoeira do Sul, (23) Montenegro, (24) Gramado-Canela, (25) São Jerônimo, (26) Porto Alegre, (27) Osório, (28) Camaquã, (29) Campanha Ocidental, (30) Campanha Central, (31) Campanha Meridional, (32) Serras de Sudeste, (33) Pelotas, (34) Jaguarão and (35) Litoral Lagunar
1.2
Inter
cepts
Porto Alegre
Litoral Lagunar
Passo Fundo
23 24 26
14
1528 9 8 2 1913
11
1729 25
2227 6
16 4 30
5 12
33 20 7 31 3510
18 32 34 1
213
Microregions 1.0
0.7
0.5
0.2
0.0
-0.2
-0.5
-0.7
-1.0
-1.2
0 5 10 15 20 25 30 35
Table 1. Risk factors for neonatal mortality. Rio Grande do Sul, Southern Brazil, 2003.
Variables Live births (%) Survival (%) Death (%) Neonatal mortality rate (1000)
Crude OR
(95% CI) Adjusted OR a (95% CI)
Gender
Female 67,117 (48.49) 66,604 (48.52) 513 (45.40) 7.64 1 1 Male 71,284 (51.51) 70,667 (51.48) 617 (54.60) 8.66 1.13 (1.00;1.27) -Skin color/ethnicity
White 123,254 (89.22) 122,296 (89.25) 958 (85.00) 7.77 1 1 Other 14,897 (10.78) 14,728 (10.75) 169 (15.00) 11.34 1.46 (1.24; 1.72) -Birth weight (g) 3,152.51 (552.26); 500 a 5,990b
500 to 1499 1,795 (1.30) 1,208 (0.88) 587 (52.13) 327.02 (268.96;402.24)328.91 41.15 (29.25; 57.87)
1500 to 2499 11,179 (8.09) 10,910 (7.96) 269 (23.89) 24.06 (13.49;20.65)16.69 5.46 (4.07;7.31)
2500 to 2999 33,990 (24.60) 33,863 (24.71) 127 (11.28) 3.74 2.54 (1.98;3.25) 1.97 (1.50;2.58) 3000 to 3999 84,735 (61.32) 84,610 (61.74) 125 (11.10) 1.48 1 1
≥4000 6,474 (4.68) 6,456 (4.71) 18 (1.60) 2.78 1.89 (1.15;3.10) 1.43 (0.83;2.47)
1-minute Apgar score 8.29 (1.33); 0 a 10b
9 or 10 73,385 (54.44) 73,271 (54.78) 114 (10.99) 1.55 1 1 7 or 8 52,344 (38.83) 52,107 (38.96) 237 (22.85) 4.53 2.92 (2.34;3.66) 1.59 (1.24;2.04)
<7 9,061 (6.73) 8,375 (6.26) 686 (66.15) 75.71 (43.06;64.18)52.57 3.36 (2.44;4.61)
5-minute Apgar score 9.32 (0.88); 0 a 10b
9 or 10 123,739 (91.70) 123,436 (92.19) 303 (29.19) 2.45 1 1
7 or 8 9,579 (7.10) 9,298 (6.94) 281 (27.07) 29.34 (10.45;14.50)12.31 2.22 (1.74;2.84)
<7 1,615 (1.20) 1,161 (0.87) 454 (43.74) 281.11 (135.92;185.88)158.95 (8.51;15.25)11.39
Birth defects
No 136,612 (99.19) 135,650 (99.29) 962 (86.51) 7.04 1 1
Yes 1,119 (0.81) 969 (0.71) 150 (13.49) 134.05 21.83 (18.17;26.22)
14.79 (11.18;19.59) Simplifi ed SGA
Non-SGA 132,138 (95.88) 131,108 (95.91) 1,030 (92.29) 7.79 1 1 SGA 5,682 (4.12) 5,596 (4.09) 86 (7.71) 15.14 1.96 (1.57;2.44) -Place of birth
Hospital 137,663 (99.46) 136,567 (99.49) 1,096 (96.99) 7.99 1 1 Other 740 (0.54) 706 (0.51) 34 (3.01) 45.95 6.00 (4.23;8.51) -Type of delivery
Vaginal 76,550 (55.32) 75,888 (55.30) 662 (58.58) 8.65 1 1 Cesarean 61,816 (44.68) 61,348 (44.70) 468 (41.42) 7.57 0.87 (0.78;0.98) 0.80 (0.68;0.93) Type of pregnancy
Single 135,751 (98.12) 134,720 (98.17) 1,031 (91.32) 7.59 1
Multiple 2,605 (1.88) 2,507 (1.83) 98 (8.68) 37.62 5.11 (4.14;6.31) -Gestational age (weeks)
≥37 126,578 (91.73) 126,251 (92.25) 327 (29.20) 2.59 1 1
<37 11,406 (8.27) 10,613 (7.75) 793 (70.80) 69.44 (25.32;32.86)28.85 1.84 (1.42;2.39)
Prenatal visits
≥7 81,944 (59.52) 81,593 (59.75) 351 (31.71) 4.28 1
of epidemiological information on births. SINASC database has good-to-excellent data completeness and shows good consistency for most variables despite data completion problems.19
The analysis of this cohort showed that the neonatal mortality rate was about half of the national average rate in 2003, which is still high compared to rates in deve-loped countries. Higher rates of early neonatal deaths are corroborates in other studies.12,22 This proportional
increase may be explained by a decline in late neonatal and post-neonatal mortality rates that have been reduced through simple interventions such as immunization and oral rehydration therapy.25
Birth weight and prematurity are major risk factors for neonatal mortality.3,7,11,18 In the present study, there was
found an inverse relationship between birth weight and neonatal death, consistent with other studies conducted in Pelotas (Southern Brazil), São Paulo (Southeastern Brazil), and Recife (Northeastern Brazil).3,12,22 Pre-term
newborns were almost twice as likely to die in the
neonatal period compared with full-term infants, as reported in a study conducted in São Paulo.12
Although Brazilian studies have reported an association between increased neonatal mortality and cesarean sections,16 the present study found that cesarean births
had a protective effect, especially for preterm newborns. Early elective delivery with adequate indication for a cesarean section may reduce the risk of death for preterm newborns at risk, i.e., the risk of waiting for natural childbirth may exceed that of cesarean delivery. A study in the city of Goiânia, Central-West Brazil, has investigated this effect and pointed out that birth in a hospital that is not affi liated to the Sistema Único de Saúde (SUS – National Health System), where cesarean rates are higher, may be associated with higher socioeconomic conditions and maternal health status.16 Furthermore, cohort studies conducted in
Montes Claros, Southeastern Brazil, and Recife found no signifi cant association between type of delivery and neonatal death.14,22
Table 1 continuation
Variables Live births (%) Survival (%) Death (%) Neonatal mortality rate (1000)
Crude OR
(95% CI) Adjusted OR a (95% CI)
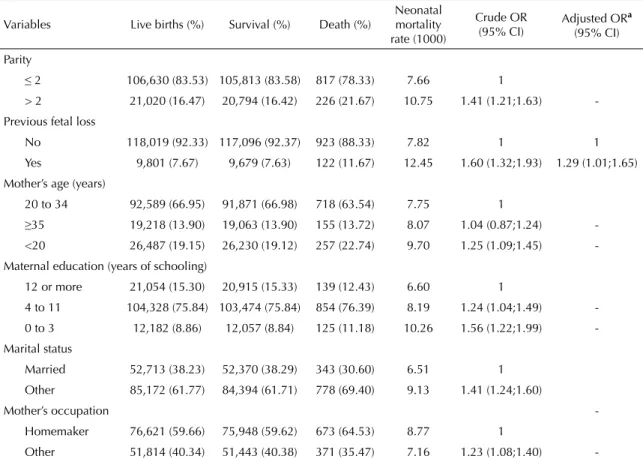
Parity
≤ 2 106,630 (83.53) 105,813 (83.58) 817 (78.33) 7.66 1
> 2 21,020 (16.47) 20,794 (16.42) 226 (21.67) 10.75 1.41 (1.21;1.63) -Previous fetal loss
No 118,019 (92.33) 117,096 (92.37) 923 (88.33) 7.82 1 1 Yes 9,801 (7.67) 9,679 (7.63) 122 (11.67) 12.45 1.60 (1.32;1.93) 1.29 (1.01;1.65) Mother’s age (years)
20 to 34 92,589 (66.95) 91,871 (66.98) 718 (63.54) 7.75 1
≥35 19,218 (13.90) 19,063 (13.90) 155 (13.72) 8.07 1.04 (0.87;1.24) -<20 26,487 (19.15) 26,230 (19.12) 257 (22.74) 9.70 1.25 (1.09;1.45) -Maternal education (years of schooling)
12 or more 21,054 (15.30) 20,915 (15.33) 139 (12.43) 6.60 1
4 to 11 104,328 (75.84) 103,474 (75.84) 854 (76.39) 8.19 1.24 (1.04;1.49) -0 to 3 12,182 (8.86) 12,057 (8.84) 125 (11.18) 10.26 1.56 (1.22;1.99) -Marital status
Married 52,713 (38.23) 52,370 (38.29) 343 (30.60) 6.51 1 Other 85,172 (61.77) 84,394 (61.71) 778 (69.40) 9.13 1.41 (1.24;1.60)
Mother’s occupation
-Homemaker 76,621 (59.66) 75,948 (59.62) 673 (64.53) 8.77 1
Other 51,814 (40.34) 51,443 (40.38) 371 (35.47) 7.16 1.23 (1.08;1.40) -n = 138,407; 95% CI: 95% co-nfi de-nce I-nterval
aAdjusted for other variables in the table by traditional multiple logistic regression models
There was found an association between Apgar scores and neonatal mortality, especially for 5-minute Apgar scores, which corroborates studies conducted in São Paulo,13 Montes Claros14 and Recife.18 Unlike most
Brazilian studies22,24 who found scores <7 as predictive
of increased risk of death, the present study showed that Apgar scores ≤8 indicated more vulnerable newborns.
Birth defects and previous fetal loss – variables not explored in most studies – were associated with the outcome. This association has been reported in a study conducted in São Paulo, although stronger than that observed in the present analysis.2
The literature points to the importance of the determi-nants investigated in traditional analysis; many health processes result from factors that are affected at different levels because they share the same environment or have similar characteristics. Thus, the individuals involved may be correlated, and violation of the assumption of independence of observations may lead to biased esti-mates while using traditional regression techniques.9
The ability to estimate the variability at each level is one of the main strengths of multilevel models.9 In the
present study there was seen greater effect of indivi-dual factors and a smaller though signifi cant effect of microregions. A Canadian study has suggested that the
effects of local distribution of health problems in large administrative areas are relatively small and infl uenced by the size of the geographical area and the selected health indicator.5
A comparison of estimates from the traditional and the multilevel model showed that standard errors were, on average, one percent point higher in the multilevel model, which can be considered a small difference. It was found that the odds of dying in the neonatal period were greater for children born in microregions with higher poverty rate in the general model. However, the size of geogra-phical areas or limited availability of variables may not have allowed to identifying a stronger effect at the upper level. A study evaluating child mortality trends in Porto Alegre reported smaller reductions in poorer areas; however, it did not include a multilevel analysis.8
A cohort study of 223,289 live births and 1,266 child deaths in the state of New York, US, included multilevel logistic regression analysis to identify individual and contextual (counties) determinants of child mortality. The poverty had no signifi cant effect. Government spending on health services and hospitals were asso-ciated with increased likelihood of child mortality, while high number of hospital beds per capita reduced the likelihood of death. As in the present study, the New Table 2. Risk factors for neonatal mortality for preterm and full-term newborns. Rio Grande do Sul, Southern Brazil, 2003.
Variables Preterm n = 11,406 (8.24%) Full-term n = 126,578 (91.45%) Crude OR Adjusted ORa (95% CI) Crude OR Adjusted ORa (95% CI) Birth weight (g)
≥2500 1 1 1 1
<2500 16.06 7.67 (5.17;11.38) 7.78 4.07 (3.00;5.50) 1-minute Apgar score
9 or 10 1 1 1 1
7 or 8 2.63 1.77 (1.23;2.54) 1.77 1.36 (0.98;1.89)
<7 24.42 3.96 (2.63;5.97) 22.22 3.72 (2.35;5.89)
5-minute Apgar score
9 or 10 1 1 1 1
7 or 8 5.24 2.11 (1.61;2.76) 7.31 2.81 (1.88;4.20)
<7 45.92 11.16 (8.13;15.32) 100.60 23.20 (14.67;36.68) Birth defect
No 1 1 1 1
Yes 8.41 4.51 (3.02;6.72) 46.01 21.81 (15.60;30.50)
Type of delivery
Vaginal 1 1
Cesarean 0.64 0.74 (0.62;0.89) -
-Prenatal visits
≥7 1 1
1 to 6 2.33 1.43 (1.17;1.75) -
-None 5.22 1.99 (1.42;2.79) -
Table 3. Risk factors for neonatal mortality due to all causes, in the general model and for preterm newborns. Rio Grande do Sul, Southern Brazil, 2003.
Variables
General Preterm
Model 1
ORa (95% CI) ORModel 2a (95% CI) ORModel 1a (95% CI) ORModel 2a (95% CI) Individual-level effect
Birth weight (g)
500 to 1499 43.82 (31.40;61.14) 44.26 (31.72;61.76) -
-1500 to 2499 5.75 (4.32;7.66) 5.75 (4.32;7.66) -
-2500 to 2999 1.99 (1.53;2.60) 1.99 (1.53;2.60) -
-3000 to 3999 1 1 -
-≥4000 1.58 (0.94;2.65) 1.57 (0.93;2.65)* -
-Birth weight (g)
≥2500 - - 1 1
<2500 - - 7.61 (5.10;11.36) 7.61 (5.10;11.36)
1-minute Apgar score
9 or 10 1 1 1 1
7 or 8 1.55 (1.22;1.98) 1.54 (1.21;1.97) 1.74 (1.21;2.51)* * 1.75 (1.22;2.53) <7 3.19 (2.34;4.35) 3.19 (2.34;4.35) 3.94 (2.60;5.96) 3.97 (2.62;6.02) 5-minute Apgar score
9 or 10 1 1 1 1
7 or 8 2.24 (1.76;2.84) 2.24 (1.76;2.84) 2.11 (1.61;2.78) 2.11 (1.61;2.78) <7 11.70 (8.81;15.55) 11.70 (8.81;15.55) 11.47 (8.62;15.82) 11.47 (8.3215.82) Type of delivery
Vaginal 1 1 1 1
Cesarean 0.83 (0.72;0.97) 0.84 (0.72;0.98)* * 0.77 (0.64;0.92) 0.76 (0.63;0.92) Gestational age (weeks)
≥37 1 1 -
-<37 1.84 (1.43;2.37) 1.84 (1.43;2.37) -
-Birth defect
No 1 1 1 1
Yes 15.03 (11.45;19.74) 15.03 (11.45;19.74) 4.81 (3.21;7.20) 4.81 (3.21;7.20) Prenatal visits
≥7 - - 1 1
1 to 6 - - 1.48 (1.20;1.82) 1.49 (1.21;1.83)
None - - 2.16 (1.53;3.05) 2.15 (1.53;3.03)
Hierarchical effect
Variance at level 1 ( ) 1 1 1 1
Variance at level 2 ( ) 0.111 (0.02;0.20)p = 0.016 0.094 (0.02;0.17)p = 0.023 0.135 (0.02;0.25)p = 0.024 0.107(0.01;0.21)p = 0.041 Poverty rate (percentage
of people with per capita household income less than half the minimum wage)
- 1.47 (1.08;2.00)p = 0.015 -
-Water supply (proportion of households with water supply system)
- - - 0.69 (0.50;0.96)p = 0.028
DIC 6,400.35 6,399.41 3,357.78 3,557.24
DIC: Bayesian deviance information criterion
a Adjusted for other variables in the table using multilevel multiple logistic regression models
York study tested other variables but they were not asso-ciated with outcome, although it did not include birth weight and gestational age as exploratory variables.15
Two studies carried out in Northeast Brazil used multi-level proportional hazards models for child survival analyzed at household and municipality level. One study23 found non-signifi cant variance at the household
level but signifi cant variance at the municipality level. Birth interval and birth order were major predictors of child mortality, as well as mother’s education and family income, though with lower effect.23 The second
study showed that prenatal care, higher maternal education, Caucasian or Asian ethnicity and having a refrigerator at home are factors that reduce the risk of child death. It was also found an association with birth order and birth interval, but not with the municipality where children lived.21
In multilevel models, residuals can be analyzed at each level, enabling to assess specifi c patterns in the areas studied.9 The microregion of Porto Alegre had a lower
than average risk of neonatal death, possibly due to increased access to quality care. On the other hand, the microregions of Passo Fundo and Litoral Lagunar had a higher than average risk in the general model, indicating the need for specifi c actions in these areas, such as quality prenatal, delivery and newborn care.
One of the limitations of the study is that there may have been measurement bias due to the use of secon-dary data, the effect of the size of microregions (large
internal variability) and non-inclusion of other potential determinants such as alcohol and tobacco use or breas-tfeeding (data not available), as well as the classifi cation used for errors in the records.
Due to the large number of variables studied and the correlation between some of them, the explanatory power of other variables not included would likely be reduced. This could in part explain the small effect of area as the intra-unit correlation is inversely associated to the size of the groups.5 On the other hand, smaller groups could
negatively affect the results because of the large number of localities with a small number of events.
The bias of the ecological fallacy – all observations in a given area hold to all individuals within that area – should also be considered.
Multilevel models do not necessarily produce results different from the traditional statistical analysis, but the estimates tend to be more accurate. Despite its limitations, multilevel modeling was able to capture a signifi cant effect at each level.
1. Almeida MF, Mello-Jorge, MHP. O uso da técnica de “Linkage” de sistemas de informação em estudos de coorte sobre mortalidade neonatal. Rev Saude Publica. 1996;30(2):141-7. DOI:10.1590/S0034-89101996000200005
2. Almeida MF, Novaes HMD, Alencar GP, Rodrigues LC. Mortalidade neonatal no Município de São Paulo: infl uência do peso ao nascer e fatores sócio-demográfi cos e assistenciais. Rev Bras Epidemiol. 2002;5(1):93-107. DOI:10.1590/S1415-790X2002000100011
3. Barros FC, Victora CG, Barros AJD, Santos IS, Albernaz E, Matijasevich A, et al. The challenge of reducing neonatal mortality in middle-income countries: fi ndings from three Brazilian birth cohorts in 1982, 1993, and 2004. Lancet. 2005; 365(9462):847-54. DOI:10.1016/S0140-6736(05)71042-4
4. Battaglia FC, Lubchenco MD. A practical classifi cation of newborn infants by weight and gestational age. J Pediatr. 1967;71(2):159-63.
5. Boyle MH, Willms JD. Place effects for areas defi ned by administrative boundaries. Am J Epidemiol. 1999;149(6):577-85.
6. Costa CE, Gotlieb SLD. Estudo epidemiológico do peso ao nascer a partir da Declaração de Nascido Vivo. Rev Saude Publica. 1998;32(4):328-34. DOI: 10.1590/ S0034-89101998000400004
7. Ferrari LSL, Brito ASJ, Carvalho ABR, Gonzáles MRC. Mortalidade neonatal no Município de Londrina, Paraná, Brasil, nos anos 1994, 1999 e 2002. Cad Saude Publica. 2006;22(5):1063-71. DOI:10.1590/ S0102-311X2006000500019
8. Goldani MZ, Benatti R, Silva AAM, Bettiol H, Correa JCW, Tietzmann M, et al. Narrowing inequalities in infant mortality in Southern Brazil. Rev Saude Publica. 2002;36(4):478-83. DOI:10.1590/S0034-89102002000400014
9. Goldstein H. Multilevel statistical models. 3. ed. London: Edward Arnold; 2003.
10. Knippenberg R, Lawn JE, Darmstadt GL, Begkoyian G, Fogstad H, Walelign N, et al. Systematic scaling up of neonatal care in countries. Lancet. 2005; 365(9464):1087-98. DOI:10.1016/S0140-6736(05)71145-4
11. Lawn JE, Cousens S, Zupan J. 4 million neonatal deaths: when? Where? Why? Lancet. 2004;365(9462):891-900. DOI: 10.1016/S0140-6736(05)71048-5
12. Machado CJ, Hill K. Determinants of neonatal and post-neonatal mortality in the City of São Paulo. Rev Bras Epidemiol. 2003;6(4):345-58. DOI:10.1590/ S1415-790X2003000400009
13. Machado CJ, Hill K. Maternal, neonatal and community factors infl uencing neonatal mortality in Brazil. J Biosoc Sci. 2005;37:193-208.
14. Martins EF, Velásquez-Meléndez G. Determinantes da mortalidade neonatal a partir de uma coorte de nascidos vivos, Montes Claros, Minas Gerais, 1997 – 1999. Rev Bras Saude Mater Infant. 2004;4(4):405-512. DOI:10.1590/S1519-38292004000400010. 15. Matteson DW, Burr JA, Marshall JR. Infant mortality: a
multi-level analysis of individual and community risk factors. Soc Sci Med. 1998;47(11):1841-54.
16. Morais Neto OL, Barros MBA. Fatores de risco para mortalidade neonatal e pós-neonatal na Região Centro-Oeste do Brasil: linkage entre bancos de dados de nascidos vivos e óbitos infantis. Cad Saude Publica. 2000;16(2):477-85. DOI: 10.1590/S0102-311X2000000200018
17. Mosley WH, Chen L. An analytical framework for the study of child survival in developing countries. Pop Develop Rev. 1984;10 Suppl:25-45.
18. Ribeiro AM, Guimarães MJ, Lima MC, Sarinho SW, Coutinho SB. Fatores de risco para mortalidade neonatal em crianças com baixo peso ao nascer. Rev Saude Publica. 2009;43(2):246-55. DOI:10.1590/ S0034-89102002000400014
19. Romero DE, Cunha CB. Avaliação da qualidade das variáveis epidemiológicas e demográfi cas do Sistema de Informações sobre Nascidos Vivos, 2002. Cad Saude Publica. 2007;23(3):701-14. DOI:10.1590/ S0102-311X2000000200018
20. Sampson RJ, Morenoff JD, Gannon-Rowley T. Assessing “neighbourhood effects”: social processes and new directions in research. Annu Rev Sociol. 2002; 28:443-78. DOI:10.1146/annurev.soc.28.110601
21. Santos TF, Moura FA. Os determinantes da mortalidade infantil no Nordeste: aplicação de modelos
hierárquicos. Bahia Analise Dados. 2001;10(4):122-28. 22. Sarinho SW, Filho DAM, Silva GAP, Lima MC. Fatores
de risco para óbitos neonatais no Recife: um estudo caso-controle. J Pediatr. 2001;77(4):294-8. DOI: 10.1590/S0021-75572001000400011
23. Sastry N. Family-level clustering of childhood mortality risk in Northeast Brazil. Popul Stud. 1997;51:245-61. 24. Silva CF, Leite AJM, Almeida NMGS, Gondim
RC. Fatores de risco para mortalidade infantil em município do Nordeste do Brasil: linkage entre bancos de dados de nascidos vivos e óbitos infantis – 2000 a 2002. Rev Bras Epidemiol. 2006;9(1):69-80. DOI:10.1590/S1415-790X2006000100009
25. Zupan J, Aahman E. Perinatal mortality for the year 2000: estimates developed by WHO. Geneva: World Health Organization; 2005.
REFERENCES