NHESSD
3, 1203–1230, 2015Size of wildfires in the
Euro-Mediterranean region
C. Hernandez et al.
Title Page
Abstract Introduction
Conclusions References
Tables Figures
◭ ◮
◭ ◮
Back Close
Full Screen / Esc
Printer-friendly Version Interactive Discussion
Discussion
P
a
per
|
Discussion
P
a
per
|
Discussion
P
a
per
|
Discussion
P
a
per
|
Nat. Hazards Earth Syst. Sci. Discuss., 3, 1203–1230, 2015 www.nat-hazards-earth-syst-sci-discuss.net/3/1203/2015/ doi:10.5194/nhessd-3-1203-2015
© Author(s) 2015. CC Attribution 3.0 License.
This discussion paper is/has been under review for the journal Natural Hazards and Earth System Sciences (NHESS). Please refer to the corresponding final paper in NHESS if available.
Size of wildfires in the
Euro-Mediterranean region: observations
and theoretical analysis
C. Hernandez1, P. Drobinski1, S. Turquety1, and J.-L. Dupuy2
1
Institut Pierre Simon Laplace/Laboraratoire de Météorologie Dynamique, CNRS/Ecole Polytechnique/Université Pierre et Marie Curie, Palaiseau, France
2
Unité de Recherches Ecologie des Forêts Méditerranéennes, INRA, Avignon, France
Received: 9 January 2015 – Accepted: 13 January 2015 – Published: 9 February 2015
Correspondence to: C. Hernandez ([email protected]) Published by Copernicus Publications on behalf of the European Geosciences Union.
NHESSD
3, 1203–1230, 2015Size of wildfires in the
Euro-Mediterranean region
C. Hernandez et al.
Title Page
Abstract Introduction
Conclusions References
Tables Figures
◭ ◮
◭ ◮
Back Close
Full Screen / Esc
Printer-friendly Version Interactive Discussion
Discussion
P
a
per
|
Discussion
P
a
per
|
Discussion
P
a
per
|
Discussion
P
a
per
|
Abstract
MODIS satellite observations of fire size and ERA-Interim meteorological reanalysis are used to derive a relationship between burnt area and wind speed over the Mediter-ranean region and Eastern Europe. As intuitively expected, the burnt area associated to the largest wildfires is an increasing function of wind speed in most situations. It is
al-5
ways the case in Eastern Europe. It is also the case in the Mediterranean for moderate temperature anomaly. In situations of severe heatwaves and droughts, the relationship between burnt area and wind speed displays bimodal shape. Burnt areas are large for
low 10 m wind speed (lower than 2 m s−1), decrease for moderate wind speed values
(lower than 5 m s−1 and larger than 2 m s−1) and increase again for large wind speed
10
(larger than 5 m s−1). To explain such behavior fire propagation is investigated using a probabilistic cellular automaton model. The observed relationship between burnt area and wind speed can be interpreted in terms of percolation threshold which mainly de-pends on local terrain slope and vegetation state (type, density, fuel moisture). In east-ern Europe, the percolation threshold is never exceeded for observed wind speeds.
15
In the Mediterranean Basin we see two behaviors. During moderately hot weather, the percolation threshold is passed when the wind grows strong. On the other hand, in situ-ations of severe Mediterranean heatwaves and droughts, moderate wind speed values impair the propagation of the wildfire against the wind and do not sufficiently accelerate the forward propagation to allow a growth of wildfire size.
20
1 Introduction
Large wildfires can have a significant impacts on natural, social and economic sys-tems. If most fires are extinguished in the initial stages and remain small, the largest forest fires events represent most of the area burned and can have catastrophic con-sequences. In the boreal areas, large wildfires have a significant impact on carbon
cy-25
NHESSD
3, 1203–1230, 2015Size of wildfires in the
Euro-Mediterranean region
C. Hernandez et al.
Title Page
Abstract Introduction
Conclusions References
Tables Figures
◭ ◮
◭ ◮
Back Close
Full Screen / Esc
Printer-friendly Version Interactive Discussion
Discussion
P
a
per
|
Discussion
P
a
per
|
Discussion
P
a
per
|
Discussion
P
a
per
|
(Thonicke et al., 2001) and the climate system (Randerson et al., 2006). The Mediter-ranean basin is also the major European region where wildfires occur, with about 90 % of the European burnt area (Chuvieco, 2009). Between 1980 and 2003, 57 % of the to-tal burnt area and 38 % of all ignited fires in Europe burned in Portugal (EFFIS, 2003). The year 2003 was one of the most severe years in Europe (Hernandez et al., 2015).
5
Nearly 800 000 ha were burnt across southern Europe and in Portugal 4218 km2were
burnt. A total of 20 864 wildfires were ignited that year for this country. Such wildfires have a low probability of occurrence and are high consequence events because they behave differently than the other smaller fires (Rothermel, 1991).Large wildfire occur-rence is also affected by special weather conditions which do not affect most of other
10
fires (Alvarado et al., 1998).
The propagation of these wildfires is impacted by various factors such as fuel mois-ture and load, human activities and short to long term weather (Flannigan et al., 2009). Wind speed is one of the main factors regarding the weather dependency, as it drives the rate of spread and direction of propagation (Rothermel, 1972). Fuel moisture is
15
also an important factor for the propagation of wildfires (Sharples, 2008). It depends on short (i.e. hour time scale) to medium (i.e. seasonal time scale) variability of tem-perature, precipitations and relative humidity.
The relationships between weather, vegetation and wildfire burnt area have been investigated in several works. Flannigan et al. (2001) link seasonal burnt area with
20
weather at various time and spatial scales (several years to a few days; global to local) and show that warm, dry and windy days are correlated to higher burnt area, and that certain synoptic conditions such as the breakdown of an upper blocking ridge leads to particularly favorable conditions for wildfires. Flannigan and Harrington (1988) show the weather dependency of monthly burnt area with long sequences of dry and low
25
precipitations days. These relationships have been extrapolated for forecasting future wildfire severity in a changing climate. The review by Flannigan et al. (2009) indicates with a high confidence that climate change should lead a positive trend of burnt area. This is already measurable in the western US, as suggested by Westerling et al. (2006)
NHESSD
3, 1203–1230, 2015Size of wildfires in the
Euro-Mediterranean region
C. Hernandez et al.
Title Page
Abstract Introduction
Conclusions References
Tables Figures
◭ ◮
◭ ◮
Back Close
Full Screen / Esc
Printer-friendly Version Interactive Discussion
Discussion
P
a
per
|
Discussion
P
a
per
|
Discussion
P
a
per
|
Discussion
P
a
per
|
and Running (2006). Increase in the fire season duration, higher summer temperature, earlier melting of snowpacks and expansion of the areas susceptible to wildfires to elevated forests combine their effects, leading in this region to higher seasonal burnt area since the mid 1980s.
In order to further these studies, our aim is to analyze the role of short and mid-term
5
weather on the burnt area in the Euro-Mediterranean region, characterized by a vari-ety of land-uses (natural forests, chaparral, agricultural fields), high exposure to heat waves (Stéfanon et al., 2012) and a high wildfire activity. Wildfires in the Mediterranean region tend to be generally caused by accidents (Silva et al., 2010) and in eastern Eu-rope they are mostly linked to agricultural practices (Turquety et al., 2014). Here we
10
will not study the causes of wildfire activity but the dependency between fire size and weather, in particular wind speed and temperature anomaly. To complete our goal, we need a comprehensive database of recent wildfires that occurred in this region and the accompanying weather. The availability of remote sensing observations since the 1990s allows the analysis of large, consistent datasets on wildfire activity. In this study
15
we use the MODIS-retrieved burnt area with the ERA-Interim meteorology to analyze the dependency of fire size with wind speed and temperature anomaly. In order to bet-ter understand the variations seen in the observations we need to use a model of fire spread. In this study we choose to focus on probabilistic cellular automata (PCA). Our study relies on the following data-driven observation: under certain circumstances
wild-20
fires tend to decrease in size with small wind speed. In order to investigate this assess-ment we will perform a theoretical study of percolation threshold in PCA with varying wind speed using the modelling framework shown on Alexandridis et al. (2008). The robustness of the study with respect to the model parameters will be tested.
After the introduction in Sect. 1, Sect. 2 details the data source, the methodology of
25
NHESSD
3, 1203–1230, 2015Size of wildfires in the
Euro-Mediterranean region
C. Hernandez et al.
Title Page
Abstract Introduction
Conclusions References
Tables Figures
◭ ◮
◭ ◮
Back Close
Full Screen / Esc
Printer-friendly Version Interactive Discussion
Discussion
P
a
per
|
Discussion
P
a
per
|
Discussion
P
a
per
|
Discussion
P
a
per
|
in-depth discussion of the processes explaining the relationship between the wildfire burnt area and the weather. Section 5 concludes the study.
2 Wildfire burnt area observations: methodology and analysis
2.1 Data source
Meteorological data are the 10 m wind speed and 2 m air temperature from the
5
ERA-Interim reanalysis of the European Center for Mean-Range Weather Forecast (ECMWF), which provides data from 1979 onwards, and continues in real time (Sim-mons et al., 2006; Dee et al., 2011). The data are available every 6 h at a 0.75◦×0.75◦ longitude/latitude resolution. In the present study, the 12:00 UTC data are used only.
Wildfire burnt areas result from the fire detection based on the observations from
10
the MODIS instrument (Moderate Resolution Imaging Spectroradiometer) on board of Aqua and Terra polar heliosynchronous orbiting satellites. Daily burnt areas are identi-fied when land cover, and thus surface reflectance, changes drastically and rapidly due to the wildfires (Roy et al., 2008). In the present study, the MCD45 burnt area prod-uct is used over a period of 10 years (2003–2012) and provides the daily burnt area
15
on a 500 m horizontal grid. Only the fraction of each grid cell covered by vegetation is allowed to burn, following Turquety et al. (2014).
2.2 Data processing
A regridded version at 10 km resolution of the MCD45 product is used. A 3-D (latitude, longitude and time) connected component algorithm is applied to extract distinct fire
20
events. Two fire detections on 26-adjacent 3-D grid meshes are considered to be part of the same event. The principal strength of this method is that it allows the detection of wildfires extending over more than 10 000 ha, since adjacent burning cells are con-nected. This is of particular importance since only large wildfires are investigated in the present study. Its main weakness is that it does not take into account cloud cover
25
NHESSD
3, 1203–1230, 2015Size of wildfires in the
Euro-Mediterranean region
C. Hernandez et al.
Title Page
Abstract Introduction
Conclusions References
Tables Figures
◭ ◮
◭ ◮
Back Close
Full Screen / Esc
Printer-friendly Version Interactive Discussion
Discussion
P
a
per
|
Discussion
P
a
per
|
Discussion
P
a
per
|
Discussion
P
a
per
|
impairment of remote sensing. Another problem is that two independent fire event oc-curring close to one another (less than 20 km of distance and less than a day between the end of the first event and the beginning of the second) are considered the same with this method.
2.3 Data analysis
5
Figure 1 shows the cumulated wildfire burnt areas as retrieved by MODIS over the 10 year period (2003–2012). If a grid point has burnt entirely during this 10 year period, the cumulated burnt area is 10 000 ha. We see that the most wildfire-prone regions are the Mediterranean Basin and central eastern Europe. Wildfires in the Mediterranean area are mainly caused by accidents or criminal behavior (Silva et al., 2010), whereas
10
in eastern Europe wildfires are generally linked to agricultural practices. In the following,
we differentiate the two regions and the Mediterranean Basin will be referred as MED,
whereas central eastern Europe will be referred as EAST.
In the following, large wildfires are considered as extreme fires and are identified when the value of the burnt area exceeds the upper 95th quantile of the local
prob-15
ability density function. Figure 2 shows the dependence of the 95th quantile of burnt area to the 10 m wind speed for an anomaly of the 2 m air temperature with respect to the climatology (1979–2012) (∆T2) smaller than 3◦C and exceeding 3◦C (heatwave). Large temperature anomalies are generally associated with an anticyclonic anomaly, persisting heat waves (Black et al., 2004; Cassou et al., 2005; Barriopedro et al., 2011;
20
Stéfanon et al., 2012) and larger burnt area (Pereira et al., 2005). In the EAST domain, wildfire size is nearly independent of the wind speed for∆T2<3 K and slightly increase with wind speed for∆T2>3 K. In the MED domain, a totally different behavior is found. For∆T2< 3 K, wildfire burnt areas increase with wind speed, similarly to what is found in the EAST domain for larger temperature anomalies. For∆T2>3 K, a bimodal
depen-25
NHESSD
3, 1203–1230, 2015Size of wildfires in the
Euro-Mediterranean region
C. Hernandez et al.
Title Page
Abstract Introduction
Conclusions References
Tables Figures
◭ ◮
◭ ◮
Back Close
Full Screen / Esc
Printer-friendly Version Interactive Discussion
Discussion
P
a
per
|
Discussion
P
a
per
|
Discussion
P
a
per
|
Discussion
P
a
per
|
For robustness assessment, the dependence of the wildfire burnt areas to the wind speed has also been checked for the MED domain using the European Forest Fire Information System (EFFIS) dataset over the 2006–2012 period (San-Miguel-Ayanz et al., 2012; the EAST domain is not covered by the EFFIS dataset). A similar behavior has been found, consistent with the MODIS products, for both low and high temperature
5
anomalies (not shown). The bimodal dependence of wildfire burnt areas to wind speed in the MED region for situations associated with heatwaves is counter-intuitive since the rate of spread is a growing function of wind speed (Rothermel, 1972). Indeed, the main reason is that those models give the rate of spread as a function of wind and other parameters (such as slope and vegetation state) but do not derive total burnt areas. To
10
understand these observations, a probabilistic cellular automaton model is adapted in Sect. 3 to include the impact of wind speed on fire propagation and derive the burnt area.
3 Wildfire burnt area simulations: sensitivity to wind speed
3.1 Probabilistic cellular automaton
15
Several types of fire models exist. One of them is the probabilistic cellular automaton (PCA), which relies on a stochastic fire propagation set by a probability of propaga-tion which depends on wind speed and direcpropaga-tion, terrain slope and vegetapropaga-tion state. Despite its simplicity, such model presents enough similarities with fire propagation dynamics to ensure accurate verification against observations and to allow in-depth
20
analysis of fire propagation dynamics for a moderate computational cost (Berjak and Hearne, 2002; Trunfio, 2004; Hernández-Encinas, 2007a, b; Alexandridis et al., 2008). Unlike coupled fire-atmosphere models such as FIRETEC (Linn et al., 2002), the PCA model does not rely on physical processes that govern the fire behavior. However its simple implementation allows easier theoretical analysis.
25
NHESSD
3, 1203–1230, 2015Size of wildfires in the
Euro-Mediterranean region
C. Hernandez et al.
Title Page
Abstract Introduction
Conclusions References
Tables Figures
◭ ◮
◭ ◮
Back Close
Full Screen / Esc
Printer-friendly Version Interactive Discussion
Discussion
P
a
per
|
Discussion
P
a
per
|
Discussion
P
a
per
|
Discussion
P
a
per
|
The PCA implements a grid of cells that can be in a finite number of states and a local rule that determines the probability of transition between states at each time step. In our case we use the most elementary form of PCA for fire simulation, taking into account only the effect of wind speed on fire spread. The grid is a regular square lattice of cells and we choose 3 different states for the cells.
5
– State 0 corresponds to an unburnt cell;
– State 1 corresponds to the situation of a burning cell. The cells in this state can
propagate the fire;
– State 2 corresponds to the situation of an already burnt cell.
The probability that a cell in state 1 can spread the fire to its neighbors is defined by
10
Eq. (1):
p=min (γp0f(V,θ) , 1) (1)
withV the surface wind speed,θthe angle between the direction of propagation and
the wind andγ a corrective factor for diagonal spread. The quantity p0 is a constant
and is the spreading probability in absence of wind. The functionf of wind is defined
15
in Alexandridis et al. (2008) as:
f(V,θ)=exp [V (c1+c2(cosθ−1))] . (2)
The quantities c1 and c2 are empirical factors set respectively to 0.045 s m−1 and
0.131 s m−1 (Alexandridis et al., 2008). The shape of f(V,θ) is shown in Fig. 3 for
various values of wind speed. Functionf is isotropic with zero wind and gradually
ex-20
pands in the direction of the wind. The corrective factorγ is set at √1
2 such as the fire
NHESSD
3, 1203–1230, 2015Size of wildfires in the
Euro-Mediterranean region
C. Hernandez et al.
Title Page
Abstract Introduction
Conclusions References
Tables Figures
◭ ◮
◭ ◮
Back Close
Full Screen / Esc
Printer-friendly Version Interactive Discussion
Discussion
P
a
per
|
Discussion
P
a
per
|
Discussion
P
a
per
|
Discussion
P
a
per
|
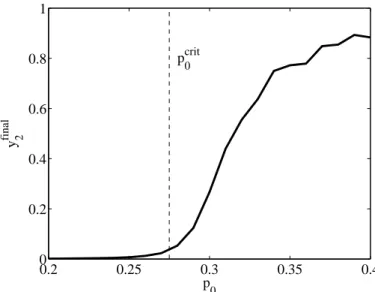
Figure 4 shows the fraction of burnt cellsy2final– with yi the fraction of cells in state
i in the PCA grid – as a function of p0 when the fire is extinct in a grid constituted of 101×101 cells. The quantityy2finalis computed from a Monte Carlo simulation. Figure 4 displays a transition atp0∼0.3 between a mode where very few cells are burnt (y2final∼
0) and another one where the fire spreads to nearly all the grid (y2final∼0.9).
5
3.2 Percolation threshold analysis
Above a certain value of the propagation probabilitypthe fire can thus propagate indef-initely in the PCA. The critical valuepcrit0 of thep0constant is shown in Fig. 4 for the zero wind case. This phenomenon is called percolation and can be analyzed theoretically. Pak and Hayakawa (2011) studied the percolation threshold for an elementary form of
10
PCA, with no diagonal propagation or wind speed effect. They state with the help of
a mean-field approximation that the fraction of cells in states 1 and 2 are governed by Eqs. (3)–(5).
dy1
dt =4py1y0−a12y1 (3)
dy2
dt =a12y1 (4)
15
y0+y1+y2=1 (5)
with yi the fraction of cells in state i in the PCA grid, p the probability of fire spread anda12the probability that a cell in state 1 at timetgoes to state 2 at timet+1. In our
case, the quantitya12 is set to 1. In the study, we adapt the PCA model to account for
wind speed effect and diagonal propagation. Equation (3) is thus modified as follows:
20
dy1
dt =C(V)p0y1y0−y1 (6)
NHESSD
3, 1203–1230, 2015Size of wildfires in the
Euro-Mediterranean region
C. Hernandez et al.
Title Page
Abstract Introduction
Conclusions References
Tables Figures
◭ ◮
◭ ◮
Back Close
Full Screen / Esc
Printer-friendly Version Interactive Discussion
Discussion
P
a
per
|
Discussion
P
a
per
|
Discussion
P
a
per
|
Discussion
P
a
per
|
withC(V) a weighting coefficient which allows to account for fire spreading in various directions as a function of the wind speed. It writes:
C(V)=exp (V c1)+2 exp [V (c1−c2)]+exp [V(c1−2c2)]
+2γexp
( V
"
c1+c2
√ 2
2 −1
!#)
+2γexp
( V
"
c1−c2
√ 2
2 +1
!#)
. (7)
5
The first term of the sum on the right-hand-side of Eq. (7) corresponds to a propagation along the wind direction, the second term to a propagation across the wind direction and the third to a propagation against the wind. The other terms correspond to diagonal propagation (√2/2 corresponds to cos(π/4)). The details of the derivation of Eq. (7) is provided in the Appendix. Equation (7) can be simplified:
10
C(V)=exp (V c1)×
(
[1+exp (−V c2)]2
+p2 exp
" V c2
√ 2
2 −1
!#
+exp
"
−V c2
√ 2
2 +1
!#!)
. (8)
Following the methodology of Pak and Hayakawa (2011), we derive a relationship betweenpcrit0 and the wind speed-dependent coefficientC(V):
pcrit0 =1.51552
C(V) . (9)
15
NHESSD
3, 1203–1230, 2015Size of wildfires in the
Euro-Mediterranean region
C. Hernandez et al.
Title Page
Abstract Introduction
Conclusions References
Tables Figures
◭ ◮
◭ ◮
Back Close
Full Screen / Esc
Printer-friendly Version Interactive Discussion
Discussion
P
a
per
|
Discussion
P
a
per
|
Discussion
P
a
per
|
Discussion
P
a
per
|
equation is plotted in Fig. 5, along with the numerically derivedpcrit0 . To compute this quantity numerically we consider that percolation occurs when a fire initiated in the
middle of our 101×101 PCA grid, reaches the edges of the domain. The p0value
in-creases from 0.2 with 0.001 increments. The critical valuep0=pcrit0 is set when more than 90 % of a 300 simulation ensemble percolate. We can see that both the theoretical
5
and computed valuespcrit0 increase with wind speed for low wind values, reach a
max-imum and then decrease with wind speed. The difference between the theoretical and
computed curves is methodology of derivation ofpcrit0 . The shape of this curve will be essential in the analysis of our observations in Sect. 2.
In the following, we refer topcrit0,0 as the value in the absence of wind andpcrit0,max as
10
the maximum value reached bypcrit0 .
4 Discussion
The PCA gives us a theoretical framework to understand the results of Fig. 2. The mean fire size of the biggest wildfires (above the 95th quantile) is a growing function of wind speed in most cases, excepted in the Mediterranean Basin for large temperature
15
anomalies. The dependence of wildfire burnt area to the temperature anomaly and soil moisture anomaly (not shown) can be inferred theoretically by the fact that is a function of vegetation and fuel moisture. It is also dependent of the slope of the local topography but this has no consequence on the observed behavior of the burnt area. A proposed expression ofp0is described in Alexandridis et al. (2008):
20
p0=ph(1+pden)(1+pveg)ps(θs) (10)
where ph is a constant used for homogeneous fuel beds, pden and pveg are factors
depending on vegetation density and type, respectively. The quantity θs is the local
slope in degrees and the expression ofps(θs) is given by:
ps(θs)=exp(aθs). (11)
25
NHESSD
3, 1203–1230, 2015Size of wildfires in the
Euro-Mediterranean region
C. Hernandez et al.
Title Page
Abstract Introduction
Conclusions References
Tables Figures
◭ ◮
◭ ◮
Back Close
Full Screen / Esc
Printer-friendly Version Interactive Discussion
Discussion
P
a
per
|
Discussion
P
a
per
|
Discussion
P
a
per
|
Discussion
P
a
per
|
This formulation is very simple and other factors such as fuel moisture could be taken into account for more realistic simulations. We do not consider the effect of slope in this
study. It may be a differentiating factor between EAST and MED, which could lead to
quantitative differences between fire sizes in the two regions but for a given region the slope value is the same whatever the wind speed, vegetation state or temperature and
5
soil moisture anomaly. The main cause for such behavioral differences is the value of
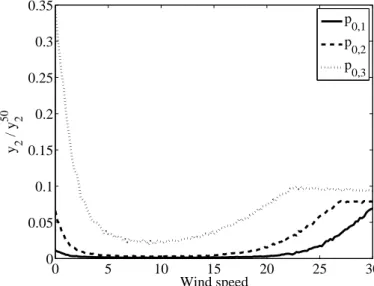
p0 relative topcrit0 . The final burnt area can vary drastically because of percolation as seen in Fig. 4. Figure 6 displays the fraction of burnt cells (normalized to its value after
50 time steps in the absence of wind speed and forp=1, see Fig. 6) as a function of
wind speed for 3 different values ofp0. Threep0values are chosen in the 3 different
10
domains:p0,1set at 0.26, below the 0 wind percolation threshold, p0,2=0.3 between
pcrit0,0andpcrit0,maxandp0,3=0.35 above the maximum of the percolation threshold (Figs. 5 and 6).
The saturation for strong winds visible is due to the fact that p=1 in the direction of the wind so the fire reaches the edge of the simulation domain and the fraction of
15
burnt cells saturates. Forp0 values smaller than pcrit0,0, percolation is only possible for high winds so the burnt area increases with wind speed similarly to what is observed
over the EAST domain and over the MED domain for low temperature anomaly (∆T2<
3◦C). For intermediatep0values ranging betweenpcrit0,0andpcrit0,max, large burnt area are simulated for low wind values (smaller than about 5 m s−1) and large wind speed values
20
(larger than about 15 m s−1) (Fig. 6). Conversely, smaller burnt area are simulated for
intermediate wind ranging between 5 and 15 m s−1 (Fig. 6). Forp0 values larger than
pcrit0,max, similar qualitative results are obtained with however larger burnt area.
We can therefore analyze Fig. 2 as if to each subfigure corresponds a value ofp0.
The value ofp0 corresponding to the EAST domain and MED domain for low
temper-25
NHESSD
3, 1203–1230, 2015Size of wildfires in the
Euro-Mediterranean region
C. Hernandez et al.
Title Page
Abstract Introduction
Conclusions References
Tables Figures
◭ ◮
◭ ◮
Back Close
Full Screen / Esc
Printer-friendly Version Interactive Discussion
Discussion
P
a
per
|
Discussion
P
a
per
|
Discussion
P
a
per
|
Discussion
P
a
per
|
farther below pcrit0,0 than over the MED domain. It may also explain why a change of
propagation regime is observed over the MED domain when shifting from low to high temperature anomalies. Indeed, for large temperature anomalies corresponding to se-vere droughts associated with heatwaves (∆T2>3◦C) over the MED domain, a value
of p0 exceeding pcrit0,0 is expected. A simple way to understand such behavior is to
5
consider the probability of extinction of a fire occupying one cell. Letp be the spread
probability. The cell has 8 neighbors on a square grid. In the absence of wind, the extinction probability is (1−p)8. When wind blows, the fire spreads in the direction of the wind and diagonally. The probability of extinction becomes (1−p)3. Let us consider
very weak wind speed values for which isotropic spreading can be assumed and p
10
increases with wind speed. Then the extinction probability (1−p)8 drops very quickly. When isotropic spreading does not stand anymore, then the probability of extinction
transitions to (1−p)3 and increases as 3 is a lower exponent than for the isotropic
spreading. With increasing wind speed, the probability of extinction decreases again. So instead of enhancing wildfire propagation, moderate winds produce smaller wildfires
15
by cutting offthe propagation against the wind. Such analysis explains the 2 modes ob-served in the MODIS and EFFIS data over the MED domain.
The function of windf(V,θ) in the calculation ofpis critical in the explanation of the observed behavior (see Eq. 9). The choice of this function by Alexandridis et al. (2008) was done empirically to match with the behavior of the rate of spread of real wildfires
20
as a function of the wind and the angle between the wind direction and the direction of propagation. Its shape is coherent with real wildfire propagation but concerns can be raised (Fig. 3). The backpropagation is very small and the overall shape is non-elliptical. This last point could be due to the indirect impact of factors that alter the normally elliptical shape of small wildfires, such as the small variations in wind direction
25
that make the wildfire slightly conical. Despite such concerns, this function has been
efficient in the simulation with PCA of the 1990 burnt scar in the Spetses island and
thus does fairly well for burnt scar modeling purposes.
NHESSD
3, 1203–1230, 2015Size of wildfires in the
Euro-Mediterranean region
C. Hernandez et al.
Title Page
Abstract Introduction
Conclusions References
Tables Figures
◭ ◮
◭ ◮
Back Close
Full Screen / Esc
Printer-friendly Version Interactive Discussion
Discussion
P
a
per
|
Discussion
P
a
per
|
Discussion
P
a
per
|
Discussion
P
a
per
|
Another concern is that the propagation speed in the direction of the wind tends to grow very quickly with the wind speed. With the expression off(V,θ) used in this study, the propagation speed only becomes very high when the wind speed exceeds
15 m s−1 which is much too high compared to observed wildfires. Tests have been
performed by using other expressions off(V,θ), such as the elliptical form and varying
5
thec1andc2coefficients of Eq. (2), and no qualitative difference in the behavior ofpcrit0
has been evidenced (not shown). In detail, the choice ofc1andc2coefficients can be questioned, as it was only validated on one case study. A key issue is to know ifpcrit0,maxis reached for a positive value of the wind speed, which conditions the existence of the “2 modes” regime. Figure 7 shows the value of the ratiopcrit0,max−pcrit0,0/pcrit0,0as a function
10
ofc1 and c2 calculated from Eq. (9). For a value of c2 larger than about 1.25c1 this property is verified. This condition can be interpreted as the backpropagation of the wildfire being impaired in a sufficiently large angle domain by the wind.
A possible reason for the burnt area to decrease with wind speed for moderate wind speed over the MED domain is that in order to reach ap0value larger thanpcrit0,0, higher
15
flammability of the fuel bed or a more fire-prone environment are needed. This could be caused by the severe heatwaves and droughts regularly occurring in the MED region, which would lead to lower fuel moisture. This could also be due to different vegetation type between the EAST and MED regions.
5 Conclusions
20
The behavior of the burnt area with temperature anomaly and wind speed was ana-lyzed with the help of MODIS observations and ERA-Interim reanalysis. In the EAST region and in MED for low temperature anomalies, the burnt area is a growing function of wind, which is rather intuitive. For large temperature anomalies in the MED region,
corresponding to severe heatwaves and droughts, the burnt area behaves differently.
25
NHESSD
3, 1203–1230, 2015Size of wildfires in the
Euro-Mediterranean region
C. Hernandez et al.
Title Page
Abstract Introduction
Conclusions References
Tables Figures
◭ ◮
◭ ◮
Back Close
Full Screen / Esc
Printer-friendly Version Interactive Discussion
Discussion
P
a
per
|
Discussion
P
a
per
|
Discussion
P
a
per
|
Discussion
P
a
per
|
of the wind speed. The possible cause of such counter-intuitive behavior has been in-vestigated theoretically by means of probabilistic cellular automata (PCA). It was found that when the wind speed is moderate, the backpropagation is impaired when the for-ward propagation is not sufficiently fast to compensate the loss in burnt area. Therefore if the wind is not strong enough to make the propagation along the wind direction “sure
5
enough”, percolation happens in the PCA resulting in smaller wildfires. The percolation threshold is never reached in the EAST region. It is only exceeded for moderate wind speed in the MED region. Such shift between 2 regimes of propagation may be caused by the favorable occurrence of severe heatwaves and droughts in the MED region.
A natural follow-up of this study would be to model the impact of fuel moisture on
10
the propagation probability by adapting the known variations of the rate of spread of the fire with this quantity (Sharples, 2008). It could be complemented by a thorough analysis of the behavior of dead and live fuel moisture in Mediterranean ecosystems with respect to air temperature anomaly and the incorporation of such relation in the expression of the probability of fire propagation. However, fuel moisture is a quantity
15
which is hard to assess. Live fuel moisture depends on the plant species and dead fuel moisture on the size of the fuel particle. Finally, for a more holistic approach, a more realistic fire propagation modelling framework such as FIRETEC would be needed to better identify and quantify the processes driving fire propagation.
Appendix A
20
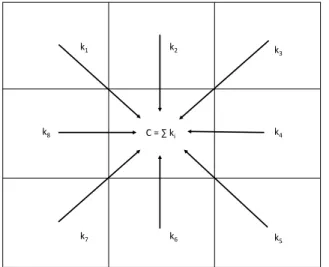
In this Appendix, the calculation of C(V) is detailed. The quantity C(V) corresponds to the sum of the probabilities that the fire propagates from a neighboring cell to the center cell (Fig. 8).
For all 8 neighbors we can write:
pi =kip0 (A1)
25
NHESSD
3, 1203–1230, 2015Size of wildfires in the
Euro-Mediterranean region
C. Hernandez et al.
Title Page
Abstract Introduction
Conclusions References
Tables Figures
◭ ◮
◭ ◮
Back Close
Full Screen / Esc
Printer-friendly Version Interactive Discussion
Discussion
P
a
per
|
Discussion
P
a
per
|
Discussion
P
a
per
|
Discussion
P
a
per
|
withki being a coefficient depending on the direction of propagation. One can write
ki=γexp{V[c1+c2(cosθi−1)]} (A2)
withθi being the angle between the direction of propagation and the direction of the
wind for thei component. One can write:
k1=k7=γexpnV hc1−c21−p2/2io (A3)
5
k2=k6=exp [V (c1−c2)] (A4)
k3=k5=γexp n
V hc1−c2
1+p2/2io (A5)
k4=exp [V(c1−2c2)] (A6)
k8=exp (V c1) . (A7)
The quantityC(V) is the sum of theki coefficients and thus writes:
10
C(V)=exp (V c1)+2 exp [V (c1−c2)]+exp [V(c1−2c2)]
+2γexp
( V
"
c1+c2
√ 2
2 −1
!#)
+2γexp
( V
"
c1−c2
√ 2
2 +1
!#)
(A8)
which can be simplified into:
C(V)=exp (V c1)×
(
[1+exp (−V c2)]2
15
+p2 exp
" V c2
√ 2
2 −1
!#
+exp
"
−V c2
√ 2
2 +1
!#!)
NHESSD
3, 1203–1230, 2015Size of wildfires in the
Euro-Mediterranean region
C. Hernandez et al.
Title Page
Abstract Introduction
Conclusions References
Tables Figures
◭ ◮
◭ ◮
Back Close
Full Screen / Esc
Printer-friendly Version Interactive Discussion
Discussion
P
a
per
|
Discussion
P
a
per
|
Discussion
P
a
per
|
Discussion
P
a
per
|
Acknowledgements. This work contributes to the HyMeX program (HYdrological cycle in The Mediterranean EXperiment; Drobinski et al., 2014) through INSU-MISTRALS support and the GEWEX hydroclimate panel of the World Climate Research Program (WCRP).
References
Alexandridis, A., Vakalis, D., Siettos, C. I., and Bafas, G. V.: A cellular automata model for forest
5
fire spread prediction: the case of the wildfire that swept through spetses island in 1990, Appl. Math. Comput., 204, 191–201, 2008.
Alvarado, E., Sandberg, D. V., and Pickford, S. G.: Modelling large forest fires as extreme events Northwest, Science, 72, 66–75, 2008.
Amiro, B. D., Todd, J. B., Wotton, B. M., Logan, K. A., Flannigan, M. D., Stocks, B. J., Mason,
10
J. A., Martell, D. L., and Hirsch, K. G.: Direct carbon emissions from Canadian forest fires, 1959 to 1999, Can. J. Forest Res., 31, 512–525, 2001.
Balshi, M. S., McGuire, A. D., Zhuang, Q., Melillo, J., Kicklighter, D. W., Kasischke, E., Wirth, C., Flannigan, M., Harden, J., Clein, J. S., Burnside, T. J., McAllister, J., Kurz, W. A., Apps, M., and Shvidenko, A.: The role of historical fire disturbance in the carbon
dynam-15
ics of the pan-boreal region: a process-based analysis, J. Geophys. Res., 112, G02029, doi:10.1029/2006JG000380 2007.
Barriopedro, D., Fischer, E. M., Luterbacher, J., Trigo, R. M., and Garcia-Herrera, R.: The hot summer of 2010: redrawing the temperature record map of Europe, Science, 332, 220–224, 2011.
20
Berjak, S. G. and Hearne, J. W.: An improved cellular automaton model for simulating fire in a spatially heterogeneous savanna system, Ecol. Model., 148, 133–151, 2002.
Black, E., Blackburn, M., Harrison, G., Hoskins, B., and Methven, J.: Factors contributing to the summer 2003, Eur. Heatwave Weather, 59, 218–223, 2004.
Cassou, C., Terray, L., and Phillips, A. S.: Tropical Atlantic influence on European heatwaves, J.
25
Climate, 18, 2805–2811, 2005.
Chuvieco, E.: Earth Observation of Wildland Fires in Mediterranean Ecosystems, Springer Ed., Dordrecht, the Netherlands, 251 pp., 2009.
Dee, D., Uppala, S., Simmons, A., Berrisford, P., Poli, P., Kobayashi, S., Andrae, U., Bal-maseda, M., Balsamo, G., Bauer, P., Bechtold, P., Beljaars, A. C. M., van de Berg, L.,
Bid-30
NHESSD
3, 1203–1230, 2015Size of wildfires in the
Euro-Mediterranean region
C. Hernandez et al.
Title Page
Abstract Introduction
Conclusions References
Tables Figures
◭ ◮
◭ ◮
Back Close
Full Screen / Esc
Printer-friendly Version Interactive Discussion
Discussion
P
a
per
|
Discussion
P
a
per
|
Discussion
P
a
per
|
Discussion
P
a
per
|
lot, J., Bormann, N., Delsol, C., Dragani, R., Fuentes, M., Geer, A. J., Haimberger, L., Healy, S. B., Hersbach, H., Hólm, E. V., Isaksen, L., Kållberg, P., Köhler, M., Matricardi, M., Mc-Nally, A. P., Monge-Sanz, B. M., Morcrette, J. J., Park, B. K., Peubey, C., de Rosnay, P., Tavolato, C., Thépaut, J. N., and Vitart, F.: The era-interim reanalysis: configuration and per-formance of the data assimilation system, Q. J. Roy. Meteorol. Soc., 137, 553–597, 2011.
5
Drobinski, P., Ducrocq, V., Alpert, P., Anagnostou, E., Béranger, K., Borga, M., Braud, I., Chanzy, A., Davolio, S., Delrieu, G., Estournel, C., Filali Boubrahmi, N., Font, J., Grubisic, V., Gualdi, S., Homar, V., Ivancan-Picek, B., Kottmeier, C., Kotroni, V., Lagouvardos, K., Li-onello, P., Llasat, M. C., Ludwig, W., Lutoff, C., Mariotti, A., Richard, E., Romero, R., Ro-tunno, R., Roussot, O., Ruin, I., Somot, S., Taupier-Letage, I., Tintore, J., Uijlenhoet, R.,
10
Wernli, H.: HyMeX, a 10 year multidisciplinary program on the Mediterranean water cycle, B. Am. Meteorol. Soc., 95, 1063–1082, 2014.
EFFIS: Forest Fires in Europe – 2003 Fire Campaign, available at: http://forest.jrc.ec.europa. eu/effis/reports/annual-fire-reports/ (last access: January 2015), 2003.
Flannigan, M. and Harrington, J.: A study of the relation of meteorological variables to monthly
15
provincial area burned by wildfire in Canada (1953–80), J. Appl. Meteorol., 27, 441–452, 1988.
Flannigan, M. and Wotton, B.: Climate, Weather, and Area Burned, Forest Fires, Academic Press, New York, p. 351, 2001.
Flannigan, M. D., Krawchuk, M. A., de Groot, W. J., Wotton, B. M., and Gowman, L. M.:
Impli-20
cations of changing climate for global wildland fire, Int. J. Wildland Fire, 18, 483–507, 2009. Hernández-Encinas, A., Hernández Encinas, L., Hoya White, S., Martín del Rey, A., and
Ro-dríguez Sánchez, G.: Simulation of forest fire fronts using cellular automata, Adv. Eng. Softw., 38, 372–378, 2007a.
Hernández-Encinas, L., Hoya White, S., Martín del Rey, A., and Rodríguez Sánchez, G.:
Mod-25
elling forest fire spread using hexagonal cellular automata, Appl. Math. Model., 31, 1213– 1227, 2007b.
Hernandez, C., Drobinski, P., and Turquety, S.: Impact of wildfire-induced land cover modifica-tion on local meteorology: a sensitivity study of the 2003 wildfires in Portugal, Atmos. Res., submitted, 2015.
30
NHESSD
3, 1203–1230, 2015Size of wildfires in the
Euro-Mediterranean region
C. Hernandez et al.
Title Page
Abstract Introduction
Conclusions References
Tables Figures
◭ ◮
◭ ◮
Back Close
Full Screen / Esc
Printer-friendly Version Interactive Discussion
Discussion
P
a
per
|
Discussion
P
a
per
|
Discussion
P
a
per
|
Discussion
P
a
per
|
Pak, S. I. and Hayakawa, T.: Forest fire modeling using cellular automata and percolation threshold analysis, in: American Control Conference (ACC), IEEE, San Francisco, Califor-nia, USA, 293–298, 2011.
Pereira, M. G., Trigo, R. M., da Camara, C. C., Pereira, J., and Leite, S. M.: Synoptic patterns associated with large summer forest fires in Portugal, Agr. Forest Meteorol., 129, 11–25,
5
2005.
Randerson, J. T., Liu, H., Flanner, M. G., Chambers, S. D., Jin, Y., Hess, P. G., Pfister, G., Mack, M. C., Treseder, K. K., Welp, L. R., Chapin, F. S., Harden, J. W., Goulden, M. L., Lyons, E., Neff, J. C., Schuur, E. A. G., and Zender, C. S.: The impact of boreal forest fire on climate warming, Science, 314, 1130–1132, 2006.
10
Rothermel, R. C.: A mathematical model for predicting fire spread in wildland fuels, USDA Forest Service Res. Pap. INT-115, US Department of Agriculture, Intermountain Forest and Range Experiment Station, Ogden, UT, 1972.
Rothermel, R. C.: Predicting behavior of the 1988 Yellowstone fires: projections versus reality, Int. J. Wildland Fire, 1, 1–10, 1991.
15
Roy, D. P., Boschetti, L., Justice, C. O., and Ju, J.: The collection 5 MODIS burned area product Global evaluation by comparison with the MODIS active fire product, Remote Sens. Environ., 112, 3690–3707, 2008.
Running, S. W.: Is global warming causing more, larger wildfires?, Science, 313, 927–928, 2006.
20
San-Miguel-Ayanz, J., Schulte, E., Schmuck, G., Camia, A., Strobl, P., Liberta, G., Giovando, C., Boca, R., Sedano, F., Kempeneers, P., McInerney, D., Withmore, C., Santos de Oliveira, S., Rodrigues, M., Durrant, T., Corti, P., Oehler, F., Vilar, L., and Amatulli, G.: Comprehensive monitoring of wildfires in Europe: the European Forest Fire Information System (EFFIS) in: Approaches to Managing Disaster – Assessing Hazards, Emergencies and Disaster Impacts,
25
Chapter 5, edited by: Tiefenbacher, J., InTech Publisher, 87–108, doi:10.5772/28441, 2012. Sharples, J.: Review of formal methodologies for wind-slope correction of wildfire rate of spread,
Int. J. Wildland Fire, 17, 179–193, 2008.
Silva, J. S., Rego, F., Fernandes, P., and Rigolot, E.: Towards integrated fire management: outcomes of the European project Fire Paradox, European Forest Institute Research Report,
30
p. 23, 2010.
Simmons, A., Uppala, S., Dee, D., and Kobayashi, S.: ERA-interim: new ECMWF reanalysis products from 1989 onwards, ECMWF Newslett., 110, 25–35, 2006.
NHESSD
3, 1203–1230, 2015Size of wildfires in the
Euro-Mediterranean region
C. Hernandez et al.
Title Page
Abstract Introduction
Conclusions References
Tables Figures
◭ ◮
◭ ◮
Back Close
Full Screen / Esc
Printer-friendly Version Interactive Discussion
Discussion
P
a
per
|
Discussion
P
a
per
|
Discussion
P
a
per
|
Discussion
P
a
per
|
Stéfanon, M., D’Andrea, F., and Drobinski, P.: Heatwave classification over Europe and the Mediterranean region, Environ. Res. Lett., 7, 014023, doi:10.1088/1748-9326/7/1/014023 2012.
Thonicke, K., Venevsky, S., Sitch, S., and Cramer, W.: The role of fire disturbance for global vegetation dynamics: coupling fire into a dynamic global vegetation model, Global Ecol.
Bio-5
geogr., 10, 661–677, 2001.
Trunfio, G. A.: Predicting wildfire spreading through a hexagonal cellular automata model, in: Cellular Automata, Springer, Springer, Berlin, Heidelberg, 385–394, 2004.
Turquety, S., Menut, L., Bessagnet, B., Anav, A., Viovy, N., Maignan, F., and Wooster, M.: API-FLAME v1.0: high-resolution fire emission model and application to the Euro-Mediterranean
10
region, Geosci. Model Dev., 7, 587–612, doi:10.5194/gmd-7-587-2014, 2014.
Westerling, A. L., Hidalgo, H. G., Cayan, D. R., and Swetnam, T. W.: Warming and earlier spring increase western US forest wildfire activity, Science, 313, 940–943, 2006.
Zhuang, Q., McGuire, A. D., O’Neill, K. P., Harden, J. W., Romanovsky, V. E., and Yarie, J.: Modeling the soil thermal and carbon dynamics of a fire chronosequence in interior Alaska, J.
15
NHESSD
3, 1203–1230, 2015Size of wildfires in the
Euro-Mediterranean region
C. Hernandez et al.
Title Page
Abstract Introduction
Conclusions References
Tables Figures
◭ ◮
◭ ◮
Back Close
Full Screen / Esc
Printer-friendly Version Interactive Discussion
Discussion
P
a
per
|
Discussion
P
a
per
|
Discussion
P
a
per
|
Discussion
P
a
per
|
Figure 1.10 years cumulated burnt area (in ha) for each regridded fire product grid cell over the Euro-Mediterranean region (in colors). The Mediterranean domain (MED) and central eastern Europe domain (EAST) are identified by black boxes.
NHESSD
3, 1203–1230, 2015Size of wildfires in the
Euro-Mediterranean region
C. Hernandez et al.
Title Page
Abstract Introduction
Conclusions References
Tables Figures
◭ ◮
◭ ◮
Back Close
Full Screen / Esc
Printer-friendly Version Interactive Discussion
Discussion
P
a
per
|
Discussion
P
a
per
|
Discussion
P
a
per
|
Discussion
P
a
per
|
0 5 10
0 500 1000
∆ T
2 < 3 K
BA (ha)
(a)
Wind speed (m s−1)
0 5 10
0 500 1000
∆ T
2 > 3 K
(b)
Wind speed (m s−1)
0 5 10
0 2000 4000
BA (ha)
(c)
Wind speed (m s−1)
0 5 10
0 2000 4000
(d)
Wind speed (m s−1)
Figure 2. Wildfire burnt areas (BA) (i.e. 95th quantile of the probability density function) as a function of 10 m wind speed for the EAST (top row panels) and MED domains (bottom row panels) for∆T2<3◦C (left column panels) and∆T2>3◦C (right column panels). The black line
NHESSD
3, 1203–1230, 2015Size of wildfires in the
Euro-Mediterranean region
C. Hernandez et al.
Title Page
Abstract Introduction
Conclusions References
Tables Figures
◭ ◮
◭ ◮
Back Close
Full Screen / Esc
Printer-friendly Version Interactive Discussion
Discussion
P
a
per
|
Discussion
P
a
per
|
Discussion
P
a
per
|
Discussion
P
a
per
|
0 1 2 3
−1.5 −1 −0.5 0 0.5 1 1.5
Figure 3.Functionf(V,θ) for values of wind speedV equal to 0 (blue), 5 (green), 10 (red), 20 (cyan) and 30 m s−1(purple).
NHESSD
3, 1203–1230, 2015Size of wildfires in the
Euro-Mediterranean region
C. Hernandez et al.
Title Page
Abstract Introduction
Conclusions References
Tables Figures
◭ ◮
◭ ◮
Back Close
Full Screen / Esc
Printer-friendly Version Interactive Discussion
Discussion
P
a
per
|
Discussion
P
a
per
|
Discussion
P
a
per
|
Discussion
P
a
per
|
0.2 0.25 0.3 0.35 0.4
0 0.2 0.4 0.6 0.8 1
p
0 crit
p
0 y 2
final
NHESSD
3, 1203–1230, 2015Size of wildfires in the
Euro-Mediterranean region
C. Hernandez et al.
Title Page
Abstract Introduction
Conclusions References
Tables Figures
◭ ◮
◭ ◮
Back Close
Full Screen / Esc
Printer-friendly Version Interactive Discussion
Discussion
P
a
per
|
Discussion
P
a
per
|
Discussion
P
a
per
|
Discussion
P
a
per
|
0 5 10 15 20 25 30
0.2 0.25 0.3 0.35 0.4
Wind speed (m s−1) p0
crit
(a)
0 5 10 15 20 25 30
0.2 0.25 0.3 0.35 0.4
p0,1
p0,2 p0,3
Wind speed (m s−1)
(b)
Figure 5.pcrit0 as a function of wind. Dashed curve is the theoretical value found using mean-field approximation and the full curve is the numerically derived value. Dotted lines (p0,1), (p0,2) and (p0,3) correspond to the curves plotted in Fig. 6.
NHESSD
3, 1203–1230, 2015Size of wildfires in the
Euro-Mediterranean region
C. Hernandez et al.
Title Page
Abstract Introduction
Conclusions References
Tables Figures
◭ ◮
◭ ◮
Back Close
Full Screen / Esc
Printer-friendly Version Interactive Discussion
Discussion
P
a
per
|
Discussion
P
a
per
|
Discussion
P
a
per
|
Discussion
P
a
per
|
0 5 10 15 20 25 30
0 0.05 0.1 0.15 0.2 0.25 0.3 0.35
Wind speed y 2
/ y
2
50
p
0,1
p
0,2
p
0,3
Figure 6. Fraction of burnt cells y2/y 50
2 (normalized to its value after 50 time steps in the
NHESSD
3, 1203–1230, 2015Size of wildfires in the
Euro-Mediterranean region
C. Hernandez et al.
Title Page
Abstract Introduction
Conclusions References
Tables Figures
◭ ◮
◭ ◮
Back Close
Full Screen / Esc
Printer-friendly Version Interactive Discussion
Discussion
P
a
per
|
Discussion
P
a
per
|
Discussion
P
a
per
|
Discussion
P
a
per
|
c
1 c 2
0 0.05 0.1 0.15 0.2
0 0.05 0.1 0.15 0.2 0.25 0.3 0.35 0.4
Ratio
1 2 3 4 5 6
Figure 7.Ratiopcrit0,max−pcrit0,0/pcrit0,0for different values of thec1andc2parameters. The black diamond sign shows the (c1,c2) couple chosen by Alexandridis et al. (2008).
NHESSD
3, 1203–1230, 2015Size of wildfires in the
Euro-Mediterranean region
C. Hernandez et al.
Title Page
Abstract Introduction
Conclusions References
Tables Figures
◭ ◮
◭ ◮
Back Close
Full Screen / Esc
Printer-friendly Version Interactive Discussion
Discussion
P
a
per
|
Discussion
P
a
per
|
Discussion
P
a
per
|
Discussion
P
a
per
|
k1 k2 k
3
k4 k8
k7 k6 k5
C = ∑ ki
Wind direction