Chinese investments in the EU
Haico EBBERS
*and Jianhong ZHANG
**Abstract
China’s investments in the European Union are much lower than what you may expect given the economic size of both entities. These relatively low investments in Europe are a combination of priority and obstacles. The priority for investments is clearly in Asia, Africa and Latin America. This regional pattern is heavily influenced by the need to solve the resource shortage in the medium and long term. The investments in Europe and the United States are mostly market seeking investments. Research specifically focused on Chinese M&A abroad comes to the same conclusion. The success rate of Chinese M&A abroad is much lower than what we see with respect to American or European investments abroad.
In this paper, we examine why Chinese firms are facing more difficulties in the European Union than in other regions. The paper focuses on Chinese M&A as proxy for total foreign direct investments abroad. By looking at the factors that have been documented as influencing the level of M&A abroad, it becomes clear that Chinese firms in Europe are hindered by many factors. For example, the trade between China and the EU is relatively low, the institutional quality is lower compared to the United States, there is less experience with respect to Europe and relatively many deals relate to State Owned Enterprises (SOE) which makes the deal sensitive.
So it is logical that Chinese investments are not very high in Europe. However, the research makes clear that the obstacles for Chinese investments in Europe are disappearing step by step. In that sense, we expect a strong increase of Chinese investments in Europe in the future.
Key words: FDI, mergers & aquisitions, China, EU
JEL classification: F21, G34, O52, O53
* Haico Ebbers is professor dr. at the Nyenrode Business University the Netherlands, e-mail: [email protected].
1. Introduction
In the 1990s we saw a strong increase of Chinese export and import flows, in combination with a rapid inflow of foreign direct investments. From 2002 onwards, we witness a new phase in China‟s integration in the world economy: the emergence of Chinese companies abroad. Prior to the 1980s, China‟s outward Foreign Direct Investments (OFDI) was negligible. After a first wave of Chinese companies investing abroad in the early 1990s the process more or less stabilised. The momentum took shape in the beginning of the new century. The growth of Chinese outward investments exploded during recent years. Even
during the financial crisis of 2009, China‟s outward direct investments remain
almost stable. According to the country fact sheet of China from the World Investment Report (WIR) that is published by the United Nations Conference on Trade and Development (UNCTAD) in 2009 and 2010, China‟s total outward FDI flows increased strongly between 1990 and 2009 as is shown in figure 1.
Figure 1. Overview of China’s outward FDI flows, millions of US$
Source: UNCTAD
The increase of China‟s outward FDI is partly driven by the strategy of the government. As a hybrid between a centrally-planned and market economy, the Chinese economy is still influenced by the state. In 2000, the Chinese government officially launched the so called “Go Global Policy”, which encourages domestic enterprises to participate in international capital markets and to invest directly overseas. The government has backed the firms‟ overseas acquisitions and joint ventures through tax benefits and favorable financing. Recently, China‟s government indicated that China would use more of its foreign exchange reserves through the China Investment Corporation to support and accelerate overseas expansion and acquisitions by Chinese companies. As a consequence, Chinese investors are becoming more visible; also in Europe.
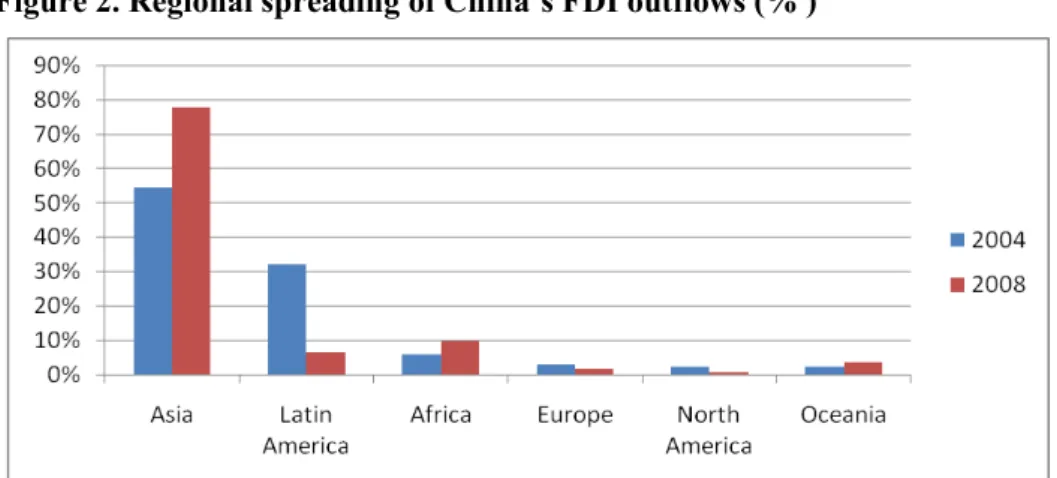
this 5 years period. Latin America, Europe, and North America have absorbed relatively less Chinese investments during the 2004-2008 period. However, the absolute value of China‟s FDI outflows to Europe went up from US$ 170 million in 2004 to almost US$ 1 billion in 2008 (Statistical bulletin of China‟s Outward Foreign Direct Investment, 2005 and 2009). As a consequence, The Chinese direct investment stock in Europe increased to 5 billion USD in early 2009.
Figure 2. Regional spreading of China’s FDI outflows (% )
Source: 2004 &2008 Statistical Bulletin of China's OFDI
Despite the growing media attention on Chinese investments abroad, its total overseas acquisition is still very low. Even though we see a strong increase, one should keep in mind that growth figures are from a very low basis. The total accumulated stock by Chinese entities abroad increased to USD 140 billion in 2008; less than 1% of total foreign assets worldwide (China Statistical Yearbook).
The structure of the paper is as follows. In Chapter 2 we discuss the characteristics of Chinese investments in Europe. One important factor is the role of the Chinese sovereign wealth fund as a relatively new source for outward investments. In chapter 3 the focus is on explaining why Chinese investments (by using M&A data) are relatively low in Europe. Chapter 4 relates to the future developments of Chinese investments in Europe. The final chapter concludes.
2. The characteristics of Chinese investments in the European Union
Most of China‟s foreign investments come from the big State Owned Enterprises (SOE) looking for resources, markets and knowledge. Another part comes from private companies; mostly family businesses that found their way to foreign markets. Predominantly motivated by the market (potential), they search for knowledge or management skills. Besides the SOEs and private companies, there is a third flow of capital moving abroad. This flow does not relate to direct investments, but these are the investments in mostly treasury bonds to finance the government deficit; mainly the US, but more and more also in Europe. China‟s trade surplus with the United States cumulated into an enormous inflow of reserves; mostly dollars. To counteract the pressure for a renminbi appreciation the Chinese authorities used these reserves to buy US Treasuries. By investing in these government bonds it supported the value of the dollar, and kept its export relatively cheap. Mid 2009, China owned more than $800 billion in US Treasuries (Prasad 2009), which is almost a quarter of the American total outstanding debt. Ferguson (2008) referred to this situation in which the United States and China are totally entangled in the field of short term capital flows with his term Chimerica.
2.1. An additional source of China’s FDI
After 2007, we witness a new source of Chinese direct investments. In September 2007, China established the China Investment Corporation (CIC); the Chinese Sovereign Wealth Fund (SWF). In general, there are two types of SWFs: financial investors such as the Norwegian fund and strategic investors such as the Singaporean fund. Financial investors have no interest in control, while the strategic investors are looking for management control. There was a doubling of Sovereign Wealth Funds between 2000 and 2009 and their total assets was around 4 trillion US$ at the end of 2009. It is clear that this fast growth resulted in media attention and political sensitivity.
and stated over and over again that the only goal is to achieve high returns on their investments. The aim is not to take over control over management. If one looks at the investments done by CIC, most of the investments are minority shares in a broad variety of companies, ranging from minority shares in Morgan Stanley, Blackstone, Noble and Visa cards. There are some majority holdings but the fund will act as a passive investor with no involvement in daily management. It is not only direct control of CIC which received mistrust. Also the fact that CIC is helping Chinese companies to invest abroad received some attention.
2.2. Regional spreading and modes of entry
The main countries in the EU for Chinese Outbound Foreign Direct Investment are France, Germany, Italy, Spain, The Netherlands, and the United Kingdom (Coppel, 2008). At the same time, China is more and more active in Central and Eastern Europe. Companies such as TCL (electronics), CNPC (petroleum), Bank of China, Industrial and Commercial Bank of China and the automobile companies Chery and Geely found their way to countries such as Poland, Bulgaria and Romania.
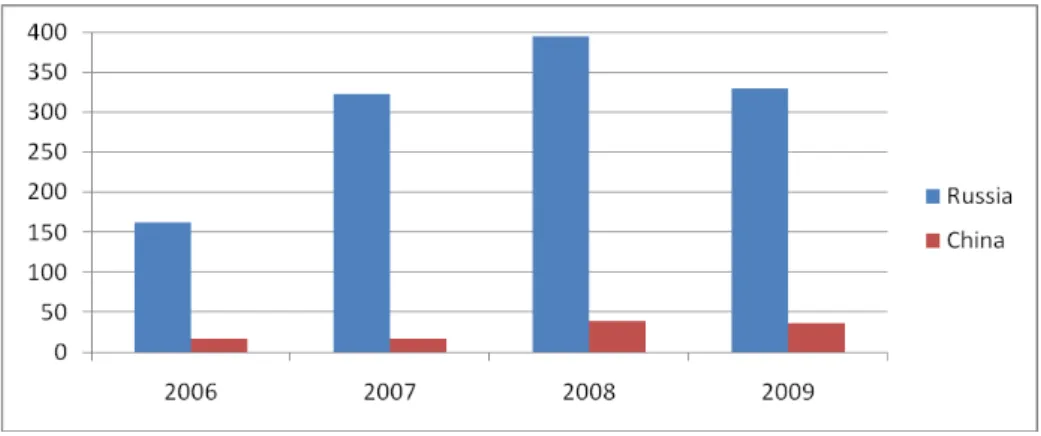
As stated earlier in the paper, despite impressive growth, the absolute magnitude of China‟s outward FDI remains small. China‟s outward FDI stock accounts for only 1% of the world total in 2008 (UNCTAD 2010). Also, in terms of FDI outflow per capita, there is a lot of potential. China has much lower outward FDI flows per capita compared to, for example, Russia. Figure 3 shows that FDI per capita in Russia increased from 162 in 2006 to 330 in 2009. This is substantial higher than the per capita outward FDI in China that ranges from 16 (2006) to 36 (2009).
Figure 3. Comparison of outward FDI flows per capita between China and Russia, US$
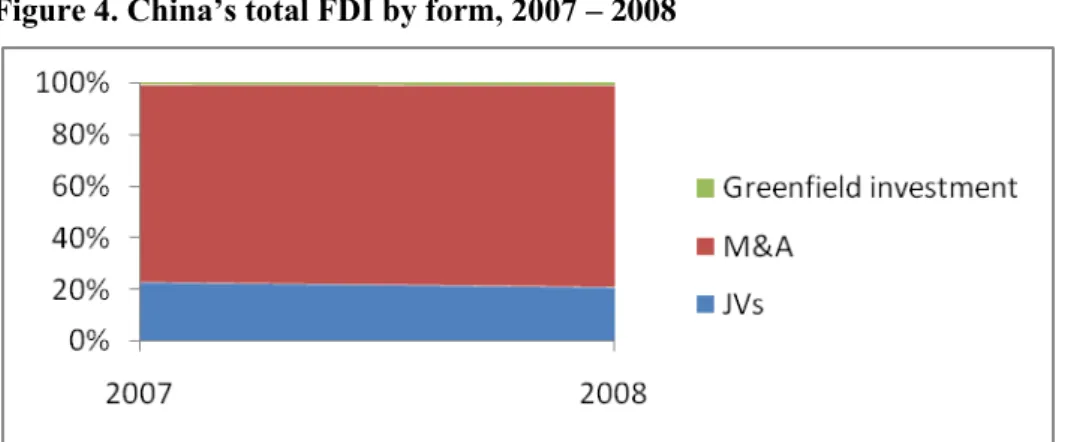
Rosen and Hanemann (2009) have pointed out that M&A deals account for more than 80% of total Chinese outward FDI in 2007 and 2008. The actual data from China Statistical yearbook (2009) also supports this view. As shown in figure 4, during 2007 and 2008, less than 1% of Chinese FDI has chosen Greenfield investment as the mode of entry. Approximately 20% of Chinese FDI implements JVs, and the rest has selected M&A as their mode of entry to do overseas investments.
Figure 4. China’s total FDI by form, 2007 – 2008
Source: China Statistical yearbook
2.3. The rationales behind Chinese investments in the EU
The rationales behind Chinese investments in the European Union are investigated by various authors. For example, Gattai (2010) indicates that Chinese companies are motivated by both “push” and “pull” factors to expand their business in the EU. The push factors relates to the economic and political environment in China. Examples are the level of overcapacity in certain markets and government policy to stimulate outward FDI. Pull factors refer to the host country characteristics such as the potential market and other location advantages. Some research focuses on specific bilateral relations. Burghart (2009) focus on Chinese investments in the UK. Nicolas (2010) concentrates on Chinese investments in France. The research of Barauskaife (2009) specifically looks at the Baltic States. The mentioned research makes clear that access to foreign markets is the overwhelming driver behind China‟s outflow of investments to the EU and that government policy at home and in the host country is of utmost importance.
FDI inflow and outflow through 5 stages of economic development. On the vertical axis the net outward investment (NOI) position is indicated. This NOI is the gross outward direct investment stock less the gross inward direct investment stock. A negative NOI means that the inward FDI stock is larger than the outward FDI stock, while a positive NOI indicates more outward stock compared to inward FDI stock. As shown in figure 5, China‟s investment development from 1980 to 2009 is following the IDP (the trend line is in red, the green line shows the annual NOI flows). China is at stage 3 of the IDP; with increasing ownership-advantages for its domestic companies.
Figure 5. Chinese case in the NOI flows over 19 years, millions of US$
Source: WIR annex tables
So in the mainstream research of international business and international economics what we see today with respect to Chinese investments in the EU is not a-typical; in fact it is in line with what you would expect to happen in an emerging market economy such as China.
Next to GDP, specific government policy, including tax incentives, are crucial for Chinese companies to make decisions on FDI in other countries. China‟s “Going Global” policy becomes an important rationale behind China‟s FDI towards the European Union. As an evolutionary breakthrough, the “Going Global” policy was announced first by the Chinese government in 2000 and executed over the following years. As a consequence, the overseas investments of Chinese companies increased dramatically. Figure 6 shows the steady evolution of Chinese government policies on Chinese outward investments.
Bank of China and the China Development Bank, gave strong fiscal backing, like a favourable financing in the form of credit lines and low-interest loans.
Figure 6. Phases of China’s outward FDI policy
Phase 1: Tight controls 1979-1983
Restrictive attitude toward OFDI due to ideological skepticism, inexperience, and low foreign exchange reserves. Only specially designated trade corporations could apply for OFDI projects. No regulatory framework was existent; firms had to apply for direct, high-level approval from the State Council on a case-by-case basis.
Phase 2: Cautious encouragement 1984-1991
As global markets gained more importance, the government gradually started to encourage OFDI projects that generated foreign technology, control over resources, access to overseas markets, and foreign currency. The first regulatory framework for OFDI was drafted in 1984-85, allowing companies other than trading firms to apply for OFDI projects, However foreign exchange reserves were still at a low level and only firms that earned foreign exchange from overseas activities could qualify for OFDI projects.
Phase 3: Active encouragement 1992-1996
The post-Tiananmen decision to accelerate economic reforms and global integration led to a policy of more active encouragement of OFDI. The goal was to increase the competitiveness of Chinese businesses, with a special focus on 100 plus state-owned national champions. The foreign exchange regime shifted from an "earn-to-use" to a "buy-to-use" policy and the OFDI approval procedures were gradually eased and localized.
Phase4:Steppingback 1997-1999
Government tightened regulatory processes for OFDI projects and recentralized foreign exchange acquisition against the backdrop of the Asian financial crisis, which revealed that many firms had used OFDI projects for illegal and speculative transactions, leading to heavy losses of state assets and foreign exchange reserves.
Phase 5: Formulation & implementation of the "going global" policy
In anticipation of WTO accession and growing competition in domestic markets, policymakers returned to their previous stance of encouraging OFDI and announced a policy package aiming at supporting Chinese firms from various sectors to "go abroad".
In 2004, the regulatory process was reformed and foreign exchange controls were further eased and localized. Central officials and local governments begun to provide broad and active political and practical assistance for firms with overseas expansion plans.
Phase 6: Growing political support for transnational corporations and a new push for liberalization 2007-present
Policymakers' support for outbound FDI further increased both because of China's massive foreign exchange reserves (surpassing $1 trillion in 2006) and the need to build up competitive transportation corporations to sustain a change in China's economic growth model. A new regulatory framework implemented in May 2009 further eased and decentralized the approval procedures. New rules proposed by SAFE in the same month will significantly ease the foreign exchange management for overseas projects and broaden the sources of financing available for outbound investment. Source: Rosen, and Hanemann, 2009
in CEE provide incentives for FDI via tax-concessions, tariffs-abolition, the settlement of free economic zones, and the avoidance of double taxation. Furthermore, investments in selected sectors, such as the agricultural-related products and the businesses that implement new technologies, are given preferential incentives like investment allowance or tax credits (Ricupero, 2000; Radu, Mitroi, Anghel et al., 2007). Although most legislation on FDI is generic, attracting more Chinese FDI became a priority for selected countries in the region. Many countries, including the Czech Republic, Hungary, Poland, Romania, Russia, and Ukraine have signed Bilateral Tax Agreement (BTA) with China.
3. Why are Chinese investments low in the EU?
China's investment in EU only accounts for a small percentage of China's total overseas investment; much lower than one would expect given that the EU is an important economic power. As indicated in the previous part of the paper, an overwhelming share of 80% of Chinese FDI towards the EU can be labelled as M&A. Therefore, to find the main obstacles of Chinese FDI‟s in the EU, we may use the success of M&A activities as a proxy for total FDI over the period until the end of 2008. If we take the Chinese overseas M&A as an example, we find that the success rate of Chinese firms in Europe is substantially lower than for example in North America (for the definition of success, see footnote 2). As a result it is interesting to examine why Chinese firms are facing more difficulties in the EU compared to other regions.
3.1. Determinants of success
Figure 7 below shows the success rate of China‟s overseas M&A in the major regions.1 The success rate in Europe is lower than in North America, Africa and South America. In particular, the difference from the United States is interesting because research indicates that the motives to invest are the same for both regions. In order to explain the situation in Europe, we compare the factors that have been documented as factors that significantly influence the success rate.
Figure 7. Success rate by regions 1982-2008
40% 45% 50% 55% 60% 65%
Asia Europe North America
Africa and South America
Oceania
Source: Authors‟ own calculation based on Thomson data
Based on the results of the two existing empirical studies mentioned above, we choose 7 variables for further analysis: the quality of the institution framework, the bilateral trade intensity, the industry characteristics; mainly the question if the company is operating in a sensitive sector such as the energy sector. The next factors relate to the characteristics of the buyer; being a State Owned Enterprise or a private acquirer. The final two variables are the experience of the Chinese company abroad and the use of an external advisor. These 7 factors have been found as significant variables that influence the
success rate of China‟s overseas M&A. Figure 8 provides the measurement of
the variables.
Figure 8. The measurement of the variables
Variables and their impacts
Measures Source
1. Institution quality (+)
It is calculated by using seven ICRG political risking measures – government stability, socio-economic conditions, investment profile, law and order, democratic accountability, prevalence of corruption and bureaucratic quality. The factor analysis is used to create the single measure. Higher scores on this measure mean higher quality of institutions.
Political Risk Services Group, 2. Trade
intensity (+) ( )/( )
) /( ) ( w w c c h h ch ch ch m x m x m x m x TI
x and m denote export and import, c, h and w denote China, host country and the world
IMF DOT
3. Sensitive resource (-)
Dummy variable with the value of 1 if an acquisition deal is in energy and other sensitive industries and 0 if it is not
Thomson
4. SOE acquirer (-)
Dummy variable with the value of 1 if an acquirer is state owned enterprise and 0 if it is not
Thomson
5. Private acquirer (+)
Dummy variable with the value of 1 if an acquirer is a private enterprise and 0 if it is not
Thomson
6. Experience (+)
Dummy variable with the value of 1 if an acquirer has successful experience in overseas acquisition, 0 if it is not
Thomson
7. Advisor (+)
Dummy variable with the value of 1 if an acquirer hires an international advisor, and 0 if it is not.
Thomson
Legend
(+) positive impact on success rate (-) negative impact on success rate
3.2. Explaining the results
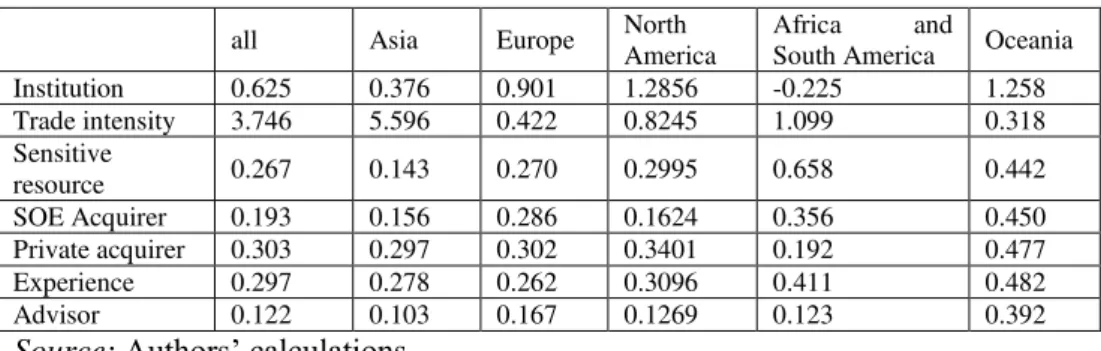
Now that we know the main variables to explain successful foreign M&As of Chinese firms, the next step is to find out how the European Union differs from the other regions. For this analysis we calculate the mean of the variables. For calculating the mean we only used the data of the year in which M&A deals were executed. For example, if no M&A deals happened in 2004, we left out 2004 in our calculations. If many deals have been executed in 2008, this year is relatively important in the calculation of the mean. The result is exhibited in figure 9. We analyze the variables as follows.
influencing the performance of MNEs (North 1990, 1991; Brunetti and Weder 1998; Buckley et al. 2007; Dikova, et al. 2009). Existing studies have found the evidence that host country‟s institution influences the success rate of China‟s overseas M&A (Zhang et al. 2010). The figures in Table 9 show that institutional quality is lower in Europe (0.901) than in North America (1.2856), which may partly explain the lower success rate in Europe compared to North America.
Entering into the EU is more complicated than entering into other countries due to the fact that the EU is, on the one hand, an entity of 27 different nation states and, on the other hand, one common market with harmonised rules and regulations. Chinese companies have to cater not only for the EU regulations but also for every individual country. The EU is a strange animal in the eyes of many Chinese firms and officials and consequently, the Chinese investors have difficulties to figure out whom they should speak with. This perception about the European Union can also be seen in the way Chinese are labelling the institutional framework of the EU.
The table makes clear that the institutional framework in Africa and Latin America is relatively low and at the same time the success rate of Chinese M&A is higher in these regions compared to the EU. One argument for this phenomenon is that Chinese firms perform better in countries with lower institutional quality than the firms from developed countries (Buckley et al., 2007). The political and economic needs and better political relation between China and Africa could be another explanation for the high success rate in Africa.
2. Trade intensity. The EU-China relation is not the first priority of China‟s foreign policy. The China-US relation is of much more importance for China than the China-EU affairs. We use trade intensity as a proxy of bilateral economic relations, which measures the degree to which two countries trade more or less intensively with each other than they do with the rest of the world given the size of their total trade (Zhang and Ebbers 2002). The existing empirical studies found that trade intensity is a significant factor influencing the success rate of China‟s overseas M&A (Zhang and Ebbers 2010). The higher the trade intensity, the higher the success rate is. Figure 9 shows us that the trade intensity with Europe (0.422) is much lower than with North America (0.8245), Africa and South America (1.099). This implies that relatively low trade intensity hampers Chinese firms to buy European firms successfully.
Sensitive sectors. It is commonly recognized that it is relatively difficult to buy a firm in a sensitive sector, because of political concerns and perceived national security threats. The consequence can be that deals are blocked by national review agencies. The existing empirical studies indicated in section 3.1 confirmed this view. Because it is a dummy variable, it can range between 0 and 1. The higher the score, the more deals are executed in sensitive sectors. Figure 9 shows that the mean of this “sensitivity” variable is low in Europe (0.270) compared to other regions. This implies that deals in sensitive sectors (such as oil, mining, energy and utilities) are not very important in Europe. On the contrary, resource seeking investment is the prominent motive of investments in Africa, South America and Oceania.
Ownership of acquirers. Research indicates that state owned enterprises are being confronted with more challenges than private firms when they acquire a firm abroad. Since it is a dummy variable, it can range between 0 and 1. The higher the score, the more SOEs are involved. If we focus on Europe and the United States, figure 9 indicates that SOEs are more active in Europe (0.286) than in North America (0.1624), but that private firms are more active in North America (0.3401) than in Europe (0.302). This fact explains partly the lower success rate in Europe as compared to North America.
4. Compared with mature enterprises in developed countries, Chinese enterprises are still at a preliminary stage of development, facing difficulties such as lack of experience of transnational actions and overseas management, abilities in risk evaluation and adapting to local customs. These drawbacks are more intense on Western markets than in developing countries.
Experience and use of advisors. The existing studies have confirmed that experience and the use of international advisors are important to make a successful deal. We again use a dummy ranging from 0 if there was no successful experience before 1 if the company had already a successful M&A. By looking at figure 9, we see that Chinese firms are less experienced in Europe (0.262) than in other regions.
Figure 9. The mean of the variables in Europe and other regions
all Asia Europe North
America
Africa and
South America Oceania Institution 0.625 0.376 0.901 1.2856 -0.225 1.258 Trade intensity 3.746 5.596 0.422 0.8245 1.099 0.318 Sensitive
This could be an explanation for the low success rate in Europe. In terms of the use of advisors (ranging again from 0 to 1), Europe (0.167) is slightly higher than North America (0.1269). This may be because of a more complicated business environment in Europe than in North America.
Due to these obstacles, the China-EU bilateral investment relation is less than what you may expect. But this is the situation today. One may expect a dramatic increase of Chinese investments towards the EU; driven by the large foreign exchange reserves, the increase of ownership specific advantages of Chinese companies and the growing intensity of China - EU “bilateral” trade relation.
4. The future of Chinese investments in Europe
In the previous sections of the paper, we elaborated on the main obstacles of Chinese investments in the European Union. In this section, the focus is on the question whether the drivers and obstacles behind Chinese investments in Europe will continue in the medium term future.
The utilization rate of China‟s global FDI is low. Between 2003 and 2008 this utilization rate was on average 30%. (China Statistical yearbook). Zhang and Ebbers (2010) focus in their research only on the success rate of Chinese M&A abroad. They indicate an average percentage of 50%; again much lower than what we see with respect to American or European investments abroad. It is clear that the indicated obstacles are reducing Chinese investment strongly in the European Union. According to empirical research and the outcome of figure 9, the main obstacle of M&A (as proxy for total FDI) in Europe relates to the political sensitivity Chinese investments face when investing in Europe, the low trade intensity and consequently, the low experience of doing business in Europe.
4.1. Getting to know each other
Chinese investors are new players in many countries and many countries, governments and companies are not used to it and maybe also not ready for it. An interesting case was the Chinalco-Rio Tinto case of 2009. Although this is an Australian case, there are some important learning points which can be related to the EU.
Chinalco's investment. One was political anxiety. Chinalco's status as an entity wholly owned by the Chinese Government was the core of the concern. Despite the fact that the company is commercially managed, Chinalco is funded by the China Development bank in which the China Investment Corporation (the Sovereign Wealth Fund of China) is the largest shareholder. Clearly, there is a very strong connection between Chinalco and the policymakers in Beijing. Since the announcement of the proposed deal, the Australian government has been confronting a growing protectionist clamor from trade unions, opposition politicians and local businesses not to allow a state-owned Chinese company to gain control of strategic mining assets. Sections of the military establishment were also opposed to the Chinalco deal, warning that it would cut across
Australia‟s longstanding ANZUS defense alliance with the US. The second
concern was Chinalco‟s future role as both shareholder and customer. The increase in ownership would also result in a stake in the management team. Shareholders of Rio Tinto feared that Chinalco‟s appointment of two directors to the Rio Tinto board, could give Chinalco excessive influence over Rio Tinto's revenues, future growth and pricing strategies.
The deal was blocked, but Chinese investors are still coming to Australia. In August 2009, PetroChina took over LNG and another state owned enterprise, Yanzhou Coal Mining Co, China's third-largest coal producer, completed the legal groundwork to take over 100% of the issued share capital in Felix at a price of about $3 billion, ranking it China's biggest takeover of an Australian firm. However, the takeovers were possible only under strict conditions. For example, the Yanzhou Coal Mining deal was subject to strict conditions. In order to obtain the official approval regarding the transaction, the company was obliged to carry out specific requirements such as the regulation that it should operate its Australian mines through Yancoal Australia Pty Limited, which is headquartered and managed in Australia with a predominately Australian management and sales team. Also it had to ensure that Yancoal Australia, and any of its operating subsidiaries, would have at least two directors whose principal domicile is in Australia, one of whom would be independent of Yanzhou Coal and its related entities. All these conditions are intended to reduce possible influence from the Chinese government to a minimum. It shows the compromises that the Chinese company has made for the completion of the deal.
4.2. Meet your new neighbours
Since there is a positive relation between GDP growth and FDI flows, combined with Dunning‟s eclectic paradigm, more China‟s FDI will go towards the European Union and Central and Eastern Europe. The increase of ownership specific advantage of Chinese companies is initiated and stimulated by the many joint ventures. Step by step Chinese companies learned from their partners and competitive strength is becoming strong enough to compete on foreign markets. As Dunning (1993) indicated, this O-advantage is one of the preconditions to investment abroad. Furthermore, what is happening in China (and other emerging markets), is in line with the Dunning-Narula framework (1996). They made clear that countries situated in stage 3 (the emerging markets) witness a strong increase in outward direct investments. This will continue in the later stage three and early stage 4. The consequence is that bilateral trade and investment flows between China and Europe will increase. The current low intensity trade will increase and more and more Chinese firms will build up experience in doing business in Europe. As a result, we may expect a strong increase in Chinese investments in Europe.
There is also a push factor working during the next coming years. Many of China‟s domestic markets witness a dramatic overcapacity. This overcapacity is driven by two factors. Firstly, there are too many suppliers due to the fact that in most cases local governments are helping companies to stay afloat within their borders. As a consequence, no company is leaving the market and more and more foreign companies are entering this same markets. Secondly, the government stimulated the economy dramatically in 2008 and 2009. Part of the stimulus package was focused on domestic consumption. Another part of the stimulus package was targeted at domestic investments in infrastructure and healthcare. There was also direct income support. As a consequence, domestic investments increased considerably which fuelled the already existing overcapacity on many markets. This situation of overcapacity will stimulate Chinese companies to invest abroad.
5. Conclusion
domestic economy. The process of meeting your new neighbours always takes time.
Besides the reduction of political obstacles, there is a growing tendency among private companies to enter the European Union looking for markets and brands. One may expect a strong increase in market driven investments which are backed by government support. The growing overcapacity on many Chinese markets is related to this. Expectations are that this overcapacity will be the main characteristic for many years to come. Step by step, Chinese companies with enough O-advantages therefore will move abroad. This will result in more market-seeking investments abroad, including in Europe.
It is a new fact in today‟s globalized world that investments from emerging markets are finding their ways to the “West”. It is clear that Chinese investments will increase over the next decade and we need to adjust to this new situation. This adjustment process holds for policy makers as well as international operating companies.
References
Accenture Consulting (2005), China spreads its wings–Chinese companies go global.
Bary, K., Grant, Ch., and Leonard, M. (2005), Embracing the dragon – The EU’s
partnership with China, Centre for European Reform, UK.
Blomström, M., and Kokko, A. (2003), The Economics of Foreign Direct Investment Incentives, Stockholm School of Economics.
Bondiguel, Th. (2008), Central Europe and China: towards a new relation?,
EUROPEUM Institute for European Policy.
Boudier-Bensebaa, F. (2008), FDI-assisted development in the light of the investment development path paradigm: Evidence from Central and Eastern European countries,
Transnational Corporations, Vol.17, No.1, University Paris Est.
Branch, B., Wang, J. and Yang, T. (2008), A note on takeover success prediction,
International Review of Financial Analysis, 17 (5):1186-1193.
Brunetti, A. and Weder, B. (1998), Investment and institutional uncertainty: a
comparative study of different measures, Weltwirtschaftliches Archiv, 134: 513-533.
Buckley, P. J., Clegg, L. J., Cross, A. R., Liu, X., Voss, H., and Zheng, P. (2007), The
determinants of Chinese outward foreign direct investment, Journal of International
Business Studies, 38 (4): 499-518.
Cheng, S., and Stough, R. R. (2007), The Pattern and Magnitude of China’s Outward
FDI in Asia, Indian Council for Research on International Economic Relations.
Chowdhury, A. and Mavrotas, G. (2006), FDI and growth: What causes what?, The
Coppel, J. (2008), China’s Outward Foreign Direct Investment, OECD Investment News.
Deng, P. (2006), Investing for strategic resources and its rationale: The case of outward
FDI from Chinese companies, Kelley School of Business, Indiana University.
Denscombe, M. (2003), The Good Research Guide: For Small-scale Social Research
Projects, 2nd Edition, Open University Press.
Dikova, D., Rao Sahib, P. and Witteloostuijn, A. van. (2009), Cross-border Acquisition Abandonment and Completion: The Effect of Institutional Differences and
Organizational Learning in the Business Service Industry, 1981-2001, Journal of
International Business Studies, 41: 223–245.
Dunning, J. H. (1993), Multinational enterprises and the global economy,
Addison-Wesley Publishers, UK, pp. 69-81.
Dunning, J. H. and Narula, R. (1996), The investment development path revisited,
Routledge, pp. 1-12.
Ebbers, H. and Zhang, J. (2002), Trade relations between China and the European
Union; how to analyse the intensity?, in Xiaming L. (ed.) China’s trade and investments
relations, Taylor and Francis.
Ebbers, H. and Zhang, J. (2002), Foreign Direct Investment Inflow and Export to Home
Country: Perspective of Country-of-Origin Difference, Business Journal, Southern
Connecticut, Vol. 17, Issue 1-2, pp. 8-13.
Filippov, S. and Kalotaym, K. (2009), Foreign Direct Investment in Times of Global
Economic Crisis: Spotlight on New Europe, UNU-MERIT Working Paper.
Filippov, S. and Saebi, T. (2008), Europeanisation strategy of Chinese companies: Its
perils and promises, UNU-MERIT Working Paper, 2008-055.
Gattai, V. (2010), EU-China Foreign Direct Investment: A double-sided perspective,
Bicocca Open Archive, Italy.
Gugler, Ph. and Boie, B. (2008), The emergence of Chinese FDI: Determinants and
Strategies of Chinese MNEs, Copenhagen Business School, Copenhagen, Denmark.
IBM institute for Business Value, and School of Management at Fudan University,
(2006), Going global: Prospects and challenges for Chinese companies on the world
stage, IBM Business Consulting Services.
Jiang, G., Zhang, F., and Thakur, P. (2007), The Location Choice of Cross-Border
Mergers & Acquisitions: The Case of Chinese Firms, European International Business Academy, Belgium.
Jianhong, Z., Ebbers, H. (2010), Why half of Chinese Overseas Acquisition Could Not
Be Completed?, Journal of Current Chinese Affairs, 39 (2):101-130.
Jianhong, Z, Zhou, C and Ebbers, H. (2010), Completion of Chinese Overseas
Acquisitions: Institutional Perspectives and Evidence, International Business Review,
Johnson, A. (2006), The Effects of FDI Inflows on Host Country Economic Growth,
CESIS Working Paper Series in Economics and Institutions of Innovation, No. 58.
Keizer, J. and Wevers, H. (2005), A Basic Guide to International Business Law,
Groningen/Houten: Wolters-Noordhoff.
Korniyenko, Y. and Sakatsume, T. (2009), Chinese investment in the transition
countries, European Bank Working Paper, No. 107.
Kumar, N. (1998), Globalization, Foreign Direct Investment and Technology Transfers:
Impacts on and Prospects for Developing Countries, New York: Routledge.
Li, J., Lam, K. and Moy, J. W. (2005), Ownership reform among state firms in China
and its Implications, Management Decision, 43(4), pp. 568-588.
Li, S. and Xia, J. (2008), The roles and performance of state firms and non-state firms in
China's economic transition, World Development, 36(1), pp. 39-54.
Liu, X., Burridge, P., and Sinclair, P. J. N. (2002), Relationships between economic
growth, foreign direct investment and trade: evidence from China, Applied Economics.
Lucks, K. (2008), Trends in Global M&A – Challenges faced by Chinese companies
when expanding into 1st tier markets, German Federal M&A Association, Association of German M&A Advisors, M&A Guidance, Coaching & Training.
Masca, S.G., and Vaidean, V.L. (2009), Outward FDI and the Investment Development
Path in Romania, Faculty of Economics and Business Administration, Babes-Bolyai University, Romania.
Misztal, P. (2010), Foreign Direct Investments as a factor for economic growth in
Romania, Review of Economic & Business Studies, Vol. 3, Issue 1, pp. 39-53.
Moses, N. K. and Hui, A. (2008), A profile of China’s outward foreign direct investment, Carleton University, Canada.
North, D. C. (1990), Institutions, Institutional Change and Economic Performance, New
York: Cambridge University Press.
North, D.C. (1991), Institutions, Journal of Economic Perspectives, 5, pp. 97-112.
Panagiota, B. (2009), The Effect of Tax Incentives on Investment - Decisions of
Transnational Enterprises (TNEs) in an Integrated World: A Literature Review, University of Patras.
Pricewaterhouse Coopers (2010), Foreign Direct Investment in Central and Eastern
Europe – A case of boom and bust, Economic Views, UK.
Radu, E., Mitroi, M., Anghel, D., Chirita, R., Rafaila, A., David, S., and Stanciu, M.
(2007), Invest in Romania, PricewaterhouseCoopers LLP.
Ricupero, Rubens (2000), Tax incentives and Foreign Direct Investment, United Nations
Rochananonda, C. (2006), Tax Incentives and FDI in Thailand, Ministry of Finance in Thailand.
Rosen, D. H. and Hanemann, T. (2009), China’s changing outbound foreign direct
investment profile: Drivers and Policy Implications, Peter G. Peterson Institute for International Economics.
Rui, H. and Yip, G. S. (2008), Foreign acquisitions by Chinese firms: A strategic intent
Perspective, Journal of World Business, 43(2): 213-26.
Safar, L. (2006), Globalization offshoring in Central and Eastern Europe, Vol.17, No.
82, MultiLingual Computing, Inc.
Santa-Cruz S., M. (2007), Intellectual Property Provisions in European Union Trade
Agreements: Implications for Developing Countries, ICTSD IPRs and Sustainable Development Issue Paper No. 20, International Centre for Trade and Sustainable Development, Geneva, Switzerland.
Sauvant, K. P. (2005), New sources of FDI: The BRICs. Outward FDI from Brazil,
Russia, India and China, Journal of World Investment and Trade, pp. 639–709.
Statistical bulletin of China‟s Outward Foreign Direct Investment, (2005 and 2009), Ministry of Commerce of the People‟s Republic of China, National Bureau of Statistics
of People‟s Republic of China, State Administration of Foreign Exchange.
Stefanovic, S. (2008), Analytical Framework of FDI Determinants: Implementation of
the OLI Model, Faculty of Economics, University of Nis, Trg kralja Aledsandra Ujedinitelja 11, Serbia.
UNCTAD WIR (various editions), World Investment Report, United Nations Press, New
York and Geneva.
Wang, L. (2007), Comparison between Greenfield investment and cross-border
acquisition, Economic Faculty, Xiamen University, China.
Wu, F. (2005), The Globalization of Corporate China, The National Bureau of Asian
Research.
Xiao, J. and Sun, F. (2005), The challenges facing outbound Chinese M&A,
InternationalFinancial Law Review, 24(12): 44-46.
Zhan, J. X. (1995), Transnationalization and outward investment: the case of Chinese
firms, Transnational Corporations, pp. 67-100.
Zhang, Y. and Filippov, S. (2009), Internationalization of Chinese firms in Europe,