41
China-EU Trade and Economic Relations (2003-2013)
CHEN XIN
Senior Researcher, Ph.D.
Director of the Economic Division at the Institute of European Studies
Chinese Academy of Social Sciences
CHINA
[email protected]
Abstract
The paper introduces the development of the China-EU trade and investment relations in the past ten years since the announcement of the China-EU Comprehensive Strategic Partnership, analyzes the driving forces for China's trade surplus with the EU, the situation of the bilateral trade disputes, as well as the issue of the "Market Economy Status" in the bilateral trade relations. The author concludes that great changes have taken place regarding the economic strength and international positions of the two sides, as well as in the international environment in the past ten years since the establishment of China-EU Comprehensive Strategic Partnership. The author also notes that despite the high growth rate of the trade volume between China and the EU, neither side has made adequate preparations for the dynamics of the bilateral trade and no efficient mechanism has been set up to lead the trends. In the future next ten years, China should try to transform the approach led by the EU, shift the passive status in the bilateral trade agenda, more focus on substance instead of forms, and construct a new way of thinking on China-EU economic and trade relations.
Keywords: China-EU Trade; China-EU Investment; Trade Deficit; Trade Disputes; Market
Economy Status; China-EU Comprehensive Strategic Partnership.
Introduction
China-EU Comprehensive Strategic Partnership (China-EU CSP) enters into a new decade, in 2013. Trade and economic relations have been among the fundamentals in China-EU relationship. The stability and healthy development of the trade and economic relations have provided the basis for furthering the bilateral relationship; at the same time the increasing trade disputes had a negative impact on China-EU relationship. Facing the next decade, it is worth summarizing the development of the China-EU trade and economic relations in the past decade, identifying the achievements, and exploring the future of the bilateral trade and economic relationship.
The bilateral trade
In 2003, both China and EU leaders agreed to promote the bilateral relationship to Comprehensive Strategic Partnership (CSP). China-EU trade has experienced a dynamic growth since then.
I. General trends in bilateral trade
42
the EU also increased almost 4 times, from USD 53.06 billion in 2003, to USD 212.05 billion in 2012. On the whole, the trade volume between China and the EU increased 4.3 times, from USD 125.22 billion in 2003, to USD 546.04 billion in 2012. Since 2004, the EU has been the biggest trade partner of China.
Graph 1 China’s Trade with the EU between 2003-2012, in billion USD
0 100 200 300 400 500 600
2003 2004 2005 2006 2007 2008 2009 2010 2011 2012
Export Import Total trade Trade balance
Source: MOFCOM.
The bilateral trade also dropped twice in the past decade. As revealed by Graph 2, the first drop was influenced by the Financial Crisis. Both China’să foreignă tradeă andă China-EU trade have experienced the first turbulence in more than 20 years of dynamic development.
Graph 2 China’s foreign trade and China-EU trade between 2003-2012, in billion USD
0 1000 2000 3000 4000 5000
2003 2004 2005 2006 2007 2008 2009 2010 2011 2012
China export China import
China total trade China export to the EU
China import from the EU China-EU total trade
Source: MOFCOM.
43
The speed of trade growth has experienced 3 times up-side-downs in the past decade. As shown inăGraphă3,ătheăfastestătradeăgrowthăwasăregisteredăină2003ăandă2004ăwhenăităwasăaă“honeyămoon”ă period in the history of the China-EU relationship. The annual growth rate of the bilateral trade was moreăthană40ș.ăChina’săexportătoătheăEUăwasăgrowingăbyăcloseătoă50șăaăyear,ăandăimportsăfromătheă EU increased by 85% in 2003 (!) and also by 30% in 2004. Such a high rate in trade growth has provided a fresh input into the newly announced China-EU CSP.
Graph 3 Growth rate in China-EU trade between 2003 and 2012
-150% -100% -50% 0% 50% 100% 150%
2003 2004 2005 2006 2007 2008 2009 2010 2011 2012
Export Import Total trade Trade balance
Source: Author’s calculation based on the data by MOFCOM.
The time between 2005 and 2007 was the first adjustment period. After the first slowing-down in 2005 and 2006, the speed of China-EU trade growth was back again to the fast track in 2007, with 30% increase, and the import from the EU increasing by 23% in 2006 and 2007. Hit by the Financial Crisis, the growth rate slowed down again. The rate of trade growth was 20% in 2008, either in export or in import. The first negative growth rate in the latest more than 20 years turned to the surface in 2009, when the trade volume between China and the EU decreased by 15%, with export down by 20% andăimportăbyă4ș.ăInă2010,ăbothăChina’săexportăandăimportătoătheăEUăwereăbackătoăfastăgrowthătrack,ă with more than 30% increase. And again hit by the Euro Crisis, trade dynamic slowed down. China had provided help to the EU by promoting import from Europe. The import growth rate reached 25% in 2011, but it could not prevent Europe from lack of demand. It was the second time to have a negative growth of China-EU trade in 2012. The trade volume decreased by 3.7%, with export decreasing by 6.2% and import just flat, at the same level of previous year.
Although there were 3 trend reversals in the past decade, the average growth rate of China-EU tradeă wasă overă 20ș,ă withă 24.2șă foră China’să importă fromă Europe,ă higheră thană theă 23.4șă averageă growthăforătheăChina’săexportătoătheăEU.
44
Graph 4 China-EU trade proportion in China’s Foreign Trade
0% 5% 10% 15% 20% 25% 30%
1981 1984 1987 1990 1993 1996 2001 2004 2007 2010
China-EU Trade Export Import
Source: Author’s calculation based on the data by MOFCOM.
II. The product structure
On product structure (the data of the product structure in EU-China trade is from EuroStat), theăproportionăofămanufacturedăproductsăinăChina’săexportătoătheăEU is consistently growing. At the sameă timeă theăproportionăofă theă EU’să exportă ofă manufacturedă productsă toă Chinaă isă ină aădownwardă trend, while the proportion of primary products export is growing. The primary products took 4.3% in EU’săimportăfromăChinaăbetween 2002 and 2004, and the manufactured products took 95.4%. In 2012, the proportion of primary products went down to 3.3%, and the manufactured products went up to 96.3ș.ăRegardingăonătheăEU’săexportătoăChina,ătheăprimaryăproductsătookă7.0șăandătheămanufactured products took 91.1% in 2002, whereas in 2012 the primary products increased to 14.1% and manufacturedăproductsăwentădownătoă84.7ș.ăTheăprimaryăproductsăfromăChinaăinăEU’sătotalăprimaryă products import increased from 1.3% in 2006, to 1.47% in 2012, and the manufactured products decreased from 29.0% to 22.50% in the same period. In export, the primary products exported to Chinaă increasedă fromă 4.76șă ină 2006,ă toă 6.8șă ină 2012ă ină EU’să primaryă productsă export,ă andă theă manufactured products increased from 5.54% to 9.1% in the same time.
Byăproductăcategory,ătheăproportionăofăChina’sătextileăproductsăinăEU’săimportăisădecreasingă and the proportions of machinery and electronic products is increasing, whereas the proportion of chemicală productsă ină EU’să exportăto China is increasing and the proportion of machinery and electronicăproductsăisădecreasing.ăInă2002,ătheătextileăproductsătookă14.9șăinăEU’săimportăfromăChina,ă the machinery and electronic products took 41.7% and chemical products took only 3%. In 2012, the textile products went down to 12.6%, the machinery and electronic products up to 50.2% and the chemicalăproductsătookă9.5șăalready.ăRegardingăexports,ătextileăproductsătookă1.3șăinăEU’săexportătoă China in 2002 and the chemical products 9.5%. The machinery and electronic products took 62%, in which the automotive products took 8.4% alone. In 2012, the textile products kept the same proportion at 1.3%, the chemical products went up to 11.7%, and the machinery and electronic products down to 58.5% in which the automotive products went up to 20.1%!
45
telecommunication products took 31.9șă ofă theă EU’să importă fromă Chinaă ină 2012,ă whichă wasă theă biggest import category and also the biggest trade deficit category in EU-China’sătrade.ăTheădeficităină thisăcategoryăwasăEURă87.3ăbillionăină2012ăandăităaccountedăforă60șăofătheăEU’sătradeădeficit with China.ăInă2012,ă56.8șăofătheăEU’sătotalăimportăofăelectronicădataăprocessingăandăofficeăequipmentă products came from China, and 50.6% of the total import of telecommunication products was also fromăChina.ăEU’sălargestăexportăcategoryătoăChinaăwasăelectronic machinery, electric and non-electric machineryă products,ă whichă accountedă foră 28șă ofă theă EU’să exportă toă China.ă Theă secondă largestă category was transportation equipment, which took 26.4%. The trade surplus in transportation equipment with China was EUR 28.4 billion in 2012, and the automotive products alone took EUR 25.9 billion.
Mutual investments
Comparing with the rapid development of trade, the mutual investments between China and the EU are less developed. There are different figures on investments because of the statistical methodology, but the general trends are similar.
I. General trends
Firstly, neither party considers the other party as main investment destination. The largest investment destination of the EU is the United States, while the largest investment destination of China is Asia. According to the data of EuroStat, the investment of the EU in China accounted for only 4.8% of its investment in non-member states in 2011; the largest investment destination of the EU was the United States in that year, accounting for 33.8%. Meanwhile, the investment of the United States in the EU accounted for 62.2% of the total investment EU received from non-member states, while China only contributed 1.3%1. In 2000-2010, 76% of the foreign investment received by the UnitedăStatesăwasăfromăEurope.ăLikewise,ăChina’săinvestmentăinăEuropeăonlyăaccountedăforă11.1șăofă itsă overseasăinvestmentăinătheă year,ă whileătheă investmentă ină China’să largestă investmentă destination,ă Asia, accounted for 60.9%2. In terms of accumulatedăamount,ăChina’săinvestmentăinăEuropeăwasăonlyă 7% of its total overseas investment, ranking third. The region receiving most investment was Asia (68.5%), followed by Latin America (12.8%).
Secondly, from the perspective of the accumulated amount, the investment of the EU in China is much higher than the investment of China in Europe. According to the statistics of the Ministry of Commerce, untill December 2003, the 15 member states of the EU have established 16,158 companies in China, with 65.943 billion dollars of contract utilization of European capital and 37.872 billion dollars of paid-in European capital. In terms of accumulated amount of paid-in foreign capital, EU ranked fourth among the countries and regions investing in China, behind Hong Kong, the United States and Japan. In the same period, China established 432 companies in the 15 EU member states, with 222 million dollars of contract amount of Chinese investment, less than 1% of the investment China received from EU3. By 2011, according toătheădataăofăEuroStat,ăChina’săinvestmentăinăEuropeă only accounted for 1.4% of the total investment of non-memberă states,ă whileă EU’să investmentă ină China accounted for 20% of total foreign investment China received, ranking fifth, behind Taiwan,
1
EuroStat, Foreign direct investment statistics,
http://epp.eurostat.ec.europa.eu/statistics_explained/index.php/Foreign_direct_investment_statistics, last visited on July 28, 2013.
2
Ministry of Commerce, National Bureau of Statistics and State Administration of Foreign Exchange, Statistical Communiqué on Overseas Direct Investment of China in 2011.
3
46
Hong Kong, the United States and Japan. In that year, China invested 3.1 billion Euros in the EU, and the EU invested 17.8 billion Euros in China4. In 2012, China invested 3.5 billion Euro in the EU, and the EU invested 10 billion Euro in China5.
Thirdly, from the perspectiveăofătheăincrement,ăChina’săinvestmentăinătheăEUăstartedălate,ăbută ită hasă beenă growingă fast.ă Ină recentă years,ă China’să investmentă ină Europeă greatlyă outpacedă Europe’să investment in China. Under the impact of the European debt crisis, the growth speed of EU investment in China shows a decreasing trend in recent years. According to the statistics of the Ministry of Commerce, from January to December 2012, China approved the establishment of 24,925 foreign-invested enterprises, an annual decrease of 10.1%; and actually utilized 111.72 billion dollars of foreign capital, an annual decrease of 3.7%. Among them, the EU27 member states actually invested 6.11 billion dollars of foreign capital, an annual decrease of 3.8%6.
Atătheăsameătime,ăChina’săinvestment in Europe shows a trend of fast growth in the recent years.ăAccordingătoătheăstatisticsăofăChineseăMinistryăofăCommerce,ăină2010,ăChina’săinvestmentăină Europe doubled (a 2.8 fold increase compared to 2009) and the flow reached 6.76 billion dollars, increasing by 101.6% year on year, accounting for 9.8% of the total flow and going up four percentage points compared to the previous year7.ăByă2011,ăChina’săinvestmentăinăEuropeărealizedăgrowthăforă three consecutive years, and the yearly flow was 8.25 billion dollars, increasing by 22.1% year on year and accounting for 11.1% of the total flow, including 7.561 billion dollars of investment in the EU, a year-on-year growth of 26.8%8.ăThisăsituationăwasăchangedăină2012.ăInăthatăyear,ăChina’săinvestmentă in Europe fell by 14.7% year on year in flow, to 7.035 billion dollars9, still higher than that in 2010.
Besides, China-EU mutual investment is in serious disproportion to China-EU trade volume. China’sătradeătoăEuropeăgrewăfastăinătheăpastădecade.ăInăaătime,ăităwas about to replace the United StatesăandăbecomeătheălargestătradeăpartnerăofătheăEU.ăAtătheăsameătime,ăEUăhasăremainedăChina’să largestătradeăpartnerăsinceă2004.ăForămanyăyears,ăităhasăbeenăChina’sălargestăexportămarket.ăAccordingă to the data of EuroStat, China-EU trade exceeded 100 billion Euro in 2001, 200 billion Euro in 2005 and 300 billion Euro in 2007, was close to 400 billion Euro in 2010 and it exceeded 430 billion Euro in 2011. In 2010 and 2011, China and the United States were locked in the contention for the largest trade partner of the EU. China-EU trade was less than 17 billion Euros behind US-EU trade. In 2012, this gap was broadened to more than 60 billion Euro. The gap between China and the United States over the position as the largest trade partner of the EU was widened again.
Compared with the rapid development of China-Europe trade in the recent 10 years, China-EU mutualăinvestment,ăparticularlyăChina’săinvestmentăinătheăEU,ălaggedămuchăbehind.ăTheătotalăamountă of US-EU mutual investment is 1.1 trillion Euros, while EU investment in China is 60 billion Euro and China’săinvestmentăinătheăEUăisă31.5ăbillionădollars.ăUnderăTrans-Atlantic background, compared with
4
DG Trade, Facts and Figures on EU-China Trade, April 2013.
http://trade.ec.europa.eu/doclib/docs/2009/september/tradoc_144591.pdf 5
EuroStat NewsRelease, 91/2013 - 13 June 2013. http://epp.eurostat.ec.europa.eu/cache/ITY_PUBLIC/2-13062013-AP/EN/2-13062013-AP-EN.PDF
6
http://tjtb.mofcom.gov.cn/article/y/ab/201301/20130100010897.shtml
7
Ministry of Commerce, National Bureau of Statistics and State Administration of Foreign Exchange, Statistical Communiqué on Overseas Direct Investment of China in 2010
8
Ministry of Commerce, National Bureau of Statistics and State Administration of Foreign Exchange, Statistical Communiqué on Overseas Direct Investment of China in 2011
9
47
the mutual investment between EU and the USA, the mutual investment between China and EU is insignificant.
In a word, investment becomes a lame leg of China-EU economic and trade relations. Regardless of the financial crisis and the European debt crisis, the growth rate of EU-US mutual investment is much higher than the growth rate of China-EU mutual investment. Investment drives trade and further drives employment and growth. The mutual investment between EU and the United States forms a solid economic foundation of the Trans-Atlantic relationship. Therefore, the further deepening of China-EU trade relations should not rest on the increase of export to the EU and should not only set a target of the largest trade partner of the EU. Instead, China needs to consolidate the cornerstone of China-EU trade relations to a deeper degree that is to increase two-way investment.
II. Country-specific Investment of China in Europe
At the end of 2012, China had nearly 2000 directly investing companies in the EU and employed 42,000 local people. By countries, the investment was concentrated, mainly in Britain, France, Germany, Luxembourg, Sweden and Holland; but covered all of the 28 EU member states.
By countries, the top 10 countries receiving investment from China in 2010 included the EU member states Luxembourg and Sweden and the top 20 countries included also Germany and Hungary.ăExceptăforătheăinvestmentăinăLuxembourg,ăfocusedăonăbusinessăservices,ăChina’săinvestmentă in the other three countries mainly flowed to the manufacturing sector. The investment was 3.207 billion dollars in Luxembourg, 1.367 billion dollars in Sweden, 412 million dollars in Germany and 370 million dollars in Hungary. The top 10 countries receiving investment from China in 2011 included the EU member states France, Britain and Luxembourg. The top 10 countries receiving investment from China in 2012 included the EU member states Britain (2.775 billion dollars) and Luxembourg (1.133 billion dollars) while the top 20 countries included also Germany (799 million dollars).
By total amount, by the end of 2012, China had cumulatively invested 36.98 billion dollars in Europe,ăaccountingăforă7șăofăChina’sătotalăoverseasăinvestment10
. The countries receiving more than one billion dollars of cumulative investment from China included Luxembourg, Britain, France, Germany, Sweden and Holland. The top ten investment receivers included Luxembourg (7th place, 8.978 billion dollars) and Britain (8th place, 8.934 billion dollars), and the top 20 also included also France (13th place, 3.951 billion dollars) and Germany (15th place, 3.104 billion dollars).
Regardingă China’să investmentsă ină theă EU,ă ină 2012,ă Franceă remainedă China’să largestă investmentădestinationăinăEuropeăasă21șăofăChina’săinvestmentăprojectsăinăEuropeăwereăinăFrance.ă Following France were Britain and Germany, 16% and 7% respectively11.ă Chinaă becameă France’să eighth largest source country of foreign capital in 201212.
10
Ministry of Commerce, National Bureau of Statistics and State Administration of Foreign Exchange, Statistical Communiqué on Overseas Direct Investment of China in 2012
11
Economic and Commercial Counsellor’s Office of the Ministry of Commerce in France, http://www.mofcom.gov.cn/sys/print.shtml?/i/jyjl/m/201304/20130400102296
, last visited on April 25, 2013. 12
Economic and Commercial Counsellor’s Office of the Ministry of Commerce in France, http://www.mofcom.gov.cn/sys/print.shtml?/i/jyjl/m/201304/20130400102294
48
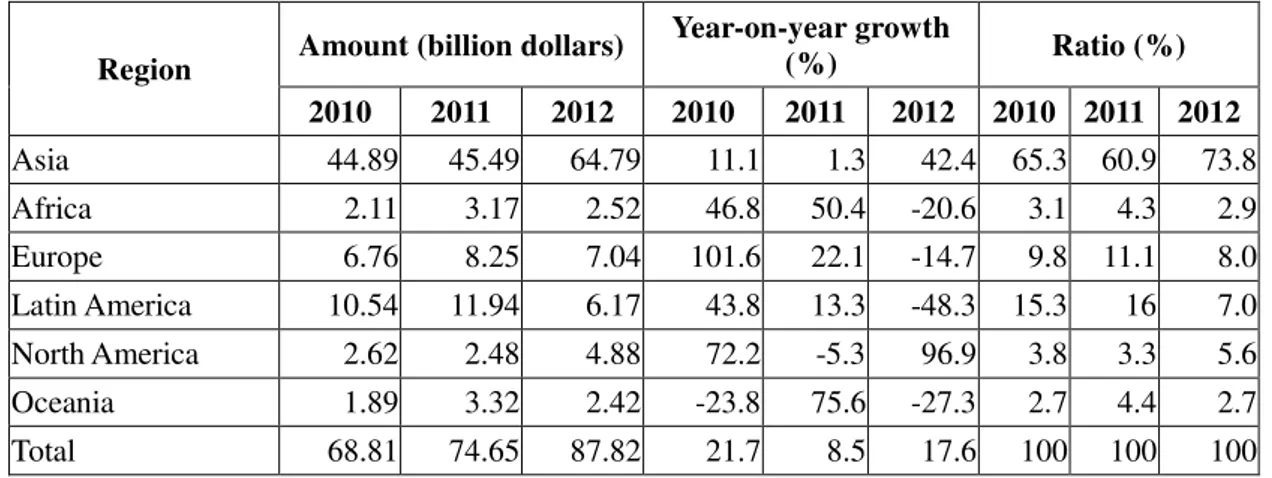
Table 1 Regional composition of flow of China’s overseas direct investment in 2010-2012
Region Amount (billion dollars)
Year-on-year growth
(%) Ratio (%) 2010 2011 2012 2010 2011 2012 2010 2011 2012
Asia 44.89 45.49 64.79 11.1 1.3 42.4 65.3 60.9 73.8
Africa 2.11 3.17 2.52 46.8 50.4 -20.6 3.1 4.3 2.9
Europe 6.76 8.25 7.04 101.6 22.1 -14.7 9.8 11.1 8.0
Latin America 10.54 11.94 6.17 43.8 13.3 -48.3 15.3 16 7.0 North America 2.62 2.48 4.88 72.2 -5.3 96.9 3.8 3.3 5.6 Oceania 1.89 3.32 2.42 -23.8 75.6 -27.3 2.7 4.4 2.7
Total 68.81 74.65 87.82 21.7 8.5 17.6 100 100 100
Data source: Ministry of Commerce, National Bureau of Statistics and State Administration of Foreign Exchange, Statistical Communiqué on Overseas Direct Investment of China in 2010, Statistical Communiqué on
Overseas Direct Investment of China in 2011 and Statistical Communiqué on Overseas Direct Investment of
China in 2012.
III. Sector Distributi
on of China’s Investment in Europe
In 2012, the investment flow of China in the EU was 6.12 billion dollars, accounting for 7% of its total flow. Regarding sector distribution, 1.806 billion dollars flowed to the manufacturing sector, accounting for 29.5%, mainly distributed in Britain, Sweden, Germany, France, Italy, Holland and Austria; 1.259 billion dollars flowed to the leasing and business services sector, accounting for 20.6%, mainly distributed in Luxembourg, Britain and Germany; 1.045 billion dollars flowed to the financial sector, accounting for 17.1%, mainly distributed in Britain, Germany, Luxembourg, Italy, France, Hungary and Ireland; 852 million dollars flowed to the transportation, storage and post service sector, accounting for 13.9%, mainly distributed in Britain and Germany; 427 million dollars flowed to the wholesale and retail sectors, accounting for 7%, mainly distributed in Britain, Belgium, Germany, France and Bulgaria.
Byătheăendăofă2012,ăChina’sătotalăinvestmentăinătheăEUăwasă31.538ăbillion dollars, accounting for 5.9% of its total overseas investment. In view of sector distribution, 9.667 billion dollars flowed to leasing and business service sector, accounting for 30.7%; mainly distributed in Luxembourg, Germany, France, Italy and Hungary; 6.302 billion dollars flowed to manufacturing sector, accounting for 20%, mainly distributed in Sweden, Britain, Germany, Holland, France, Italy, Span, Austria, Hungary and Romania; 3.793 billion dollars flowed to mining sector, accounting for 12%, mainly distributed in France, Britain, Holland and Luxembourg; 1.163 billion dollars flowed to transportation and storage sector, accounting for 3.7%, mainly distributed in Britain, Germany and Belgium; the investment in scientific research and technical service sector accounted for 2.3%, the investment in production and supply of electric power, heating power, fuel gas, water and other utilities accounted for 2.1%, the investment in agriculture, forestry, animal husbandry and fishery accounted for 1.2%, and the investment in real estate accounted for 0.9%.
49
was the best chance for China to enlarge its influence in Europe13. These discussions had generated unfavorableăimpactăonăChina’săinvestmentăinăEurope.ă
The trade imbalance
China had a trade deficit with EU before 1997, and since then China turned to a trade surplus. Afteră becomingă aă memberă ofă theăWTO,ă China’să tradeă surplusă withăthe EU increased dramatically. Debates on trade imbalance between China and the EU became more and more frequent, along with increasing trade disputes.
The debate on the bilateral trade imbalance referred to the data, at the initial stage. Especially in 2003, according to the Chinese statistics, China had a trade surplus of USD 19.1 billion with the EU, whereas according to the EuroStat, the EU had a trade deficit of EUR 64.2 billion with China. The gap was huge, but it was embedded in technical reasons, such as the custom clearance method, the exchange rate, etc. The enlargement of the EU in 2004 and 2007 also generated confusion to some extent for both China and the EU custom services. After the EU enlargement, trade data were relatively close to each other.
The peak of the trade imbalance was in 2008, when China had a US 160.18 billion trade surplus with the EU, which was the third largest after the China-Hong Kong and the China-USA ones, whereas the EU had a EUR 169.54 billion trade deficit with China according to the EuroStat. As indicatedăinăGraphă5,ăsinceăthen,ăChina’sătradeăsurplusăwasădownătoăUSDă100ăbillionăină2009ăbecauseă of the global financial turmoil. There was a rebound in 2010-2011, when the trade surplus was around USD 140 billion, then it went down again to USD 121.9 billion in 2012.
According to the EuroStat, the average annual growth rate of the EU exports to China was 15.3% between 2003-2012, surpassing the12.8% annual growth rate of the EU imports from China. Although China became the fastest export market of the EU, the export growth dynamic of the EU to China couldănotăkeepătheăpaceăwithăChina’săstrongăexportătoătheăEU.ăInă2012,ătheăEUătradeădeficităwithăChinaă accounted for 34% of the EU-China trade volume. Although it was a significant drop comparing with 52% in 2008. China was still the biggest deficit source of the EU external trade14.
Graph 5 China-EU Trade Imbalance 2002-2012
-200 -100 0 100 200
2002 2003 2004 2005 2006 2007 2008 2009 2010 2011 2012
EuroStat MOFCOM
Source: the European data is from EuroStat in billion Euro, and the Chinese data is from MOFCOM in billion USD.
Regarding the trade imbalance between China and the EU, we cannot stop at the bilateral data. We need to analyse from the angle of the economic globalization, because the bilateral trade data does
13
http://news.sina.com.cn/o/2010-12-29/090421726235.shtml 14
50
not necessarily reflect correctly the complicated trade relations15. Actually the main reason of the dramatic trade imbalance between the EU and China (similarly to that between the US and China) is the reorganization of the global value chain after China joining the WTO. Such kind of reorganization is represented in two ways.
One is the massive production capacity moving from East Asian economies to China coastal area. Against the background of the economic globalization, at the impact of Chinese labour cost advantageăandăChina’săastonishing capacity of absorbing FDI, a tremendous processing trade had been relocatedăfromătheăEastăAsianăeconomiesăsuchăasăJapan,ăSouthăKoreaăandăTaiwanătoăChina’săcoastală area,ăalongăwithămassiveăinvestment.ăSuchăkindăofăprocessingătradeăpropelledăChina’săexport growth in an explosive manner after joining the WTO. The export boost brought China the huge trade surplus with the EU and the US whereas a huge trade deficit with Japan, South Korea and Taiwan. At the same time, the trade surplus between the East Asian economies and the EU decreased dramatically as they moved their production to China. In other words, the export from these East Asian economies to the EU and the US changed for the export of parts and semi-products to China, then, after assembling and processing in China, they exported them to the EU and the US. Graph 6 shows such kind of trade triangle among China - the other East Asian economies - the EU16. As part of the trade triangle, China’săexportătoătheăEUăincreasedămoreăthană10ătimesăină10ăyears, from USD 23.8 billion in 1997, to USDă245.2ăbillionăină2007,ăandăatătheăsameătime,ăAsia’săshareăinătheăEUăimportăincreasedălessăthană 10%17. To sum up, the investors from East Asian economies to China transferred their export capacity to China. As a matter of fact, China replaced the export from East Asian economies to the EU18, but the bilateral trade figures did not reflect the real situation.
Graph 6 Trade Triangle among China - the Other East Asian Economics - the EU
Source: Drawing by author.
The second way is that the European and American manufacturers import semi-products from China, assemble them into final products and then they export these products. More than 2/3 of the
15AăreportăofăEUISSăreflectsătheăsimilarăargument,ăseeăMarcinăZaborowskiăedit,ăFacingăChina’sărise:ăGuidelinesă for an EU Strategy, Chaillot Paper No.94, EU Institute for Security Studies (EUISS), Paris, December 2006, p.17.
16
The original Trade Triangle model is based on the trade relations among China - the other East Asian economics - theă US,ă seeă Yangă Zhengwei,ă China’să Foreignă Tradeă andă Economică Growth,ă Chinaă Remină University Publishing House, 2006, p375. The author of the present paper had taken the verification with the EU data, and concluded that there is a similar trade tringle among China - the other East Asian Economics - the EU. 17EuropeanăCommission,ă“EU
-Chinaătradeăinăfactsăandăfigures”,ăMEMO/09/40,ăBrussels,ă30ăJanuaryă2009. 18AndreasăFreytag,ăTheăChineseă“juggernaut”ă–
51
EU’săimportăfromăChinaăwereăsemi-products, which helped the European manufacturers reduce their production costs and improve the competitiveness of the European export products.19 The European enterprises had benefited from the huge opportunity of the Chinese market through their investment to China, and they improved their competitiveness in the European market too. On the one hand, the FDI from Europe improved the competitiveness of the Chinese products through the spill-over effect, and promotedă China’să exportă toă Europe.ă Ată theă sameă time,ă theă Europeansă importedă semi-products and parts manufactured in China, improved the competitiveness of the European products and promoted the European export itself to the world market. On the other hand, the increase of the European investmentăinăChinaăreplacedăEU’săexportătoăChinaătoăsomeăextent, and intensified the trade imbalance between China and the EU. Some empirical studies show that the FDI from the EU is one of the reasons which generated the growing Chinese trade surplus with the EU.20
Studies on the Global Value Chain (GVC) released by the UNCTAD, the WTO, the OECD and the World Economic Forum also indicated the changes and the relocation of the GVC in the background of globalization, especially the role of China in the international trade21.
Based on the database of Trade in Value Added (TiVA) developed by the OECD and the WTO,ăasăshownăinăGraphă7,ăinăChina’săUSDă372.3ăbillionăexportătoătheăEUăină2008,ătheădomestică value added took USD 256.6 billion, and import took USD 115.7 billion. The double calculation of the import to the export took 31șăofătheăChina’săexportătoătheăEU.ăSimilarlyăinăChina’săUSDă299.3ăbillionă import from the EU, the import going to the domestic final demand took USD 136.3 billion, and the USD 163 billion did not go into the domestic final demand which became part of the processing trade and went to the export again. The double calculation of the import to the export took 54% of the China’să importă fromă theă EU.ă Ină otheră words,ă closeă toă 1/3ă ofă theă China’să exportă toă theă EUă wasă contributed by the import, and more than 50% of theăChina’săimportăfromătheăEUăwasăusedăforătheăre -export. Graph 7 clearly explores the defect of the traditional trade statistics in the GVC environment.
SuchăkindăofădoubleăcalculationăbringsătheădirectăimpactătoătheăChina’eătradeăsurplusăwithătheă EU. ShownăbyăGraphă8,ăbasedăonătheăTiVAădatabase,ătheăChina’sătradeăsurplusăwithătheăEUăină2008ă was USD 172 billion, in which USD 51.7 billion was double calculated, which took 30% of the China’sătradeăsurplusăwithătheăEU.ăTheădoubleăcalculation went to 33% in 2009.
Graph 7 Value Added in China-EU Trade
0 100000 200000 300000 400000
1995 2000 2005 2008 2009
FDDVA EXGR FDFVA IMGR
19
Fredrik Erixon, Back to Basics: Economic Reforms and EU-China Relations, ECIPE Bulletin No. 09/2012. 20YeăWenjia,ăYuăJinping,ăAnăEmpiricalăstudyăonătheăEU’săFDIăinăChinaăandătheăChina
-EU trade relations, The World Economic and Political Forum, No.4, 2008, p27.
21
52
Source: TiVA, OECD-WTO. Note: FDDVA means domestic value added embodied in foreign final demand, EXGR means gross export, FDFVA means foreign value added embodied in domestic final demand, IMGR means gross import.
Graph 8 Domestic Value Added in the China’s trade surplus with the EU
0
50000
100000
150000
200000
1995
2000
2005
2008
2009
TSVAFD
TSGR
Source: TiVA, OECD-WTO. Note: TSVAFD means value added in final demand in surplus, TSGR means gross trade surplus.
Hence, the trade imbalance issue between China and the EU is far beyond the bilateral level to some extent. The EU not only needs to simply face the challenge from China, but also the challenge from the deepening economic integration in the East Asia, as well as the challenge to the trade policy brought by the economic globalization.
As long as the trade imbalance increases, the trade disputes between China and the EU were intensifying. China has become the biggest target country of the EU trade defense system in recent years.22
Issue on the Market Economic Status
When we review the past 10 years of the China-EU Comprehensive Strategic Partnership, the China’săMarketăEconomicăStatusă(MES)ăissueăisănegligible.ăInăalmostăeachăofătheăChina-EU Summits in the past 10 years, the issue has been mentioned all the time. China also has invested huge diplomatic resources in this regard and initiated a diplomatic action in 2003 to get the EU and the US provide the MES to China. The action has not succeeded till now.
The MES issue in China-EU relations is a totally different terminology from the market economy. The MES issue is only limited to the EU anti-dumping procedure, which can be traced back toăChina’sănegotiationăofăjoiningătheăWTO.ăDuringătheăprocessăofănegotiationătheăMESăclauseăalreadyă existedăinăsomeăWTOămembers’ăanti-dumping legislation. Based on the GATT Article 6 and its notes, and based on the requirement of these members, the negotiating parties reach a consensus which indicatesă thată theă membersă ofă WTOă cană affirmă China’să non-MES with conditions during the anti-dumpingăinvestigationsătowardăChina’săproducts,ăandăhaveăaărightătoăchooseăaăpriceăfromăaăreplaceă country (third country) to ascertain the dumping damage. The consensus also indicates that such kind of practice will be terminated after 15 years of China joining the WTO, which means beyond 23 December 2016 the WTO members cannot apply the price of replace country to ascertain the dumping damage during the anti-dumpingăinvestigationăonăChina’săproducts.ăThisăconsensusăhadăbeenăwrittenă intoătheăChina’săAccessionăTreaty with WTO as Article 15. Except for this Article, no WTO rules or
22
53
China’săaccessionădocumentăhasădoubtăonătheămarketăeconomyăsystemăofăChina.ăItămeansăthatăexceptă for the anti-dumping procedure, China has no necessity to be recognized as a market economy by other countries and, at the same time, even if to be recognized as a market economy country, it has no furtheră means.ă Theă WTOă doesă notă requireă theă “identity”ă ofă aă marketă economyă country,ă otherwiseă China would not be accepted as a member of WTO. In sum, MES is only limited to the anti-dumping investigation procedure towards Chinese products, and for more accuracy, it refers to whether the MES treatment will be provided to the producer during the anti-dumping investigation. It is no necessity to extend theăissueătoăwhetherărecognizeătheăachievementăofăChina’săeconomicăreform,ăorătoă whetherăChinaăneedsătoăjoinătheă“marketăeconomy”.ăToăaccomplishătheăfullăsocialistămarketăeconomyă is a political target set by China itself which requires no needs of other countries recognition. UnfortunatelyăChinaăhasăinvestedăhugeădiplomaticăresourceătoăgetăEUărecognizingăChina’săMES,ăandă made China-EU relations followed a zigzag course.
It is true that there is a great negative impact for Chinese producers and exporters when they are treated as non MES. Before 2004, the value of EU anti-dumping cases toward China was not big, andătookălessăthană1șăofăChina’săexportătoătheăEU.ăInărecentăyears,ătheăvalueăofătheăanti-dumping cases has gone up dramatically. The case of wireless data modem in 2010 involved more then USD 4 billion,ăandătheăcaseăofăsolarăpanelăină2012ăinvolvedămoreăthanăUSDă20ăbillion,ă7șăofăChina’săexportă to the EU.
AccordingătoătheăChina’săAccessionăTreatyăwithăWTO,ăbyă23ăDecemberă2016ăEUăwillăstopătheă method of anti-dumpingăinvestigationăapplyingătheăreplaceăcountryătowardăChina’săproducts,ăwhetheră the EU provides the MES to China or not. As the date is approaching, the importance of the MES issue in China-EU relations is declining. The EU well understood the situation, and when China showed less interest in the negotiation with the EU on MES in 2007, the EU suggested new solution in order not to lose the weight and attract China to continue the negotiation. The new suggestion was to provideăMESătoăChina’săcertainăenterprises and sectors if they meet the requirements. The negotiation between China and the EU turned to full MES negotiation.
There is no interconnection between providing China with MES and the number of EU anti-dumping cases toward China. Even if the EU would provide full MES to China, it would not stop the EU to apply anti-dumping procedure. Besides, the anti-dumping is one of the trade defense measures of the EU, the EU can apply the measure of anti-subsidy. MES is not the panacea to solve all the problems in China-EU trade relations. There are so many fields and opportunities China and the EU canăcooperate,ăChinaăhasănoăinterestătoă“makeăgreatădeal”ăwithătheăEU,ăandăalsoăChinaăhasănoănecessityă to make MES as an obstacle for further developing the bilateral relations.
Conclusions and Future Challenges
54
opportunities and promoting stable development of the external trade. Ten years ago the EU market hasăbeenătheăsourceăofăeconomicăgrowthăforăChina,ăandănowăChina’sămarketăalsoăisăaăpotentialăsourceă forăEU’săeconomicăgrowth.ăTheăChina-EU trade and economic relations is too big to fail.23
In order to keep the dynamic pace of past ten years in the bilateral trade, both China and the EU need to find new strategy to check the pressure of protectionism and express the mutual concerns. It needs both sides to assess the reality, adjust the strategic position and shift the mentality.
Ită isă trueă thată China’să tradeă relationsă withă theă EUă ină theă pastă tenă yearsă hadă reachedă considerable progress, and even would replace the US to become the biggest trade partner of the EU. At the same time we also see the weakness at the institutional level in China-EU trade and economic relations. The dynamic trade growth reflects to some extent the spontaneous development, and both China and the EU had no adequate preparation for the dynamic trade jump, and there is lack of efficient mechanism to lead the trend.
Regarding the high level dialogue, the China-EU High Level Trade and Economic Dialogue (HED) took place in 2008, 2009 and 2010. Since then no HED till the November 2013. The trade and economic relationship is the cornerstone of the China-EU relations. The EU is the biggest trading partner of China, and the biggest export market in the latest 8 years. In the recent years China-EU trade volume is closing the EU-US trade volume, China has the chance to replace the US and becomes the biggest trade partner of the EU. At the same time, the EU is also the biggest technology source for China,ăandăChina’săinvestmentătoătheăEUăisăincreasingădramaticallyărecently.ăSuchăkind of dynamic and colorful development did not receive active response from the high level decision makers either from China or the EU. Bilateral trade goes as it goes. The consequence of such gravity development is the trade disputes between China and the EU intensify at one hand, and the EU and the US start the TTIP negotiation and the EU shows stronger intension on developing trans-Atlantic relationship at the otherăhand.ăBesides,ăChinaăisăoutăofătheăEU’săglobalăFTAăstrategyăandăshunnedăbyătheăEU.
Regarding on the working level dialogue, there are more than 50 sectoral dialogue between the EU and China. It is astonishing that among so many working level dialogue there is no mechanism on pre-warning, which could effectively express the mutual concerns and control the disputes in bilateral trade and economic relations. During the PV dispute, Chinese Primer Li Keqiang had initiated a personal call with the president of the European Commission Jose Barroso on 4 June 2013. The telephone call case although indicates the highest concerns of the Chinese government on the PV dispute, it also reflects the embarrassing situation of the so many sectoral dialogue, which means lack of efficiency of the dialogues. As the trade disputes intensify in the recent years, there is a need for China and the EU to establish an pre-warning mechanism as soon as possible.
Regarding on the actors of the dialogue, the dialogues between China and the EU are mainly among the government bodies, the officials, the executives, and there is a lack of the enterprises actively involving in the dialogues. There is an urgency to attract more enterprises into the sectoral and policy dialogues.
Regarding the legal framework, the bilateral trade agreement is still remained in the framework signed in 1985. The deadlock of the China-EU PCA negotiation affected the renewal of trade agreement. The PCA approach was led by the EU which devotes itself to bind economy with politics and to promote political change with trade and economic measures. The purpose of such approach relies on ideology and aims at encouraging political democracy and social development in
23
55
theă partneră country.ă Theă EU’să PCAă approachă isă notă ină accordanceă withă realityă ofă theă China-EU relationship. In recent years the EU initiated the Bilateral Investment Treaty (BIT) with China, which would be a condensed version of PCA in some extent, and also helps the European Commission to materialize the investment competence as required in the Lisbon Treaty. The ambitious of the BIT negotiation indicatesătheăEuropeanăCommission’sădilemma.ăAtătheăoneăhand,ătheăECăwouldălikeătoăpută everything into the BIT basket which is far beyond a traditional investment agreement. And if the chapters on elimination of customs, cooperation of custom service and sanitary regulations would be included in the BIT, it would be a perfect FTA agreement which the EU avoided to response, at the other hand. The European Commission has the difficulty to decide what they exactly want.
Looking forward to the next ten years of the China-EU relations, China should try to transform the approach led by the EU, shift the passive status in the bilateral trade agenda, focus more on substance instead on forms, and to construct a new way of thinking on China-EU economic and trade relations. The 16th China-EU summit held in 21-22 November 2013 proves new achievements. The leaders released the China-EU 2020 Strategic Agenda for Cooperation, announced the start of the BIT negotiation, agreed to actively explore the implementation of a feasibility study on China-EU FTA, and strive to make trade value reach one trillion USD by 2020.
References:
1. CHEN Xin, Policy Evolution of the China-EU Trade and Economic Relationship, in Piata Chinei: Provocari si Oportunitati Pentru Romania si Uniunea Europeana, Academia Romana, Insitutul de Economie Mondiala, Bucharest, 2009.
2. CHENă Xin,ă Newă Trendsă ină EU’să Economică Relationsă withă China,ă Theă Globală Economică Observer, no.1, 2013, Bucharest, 2013.
3. Fredrik Erixon, Back to Basics: Economic Reforms and EU-China Relations, ECIPE Bulletin No. 09/2012.
4. MarcinăZaborowskiăedit,ăFacingăChina’sărise:ăGuidelinesăforăanăEUăStrategy,ăChaillotăPaperă No.94, EU Institute for Security Studies (EUISS), Paris, December 2006,
5. UNCTAD, Global Value Chains: Investment and Trade for Development. World Investment Report 2013, UNCTAD 2013.
6. WTO, Trade patterns and Global value chains in East Asia: From trade in goods to trade in tasks. WTO 2011.