On objectivity and validity of oral
examinations in psychology – A replication
Carmen Hagemeister
1& Karl Westhoff
2Abstract
A hierarchy of requirements applying to practising psychologists is the basis of a concept for oral examinations in psychological assessment. A study on the objectivity of oral examinations was replicated. We found very high correlations between the evaluations of examiner and assessor and high correlations between the examinees’ evaluations after the exam. Examinees’ self-evaluations before the examinations correlated at about 0.48 with the marks in the oral examina-tion. The results concerning preparation do not uniformly show that preparation in a group and mutual examination lead to better marks compared to preparation alone.
Key words: oral examination, examination, objectivity
1
Correspondence concerning this article should be addressed to: Carmen Hagemeister, PhD, Institute of Psychology II, Technische Universität Dresden, 01062 Dresden, Germany;
email: [email protected]
2
Oral examinations are taken in many fields. For decades they have been the subject of criticism (summarized e.g. by Birkel, 1984), one argument being that agreement between different boards of examinations, i.e. the objectivity of evaluation, is low. In psychology, different results have been found concerning the objectivity of oral examinations: Trim-ble (1934) and Preiser (1975) found that oral exams in psychology are relatively objec-tive. Dienst and Armstrong (1988) found a moderate objectivity, while Engvik, Kvale, and Havik (1970) assessed the objectivity as non-satisfactory. Novy, Kopel, and Swank (1996) were the first to study the psychometric features of oral exams for licensing in psychology. All these studies taken together lead to the conclusion that oral exams in psychology are not, by nature, highly objective. A former study (Westhoff, Hagemeister, & Eckert, 2002) showed that a high degree of agreement between examiner and assessor and sufficient agreement with the examinee after the exam can be reached when explicit evaluation rules are used and the exam is sufficiently structured. Our aim in this study is to replicate these results with a larger data set and a second examiner. A further aim is to add considerations on the content validity of oral examinations and their respective re-sults.
The general exam regulations for psychology (currently Rahmenordnung, 2002) give only a very rough and short description of the content of the subjects of psychology. The departments at the universities decide on the form and duration of the exam; the chair on its content. Irrespective of these decisions, students and potential employers have a right to demand that the exam is as objective as possible. As the content is not defined pre-cisely, objectivity between examiners from different universities cannot be expected, but should be ensured within a chair in order to guarantee fairness for the students. Several prerequisites must be met to achieve this goal.
1). These criteria were defined by the second author about 25 years ago and were used by all persons working in his group.
Examinations should be a content-valid representation of the universe of learning tasks. In order to make examinations transparent and fair, this universe should be known to the students so that they can use this information to prepare for the exam. Before the exam the students should be able to judge to what extent they have covered the different topics of this universe and how deep their knowledge is. This should allow them to predict their mark, admittedly with some uncertainty as they cannot predict whether the examiner will ask questions on a topic they are good at or on one they are not so good at. In our former study the correlation between students’ self-assessment before the exam was rho = .23 and .33, which may indicate that the students only have a very vague idea of how well they are prepared for the exam. Another less likely explanation for the low correlation is that the students are unwilling to put their honest self-assessment down on paper for some reason, e.g. superstition, but instead deviate from it in either direction. The students can only use the system to prepare themselves better for the exam if they know it – and this is the reason why this correlation is of practical importance. Accordingly, we inform them about the system in the first lecture in assessment, in the courses over the next two semesters, and in the consultation for the exam at the end of each semester. As we have intensified our efforts in this respect since the last study, we expect the correlation be-tween students’ self-assessment before the exam and the final mark to have improved since the former study.
If the students know the universe of learning tasks, they can compare this universe with their answers after the exam. After the exam, they know which questions were asked, which is something they did not know beforehand. Therefore they should then be able to tell their mark more precisely than before the exam. Assuming that the questions were clear and that the students were not particularly badly-informed or badly-prepared, this should even be possible if they were unable to provide the information in the exam. If the students can tell the mark they got, this shows that the exam was content-valid and the questions were clear. In our former study, the correlation between the students’ self-assessment after the exam and the final mark was rho = .68 and .73, which is satisfactory considering the fact that the students do not have many resources left for self-assessment during the exam, and all except excellent students might not always be sure whether their answer was right. We expect to be able to replicate this correlation as well.
Learning in a group leads to better results than learning alone (Springer, Stanne, & Donovan, 1999). A meta-analysis for undergraduates in science, mathematics, engineer-ing and technology showed that the effect was even greater when achievement was measured with instructor-made exams or grades than with standard instruments. Good preparation means that one not only knows the facts but is also able to present them to the examiner in a correct, clear and – if one wants to achieve the levels “good” or “very good” – in a structured form. This is best practised by telling the facts to another person, who then provides feedback on whether the reproduction was correct and clear. The best available substitute for the examiner and assessor is a fellow student who is well-informed. This is usually the case when the other student is preparing for the same exam. In our former study, we found that students who had prepared with one or more other students got better marks than students who had prepared alone. We expect to be able to replicate this result. We assume that two processes contribute to the superiority of prepa-ration in a group. Firstly, the students become aware that they do not know some of the facts – this happens when they attempt to reproduce the facts. This kind of reproduction does not necessarily require another student, but is more likely and easier in a group than when learning alone. Secondly, if they ask each other questions, they may discover gaps in their knowledge they had not noticed before. To make this possible, it is usually nec-essary to have another competent person asking the questions. In other words, we expect students to benefit from a learning partner or group, and more so if they (cross-)examine each other. The third reason is that in a mutual examination the students learn to express themselves in a more precise and structured way, which is also helpful preparation for an exam.
A test is considered as fair if persons belonging to different groups are not discriminated, e.g. based on their gender (Testkuratorium, 1986). As all psychology students have to pass the same approval procedure there is no reason to assume that men and women differ in their ability. For this reason they should not differ in their marks.
Methods
The marks
The exam consists of the three parts “Standardized methods/procedures”, “Partly stan-dardized methods/procedures” and “Deciding in assessment”. Each part takes about ten minutes. The exam as a whole should last between 25 and 35 minutes. The final mark is the mean of the three marks for the parts, with one exception: if students fail one part they fail the exam as a whole. As far as we know such an explicit system is not usually used in oral examinations in psychology. For this reason we assume that generalisation from our results to any oral exam is not possible but is limited to oral examinations with explicit scoring systems.
The system of marks
During our study the marking system was changed at the Department of Psychology. Initially there were the five marks mentioned above. Then a more differentiated system was introduced: Marks still range between 1 (the best possible mark) and 5 (the worst possible mark, i.e. "failed") but can now be increased or lowered by 0.3 by adding ‘+’ or ‘-’. The marks 0.7, 4.3 and 4.7 cannot be awarded.
The examination procedure
The examinees
At Dresden University of Technology, all students of psychology must take the exam in the subject “Psychological Assessment and Intervention” for their diploma. The first opportunity is after three and a half years. For this study, we used the data of all students who provided information for all questions asked. Very few refused to take part in the study; a few others who were very disappointed by their result (most of them failed the exam) were not able to participate in any kind of conversation afterwards.
The analyses were conducted and the results are reported for six subsets of the data. Potential influences can be expected from (1) the person of the examiners (who were the authors of this study), (2) whether the student was taking the exam for the first time or was repeating it for the first, second or third time, (3) the simple vs. differentiated mark-ing system. Only those combinations with at least 30 observations are reported in detail. All combinations are shown in Table 1.
Table 1:
Combinations of examiner, marking system and number of exam
Examiner 1 Examiner 2
marking system exam
number males free shots number males free shots
1st 518 18% 75% 22
2nd 122 21% 2% 2
3rd 13 simple
4th 1
1st 210 15% 81% 131 14% 79%
2nd 33 3% 3% 30 10% 0%
differentiated
3rd 1 1
Note. The numbers depict the number of examinations for this combination. For those combinations which are reported in the results section the percentage of men is reported and for the first and second examinations the percentage of free shots.
Examiners and assessors
Results
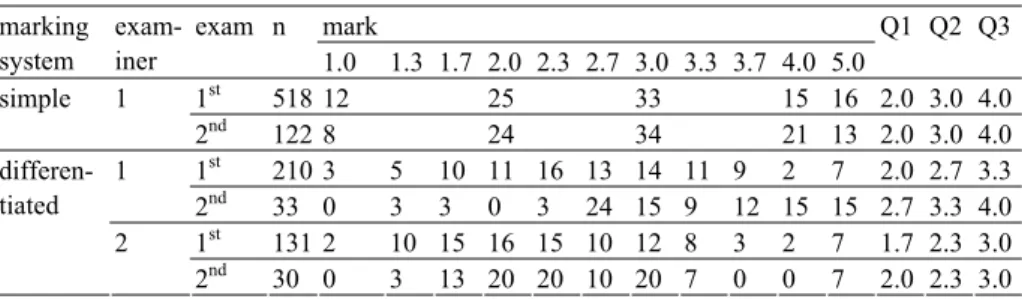
Table 2 shows the distribution of marks for the exams in the simple and the differentiated marking system. The marks cover the possible range with mean values between 2.7 and 3.4 for the six subsets analysed.
Table 2:
Percentage of each mark, first (Q1), second (Q2), and third quartile (Q3) of the marks per marking system, examiner, and number of examination
mark marking
system
exam-iner
exam n
1.0 1.3 1.7 2.0 2.3 2.7 3.0 3.3 3.7 4.0 5.0
Q1 Q2 Q3
1st 518 12 25 33 15 16 2.0 3.0 4.0 simple 1
2nd 122 8 24 34 21 13 2.0 3.0 4.0 1st 210 3 5 10 11 16 13 14 11 9 2 7 2.0 2.7 3.3 1
2nd 33 0 3 3 0 3 24 15 9 12 15 15 2.7 3.3 4.0 1st 131 2 10 15 16 15 10 12 8 3 2 7 1.7 2.3 3.0 differen-
tiated 2
2nd 30 0 3 13 20 20 10 20 7 0 0 7 2.0 2.3 3.0
Inter-rater reliability and content validity
Table 3 shows the correlations between the evaluations of examiner and assessor, and self-evaluation before and after the exam. For the six subsets, the inter-rater reliability varied from rho = .92 to .98. The mark awarded correlated with the examiner’s evalua-tion with rho = .94 to .99 and with the assessor’s evaluation with rho = .96 to .99. The mark awarded correlated with the examinee’s self-assessment after the exam with
rho = .67 to .88 and with rho = .27 to .49 with his or her self-assessment before the exam. Table 4 shows the cross-tabulation between final marks and students’ self-evaluations before the exam administered by Examiner 1 and with the simple marking system. This cross-tabulation is typical for the other cross-tabulations as well and shows that the low correlation is caused by incorrect expectations regarding all levels of per-formance.
Table 3:
Rank correlations between evaluation by the examiner (examiner) and assessor (assessor), final mark (mark), self evaluation after (after) and before (before) the exam per combination
of examiner, marking system and number of exam
examiner assessor mark after
no. exam 1s 1d 2d 1s 1d 2d 1s 1d 2d 1s 1d 2d
1st 95 96 96
assessor
2nd 92 98 98
1st 97 98 99 97 98 98 mark
2nd 94 99 98 96 99 98
1st 79 84 86 78 81 89 79 83 88 after
2nd 70 74 72 68 75 75 67 75 76
1st 45 48 38 45 48 38 46 47 37 57 61 39
before
2nd 28 46 48 29 48 50 27 47 49 31 73 62
Note. examiner / marking system 1s = Examiner 1, simple marks (n = 518 first exams, n = 122 second exams); 1d = Examiner 1, detailed marks (n = 210 first exams, n = 33 second exams); 2d = Examiner 2, detailed marks (n = 131 first exams, n = 30 second exams).
Table 4:
Cross-tabulation between self-evaluation before the exam and final mark for the first exams with Examiner 1, simple marking system, n = 518
self-evaluation before the exam sum
final mark 1 2 3 4 5
1 13 36 11 3 63
2 7 68 45 7 127
3 2 60 91 17 1 171
4 15 43 15 3 76
5 12 42 23 4 81
sum 22 191 232 65 8 518
Note. Matches are printed bold.
Table 5:
Quartiles of final mark and self-evaluations before and after the exam for the conditions where differences were found
Quartiles marking
system
examiner exam N
1st 2nd 3rd
final mark 2 3 4
self-evaluation before exam 2 3 3
simple 1 1st 518
self-evaluation after exam 2 3 4
final mark 2.0 2.7 3.3
self-evaluation before exam 2.0 2.7 3.0
1 1st 210
self-evaluation after exam 2.3 2.7 3.3
final mark 1.7 2.3 3.0
self-evaluation before exam 2.0 2.7 3.0 differentiated
2 s1st 131
self-evaluation after exam 2.0 2.7 3.0
Correlations with preparation, exam duration and student attributes
As the correlations between the evaluations of examiner and assessor and final marks are very high, only correlations with the final marks are reported here. Table 6 shows the corre-lations between marks and duration of exam, duration of preparation for the exams, gender and free shot. The correlations between gender (men coded as 1, women as 2) and marks awarded are zero (ranging from rho = -.11 to .06). When students take their first exam, the marks in “free shots” are slightly worse: rho = -.30 to -.22. As the number of students taking a “free shot” in the second exam is very low, analyses cannot be calculated here.
The correlations between duration of the exam and marks are between rho = -.23 and .00; there is a very slight tendency for longer exams to result in better marks. The examina-tion regulaexamina-tions specify that the exam should take 25 to 35 minutes as a rule. 97.9 per cent of the exams fall in this range; the others are longer (up to 41 minutes). Five correla-tions between preparation time and marks awarded are between rho = -.12 and .07; one correlation is rho = .58 (with n = 30).
Table 6:
Rank correlations between final mark (mark) and duration of exam in minutes, duration of preparation for the exams (weeks of 40 working hours – preparation), and gender and free
shot per combination of examiner, marking system and number of exam
duration exam preparation gender free shot no.
exam 1s 1d 2d 1s 1d 2d 1s 1d 2d 1s 1d 2d
1st 00 -03 -15 -12 -06 04 -06 -11 06 -22 -24 -30
2nd -23 -16 -17 07 05 58 -01 03 -05
Effect of preparation
We had categorized the kind of preparation beforehand and asked each student in which category his or her preparation fitted best. As the students’ answers told us that the cate-gories did not fit well to the way they had actually prepared, we changed the category system twice in the course of the study. (I) The first version was whether the students had prepared (a) alone, (b) with one other student or (c) in a group. (II) The next version was whether they (a) had examined each other in a group or (b) not. (III) The last version of the question was whether the students had prepared (a) alone, (b) with someone else or (c) with someone else and had examined each other at some time in the process of their preparation. As there is a difference between the first exam and any repetition, we only analysed the effect of preparation on the first exam. The Jonckheere-Terpstra test showed no difference between the conditions in Version I, i.e. alone, with one other student or in a group. In Version II students who examined each other while preparing for the exam received a better mark (median = 2.7, n = 332) than students who did not examine each other (median = 3.0, n = 202) (U-test with p ≤ .001). The Jonckheere-Terpstra test showed a difference with p ≤ .05 between the conditions in Version III: students who
prepared alone (median = 3.0, n = 76), in a group (median = 2.7, n = 50), and in a group with mutual examination (median = 2.7, n = 89). Two U-tests were calculated. They showed that the difference between preparing alone (quartiles 2.3., 2.7, and 3.7) and preparing in a group without mutual examination (quartiles 2.25, 2.3, and 3.0) and the difference between preparing in a group without and with mutual examination (quartiles 1.7, 2.3, and 2.7) were significant with p ≤ .05.
Discussion
The evaluation of the students’ performance was found to be extremely reliable in terms of the correlation between examiner and assessor. The correlation with the examinees’ evaluation after the exam is satisfactory and shows that the examinations are indeed a content-valid representation of the universe of learning tasks. The correlation with the examinee’s self-assessment before the exam has about the same magnitude as the cor-rected correlations for selection interview results and success in the job to be found in several meta-analyses (see for example r = .51 in Schmidt & Hunter, 1998). The results concerning preparation in a group and mutual examination show a tendency, namely that both lead to better results than learning alone.
Inter-rater reliability
of the questions. Both examiners try to stimulate a kind of “conversation” in the exam – i.e. by ensuring that each question is meaningfully related to the last answer and leads the thread a bit further. A typical starting question on Level 4 is “Please describe ... [a type of partly standardized procedure or method / a test / a model of deciding in assess-ments].” On Level 3, the exam proceeds with questions like “Can you describe ...in more detail / Can you tell me more about ....?” or questions addressing more detailed informa-tion. For example, for an interview type, questions addressing more detailed information might concern aim, field of application, qualification of interviewer, procedure of ques-tion generaques-tion, quesques-tion format, rating of answers, reliability, and validity. On Level 2, the typical starting question is “What are the similarities and differences between A and B?”, A being the topic with which this part of the exam started on Level 4, B being an-other type of partly standardized method, test or model. On Level 1, the typical question consists of an outline of a problem, depicted in few sentences, followed by the question “What would you do?”. This means that the current level of the examination is relatively clearly indicated by the formulation of the questions. This level may be mastered or not – the difference is the step of 1 expressed in the marks: if the question on the Level 3 is mastered the student gets a 3; if not, a 4.
Content validity
The correlation of marks awarded and the examinee’s evaluations after the exam ranged from rho = .67 to .88. Our earlier study (Westhoff et al., 2002) found correlations of
rho = .67 and .74, which is about the same magnitude. The cross-tabulations show that the relatively low correlations between final marks and the examinees’ self evaluations after the exam are not due to modesty on the part of the good students and overestimation of performance by the students who failed, but that incorrect self evaluations can be found on all levels. Deviations of more than one mark between the self evaluations after the exam and the final marks are rare. This indicates that the exams are a content-valid representation of the universe of learning tasks. The judgement shows that the students basically recognise the level of the exam and whether their answer was correct. This is true, though two facts make this judgement difficult for the students. Firstly, they do not necessarily know whether the content of the answer is correct. If they know the answer, they usually know that it is correct. Some exceptions occur when students use incorrect summaries. If they do not know the answer, they typically guess what might be correct. Secondly, on Levels 2 and 1, the students are not sure whether they are pursuing the right direction, with maximum subjective uncertainty on Level 1.
others, and that they cannot anticipate how the exam will proceed. Concerning the mean of the self-evaluation, there are some – small – differences between the self-evaluation and the final mark. In one of the six subsets the self-evaluation before the exam was better than the final mark, in two of the six subsets the self-evaluation after the exam was worse, and in two subsets the evaluation after the exam was worse than the self-evaluation before the exam. These comparisons show that before the exam the students have realistic expectations concerning the exam and how far their knowledge matches the demands. After the exam they are more critical concerning their performance. When asked for their self-evaluation after the exam some students start with a comment on what they did not know. Other typical comments are that they did not manage to present a topic as well as they had intended when preparing for the exam. The contrary – that students start commenting on what they knew – can be observed less often.
Fairness
The zero correlations between gender and marks awarded show one aspect of the fairness of the exams. There is no reason to assume that men and women who have to pass the same approval procedure in order to study psychology in Dresden differ in their abilities or motivation in any way which might affect their marks. Other aspects of fairness are shown by the correlations between duration of the exam and the mark, which were be-tween rho = -.23 and .00. The finding that there is a very slight tendency for longer ex-ams to result in better marks can be explained by the fact that the examiners like to be sure whether a student has mastered a level before going on to the next part of the exam. Five correlations between preparation time and marks awarded are between rho = -.12 and .07, one correlation is rho = .58 (with n = 30). This shows – as does the low correla-tion between students’ self-evaluacorrela-tions before the exam and the final marks – that stu-dents do not prepare for the exam in the best possible way. Due to the approval proce-dure for university entrance, the range of intelligence in psychology students is rather narrow. For this reason, the explanation that the cleverer students need and use less preparation time can be ruled out. As an anonymous reviewer pointed out we cannot rule out potential biases in the self report data.
Preparation
the same exam period are allowed to listen in on an exam.) These two extreme remarks show the range of how examinees understand a free shot.
Our results concerning preparation in a group are inconclusive. We changed our question several times. In Version I, we found no difference between preparation alone, with one, or with several other students. In Version II, examining each other led to superior results compared to preparing alone. In Version III, students who had prepared in a group with-out mutual examination got better marks than students who had prepared alone; students who had prepared with mutual examination got even better marks. Of course we cannot rule out differences in working style except preparation in a group between these groups, but our results hint at the fact that preparation which forces the students to express their knowledge leads to better results, which might be caused by better understanding or by better fluency of explanation or both.
References
Birkel, P. (1984). Beurteilung mündlicher Prüfungsleistungen [Evaluation of achievement in oral examinations]. In K. A. Heller (Ed.), Leistungsdiagnostik in der Schule (pp. 229-236). Stuttgart: Huber.
Dienst, E. R., & Armstrong P. M. (1988). Evaluation of students’ clinical competence. Pro-fessional Psychology: Research and Practice, 19, 339-341.
Engvik, H., Kvale, S., & Havik, O.E. (1970). Rater reliability in evaluation of essay and oral examinations. Pedagogisk Forskning: Scandinavian Journal of Educational Research, 4, 195-220.
Klauer, K. J. (1987). Kriteriumsorientierte Tests. Lehrbuch der Theorie und Praxis lehr- zielorientierten Messens [Criterion-referenced tests. Textbook of theory and practice in mastery-oriented educational measurement]. Göttingen: Hogrefe.
Novy, D. M., Kopel, K. F., & Swank, P. R. (1996). Psychometrics of oral examinations for psychology licensure: The Texas examination as an example. Professional Psychology: Research and Practice, 27, 415-417.
Preiser, S. (1975). Zur "Objektivität" mündlicher Prüfungen im Fach Psychologie [On "objec-tivity" of oral examinations in psychology]. Psychologische Rundschau, 26, 256-281.
Rahmenordnung für die Diplomprüfung im Studiengang Psychologie – Universitäten und gleichgestellte Hochschulen. (2002). Beschlossen von der Konferenz der Rektoren und Präsidenten der Hochschulen in der Bundesrepublik Deutschland am 05.11.2002 und von der Ständigen Konferenz der Kultusminister der Länder in der Bundesrepublik Deutsch-land am 13.12.2002. Retrieved February 12, 2009, from http://www.dgps.de/_download/ 2003/ro_psychologie_uni.pdf
Schmidt, F. L., & Hunter, J. E. (1998). The validity and utility of selection methods in per-sonnel psychology: Practical and theoretical implications of 85 years of research findings.
Springer. L., Stanne. M. E., & Donovan, S. S. (1999). Effects of small-group learning on undergraduates in science, mathematics, engineering, and technology: A meta-analysis.
Review of Educational Research, 69, 21-51.
Testkuratorium der Föderation deutscher Psychologenverbände. [Testkuratorium] (1986). Beschreibung der einzelnen Kriterien für die Testbeurteilung [Description of the criteria for test evaluation]. Diagnostica, 32, 358-360.
Trimble, O. C. (1934). The oral examination, its validity and reliability. School and Society, 39, 550-552.
Wass, V., Wakeford, R., Neighbour, R., & Van der Vleuten, C. (2003). Achieving acceptable reliability in oral examinations: An analysis of the Royal College of General Practitioners membership examination’s oral component. Medical Education, 37, 126-131.