www.clim-past.net/5/551/2009/
© Author(s) 2009. This work is distributed under the Creative Commons Attribution 3.0 License.
of the Past
Glacial climate sensitivity to different states of the Atlantic
Meridional Overturning Circulation: results from the IPSL model
M. Kageyama1, J. Mignot2, D. Swingedouw3, C. Marzin1, R. Alkama1,4, and O. Marti1
1LSCE/IPSL, UMR CEA-CNRS-UVSQ 1572, CE Saclay, L’Orme des Merisiers, Bˆat. 701, 91191
Gif-sur-Yvette Cedex, France
2LOCEAN, Universite Pierre et Marie Curie, Case courrier 100, 4 place Jussieu, 75252 Paris Cedex 05, France 3CERFACS, 42 Avenue Gaspard Coriolis 31057 Toulouse, France
4CNRM, 42 av Coriolis, 31057 Toulouse cedex 1, France
Received: 22 December 2008 – Published in Clim. Past Discuss.: 18 March 2009 Revised: 6 August 2009 – Accepted: 6 August 2009 – Published: 30 September 2009
Abstract. Paleorecords from distant locations on the globe
show rapid and large amplitude climate variations during the last glacial period. Here we study the global cli-matic response to different states of the Atlantic Meridional Overturning Circulation (AMOC) as a potential explana-tion for these climate variaexplana-tions and their possible connec-tions. We analyse three glacial simulations obtained with an atmosphere-ocean coupled general circulation model and characterised by different AMOC strengths (18, 15 and 2 Sv) resulting from successive∼0.1 Sv freshwater perturbations in the North Atlantic. These AMOC states suggest the ex-istence of a freshwater threshold for which the AMOC col-lapses. A weak (18 to 15 Sv) AMOC decrease results in a North Atlantic and European cooling. This cooling is not ho-mogeneous, with even a slight warming over the Norwegian Sea. Convection in this area is active in both experiments, but surprisingly stronger in the 15 Sv simulation, which appears to be related to interactions with the atmospheric circulation and sea-ice cover. Far from the North Atlantic, the climatic response is not significant. The climate differences for an AMOC collapse (15 to 2 Sv) are much larger and of global extent. The timing of the climate response to this AMOC collapse suggests teleconnection mechanisms. Our analy-ses focus on the North Atlantic and surrounding regions, the tropical Atlantic and the Indian monsoon region. The North Atlantic cooling associated with the AMOC collapse induces a cyclonic atmospheric circulation anomaly centred over this
Correspondence to:M. Kageyama ([email protected])
region, which modulates the eastward advection of cold air over the Eurasian continent. This can explain why the cool-ing is not as strong over western Europe as over the North Atlantic. In the Tropics, the southward shift of the Inter-Tropical Convergence Zone appears to be strongest over the Atlantic and Eastern Pacific and results from an adjustment of the atmospheric and oceanic heat transports. Finally, the Indian monsoon weakening appears to be connected to the North Atlantic cooling via that of the troposphere over Eura-sia. Such an understanding of these teleconnections and their timing could be useful for paleodata interpretation.
1 Introduction
of these Dansgaard-Oeschger cycles occur, with Greenland interstadial peaks decreasing each time, until, during a sta-dial, a Heinrich event occurs again. Further studies of ma-rine proxies sensitive to the ocean ventilation (e.g.13C, El-liot et al., 2002) or circulation (e.g. paleomagnetic proper-ties of the marine sediments, see Kissel, 2005, for a recent review) show that the North Atlantic water ventilation and circulation strongly decreased during Heinrich events, but not so much during stadials. The Atlantic Meridional Over-turning Circulation (AMOC) has then been proposed to play a key role in rapid climatic changes both around and far from the North Atlantic, and in particular in the Southern Hemisphere and Antarctica (e.g. Blunier et al., 1998; EPICA community members, 2006). Other invoked mechanisms for glacial millennial climate variability include those related to sea-ice cover, especially in the Northern Hemisphere, and to changes in the characteristics of tropical interannual variabil-ity, which, at present, do have significant impacts on the ex-tratropical climate (for a complete review, see Clement and Peterson, 2008).
Our objective here is to investigate the most commonly invoked mechanism for this millennial glacial variability, namely the climate differences related to different states of the AMOC. We use a global coupled ocean-atmosphere gen-eral circulation model run under glacial boundary conditions to study the sensitivity of the AMOC to the fresh water bal-ance (or imbalbal-ance) imposed at the atmosphere-ocean in-terface and to study the climate differences related to three different states of the AMOC, which we briefly compare to available proxy records. Our main objective is to analyse the mechanisms for climate changes related to AMOC dif-ferences over 3 regions where the model compares qualita-tively well with data: the northern extra-tropics, the tropical Atlantic and Indian monsoon region.
1.1 Palaeorecords of of millennial-scale climate changes
Pollen records retrieved in marine sediment cores off the European coast, and in particular around the Iberian Penin-sula, show that simultaneous to abrupt changes in sea surface conditions, the composition of the vegetation on the nearby land changed significantly (Combourieu Nebout et al., 2002; S´anchez-Go˜ni et al., 2002; S´anchez-Go˜ni et al., 2008), with more forests during interstadials, characterized by relatively warm sea surface temperatures and more semi-desert or step-pic vegetation during stadials, characterized by relatively cold ocean surface conditions. Other types of continental records, such as the speleothem record from Villars Cave in Southwestern France (Genty et al., 2003), confirm the abrupt and large amplitude climatic and vegetation changes during the last glacial period. Schematically, these records suggest cold and dry stadials, and warmer and wetter inter-stadials over Southwest Europe. Additional information on the atmospheric circulation of this region has been obtained from a clay mineral record from the Alboran Sea
(Bout-Roumazeilles et al., 2007) which shows more export of dust from Morocco to the Mediterranean Sea during stadials and even more prominently during Heinrich events, which can be related to a more southerly circulation during these periods in this region. This signature associated with cold conditions over the North Atlantic constrasts with the warm, wet con-ditions found during Heinrich events on the other side of the Atlantic, in Florida (Grimm et al., 2006). This shows that even around the North Atlantic, the continental climate re-sponse to cold oceanic conditions which could be due to a weakening of the AMOC is far from being spatially homoge-neous. Furthermore, studying an apparent mismatch between reconstructions of the Greenland temperatures based on ice core and on snowline changes, Denton et al. (2005) show that abrupt climate variations are likely to be dependent on the season, with the strongest cooling occuring in winter.
Abrupt climatic variations have also been recorded, on the same type of time-scales as for the events occuring around the North Atlantic, away from from this region. Records from the tropical Atlantic (e.g. Cariaco Basin, Peterson et al., 2000; Gonz´alez et al., 2008) show dry events during Green-land stadials, while to the South of these sites, in North East Brazil, wet events are recorded (Wang et al., 2004). Taken together, these records can be interpreted as show-ing a southward migration of the Intertropical convergence zone (ITCZ) during stadials over the Atlantic Basin. This is confirmed for the other side of the tropical Atlantic by dusty events recorded off the northwestern African margin during Heinrich events (Jullien et al., 2007), which suggest southward shifts of the ITCZ during those events. Leduc et al. (2007) further suggest this southward migration to be associated with a decrease in moisture transport from the At-lantic to the Pacific, due to the topographic barrier of the An-des. The southward migration of the ITCZ during stadials is therefore supported by many records. Such a migration is also suggested for the Western Pacific during Heinrich events from records from North East Australia (Turney et al., 2004; Muller et al., 2008).
changes in atmospheric methane concentration recorded in ice cores both from Greenland and Antarctica (Blunier et al., 1998; EPICA community members, 2006).
In summary, millennial-scale variability, first revealed in records of North Atlantic surface conditions and in Green-land ice core records, is traced in many paleo-records around the world. Here we will examine if different states of the AMOC can be responsible for these teleconnections and if so, the mechanisms underlying these teleconnections.
1.2 Insights from numerical models: fresh water hosing
under present boundary conditions
Nearly from the time it was discovered, glacial abrupt cli-mate variability has been related to model results show-ing that the thermohaline circulation (here assimilated to the AMOC) is characterised by several equilibria (Stommel, 1961) and that transitions between these equilibria, i.e. be-tween situations in which the AMOC is slow or shut-down and situations with strong AMOC, can be rapid (Rahm-storf, 1994). Using an atmospheric-ocean coupled General Circulation Model (AOGCM) and, thanks to an anomalous freshwater input into the northern North Atlantic, forcing its AMOC from an “on” state, similar to the present one, to an “off” state, and back to an “on” state, Manabe and Stouffer (1995) show that it is possible to simulate an abrupt climate change in the North Atlantic, which they relate to be similar to the Younger Dryas (∼12 000 years ago). They show that a strong temperature anomaly develops over and around the North Atlantic in response to a weakening of the thermoha-line circulation but that no strong temperature anomaly de-velops elsewhere. This type of experiments, termed “water-hosing experiments”, have been run by many groups since then, with models of different complexities. Stouffer et al. (2006) compile the results from 14 models in which fresh water fluxes of 0.1 and 1 Sv are applied in the North Atlantic between 50 and 70◦N. All models simulate, to various de-grees, a weakening of the AMOC and a cooling of the North Atlantic in response to the 0.1 Sv fresh water flux, but some models also simulate a warming in the Nordic and/or Barents Sea. The response to the 1.0 Sv fresh water flux in the North Atlantic, Nordic Seas and Arctic Ocean is a general cooling, which is maximum over the North Atlantic and Nordic Seas between 50 and 80◦N. The cooling propagates over Eura-sia, but it is not as strong over North America. This shows the sensitivity of the climate response to different fresh water forcings and different states of the thermohaline circulation.
In terms of atmospheric circulation, the response to the 0.1 Sv anomaly shows that the North Atlantic sea surface temperature (SST) anomaly is associated with a cyclonic sea-level pressure anomaly, which constitutes a modulation of the mid-latitude westerlies. A weakening in the AMOC there-fore has an impact on the Northern Hemisphere stationary wave pattern. Vellinga and Wood (2002) show that this re-sponse appears within decades of their initial (very strong)
perturbation. They also obtain a cyclonic anomaly over the northern North Atlantic, with southwesterly surface wind anomalies over western Europe. This could explain why the temperature anomalies over this region are not as strong as over the North Atlantic: relatively warmer air is advected by the anomalous circulation forced by the North Atlantic cool-ing.
The SST response in areas remote from the North Atlantic is dominated by a warming of the South Atlantic and of the Southern Ocean. This follows the classical interhemi-spheric (bipolar) see-saw effect (Crowley, 1992; Stocker, 1998), which appears more prominently in the Atlantic. It creates, around the Equator, a temperature anomaly dipole, with colder waters to the North and warmer waters to the South when the AMOC is weaker. This dipole is associated with a southward shift of the ITCZ (e.g. Stouffer et al., 2006; Chiang et al., 2008). The development of such a dipole is due to a decrease in interhemispheric transport of heat by the At-lantic ocean. The atmosphere also plays a role. Chiang and Bitz (2005) and Yang and Liu (2005) show that an imposed cooling in the North Atlantic propogates towards the Equator and cools the SST to the South through a Wind-Evaporation-SST feedback (Chiang et al., 2008).
The Indian monsoon response to an AMOC weakening is consistent with a southward shift of the ITCZ. However, specific mechanisms have been suggested for the monsoon variations concomitant with the millennial scale events oc-curing in the North Atlantic. On the basis of observational data from 1871 to 2003, Goswami et al. (2006) propose that the Indian summer monsoon and Atlantic Multidecadal Os-cillation (AMO) could be linked via a modification of the meridional gradient of the temperature of the upper half of the troposhere (which they term “TT”). They show that for a warm North Atlantic, there is an increase in the merid-ional gradient of TT, which, in turn, favours a stronger mon-soon. Using a coupled ocean-atmosphere model on which they impose a positive sea surface temperature anomaly in the North Atlantic, Lu et al. (2006) show that in addition to the atmospheric connection via the TT meridional gradient, coupled ocean-atmosphere feedbacks in the Indian and West-ern Pacific Ocean help instensifying the monsoon. Indeed, the warm anomaly in the North Atlantic is associated with warm anomalies in the Indian and western Pacific oceans, which help producing more precipitation and induce an en-hanced monsoon circulation. Zhang and Delworth (2005) show that the weakening of the East Asian monsoon in their coupled GCM with a weaker AMOC is related to a change of the Pacific Walker circulation and the Rossby wave response to the resulting dampened convection over Indonesia acts to weaken the Indian monsoon.
1.3 Fresh water hosing in glacial conditions
greenhouse gas concentrations and ice-sheet extent and to-pography. On the other hand, millennial scale variability is largest during glacial times. Using the climate model of in-termediate complexity CLIMBER-2, Ganopolski and Rahm-storf (2001) show that a glacial climate is much more sen-sitive to fresh water fluxes in the North Atlantic than an in-terglacial climate. Using a fully coupled ocean-atmosphere general circulation model, Hu et al. (2008) show that when the Bering Strait is closed, the recovery of the AMOC from an “off” to an “on” state is slower, due to the fact that the fresh water introduced in the North Atlantic takes a longer time to be removed from this region when the Arctic and Pacific oceans are not connected. Bitz et al. (2007) also ob-tain a much slower recovery of the AMOC in a glacial world but instead ascribe it to more extensive sea-ice cover in the North Atlantic and Nordic Seas. Finally, Weber and Dri-jfhout (2007) show that the glacial AMOC is more sensitive to fresh water discharges than the present one, and that the recovery timescales from the collapse are much longer.
In terms of glacial surface climate response to a collapse in the AMOC, Ganopolski and Rahmstorf (2001), along with the follow-up studies of Claussen et al. (2003) and Jin et al. (2007), show a cooling of the North Atlantic, extending over Eurasia, and a smaller cooling over the Pacific and North America. The response in the Southern Hemisphere is an overall warming, consistent with the bipolar see-saw mech-anism. In addition, using the same model, Jin et al. (2007) show that the decrease in Eurasian temperatures associated with a weakening of the AMOC can be responsible for a weakening of the Asian monsoon. The thermal response to a collapse of the AMOC simulated by the HadCM3 fully coupled atmosphere-ocean general circulation model (He-witt et al., 2006) is broadly consistent with the results of the CLIMBER-2 climate model of intermediate complexity.
Using the coupled ocean-atmosphere model ECBILT-CLIO forced with full glacial boundary conditions, Timmer-mann et al. (2005) and Krebs and TimmerTimmer-mann (2007) in-vestigate the mechanisms for the teleconnections between the North Atlantic oceanic state and equatorial Pacific tem-peratures and salinities, during a transient meltwater pulse experiment in which the AMOC shuts down and recov-ers. Analysing fully coupled as well as partially coupled atmosphere-ocean simulations, they examine the respective roles of the atmosphere and the ocean in the response to the AMOC collapse. They find that the North Atlantic cooling associated with the AMOC collapse is advected downstream over the Eurasian continent and is largely responsible, on its own, for the atmospheric circulation changes simulated in their coupled experiments. This includes a weakening of the Asian monsoon and an intensification of the trade winds over the northern tropical Pacific, both related to changes in the meridional temperature gradient. In addition, the sea-level increase associated to the oceanic response has a global im-pact on the thermocline structure via a standing wave pattern. In the Western Pacific, this adjustment involves the transport
of cold and salty waters in the Pacific warm pool. The re-sponse is further amplified by the fact that trade winds inten-sify and precipitation decreases in this area.
Fl¨uckiger et al. (2008) use the same model to show that the surface climate response to an increase in AMOC is not linear with respect to the AMOC strength. In addition, the simulated surface climate response to an AMOC intensifica-tion is dependent on the season, with the high northern lat-itudes undergoing the maximum climate changes in winter while the differences over the mid-latitude Eurasian conti-nent are largest in spring due to a shift of the period of snow retreat. This, in turn, is responsible for an earlier break of the Siberian high pressure and an earlier setup of the Asian monsoon. The dependence of the climate response on the season has important implications for the interpretation of proxy data, as they are often more sensitive to the climate of one particular period of the year.
1.4 Objectives of the present study
Hence, to our knowledge, there are not many fresh water hosing experiments run in a glacial climatic context with fully coupled ocean-atmosphere general circulation models. In this study, we report on new results obtained with the IPSL CM4 model. We consider the surface climate sensi-tivity to a weak change in an active AMOC (18 vs. 15 Sv) and to a collapse of the AMOC (15 vs. 2 Sv). We first de-scribe the model and simulations (Sect. 2). Then we analyse the reasons for differences in the AMOC of the three simu-lations (Sect. 3.1) and briefly examine their impact on global heat transports (Sect. 3.2). In Sect. 3.3, we present the sig-nature of these AMOC states in terms of surface climate and compare it with the available paleo-records and in Sect. 4, we study the timing of the climate changes in the simulation in which the AMOC collapses. This leads us to postulate on mechanisms for these climate changes, which we investigate further for three regions: the northern extratropics, the trop-ical Atlantic and the Indian monsoon region (Sect. 5). This analysis is the main objective of the present study. It is not our goal here to compare the climatic sensitivity to changes in AMOC between the glacial and the present states. This issue is treated in a companion study (Swingedouw et al., 2009).
2 Description of the climate model simulations
ORCA2, which uses an irregular horizontal grid of 182×149 points with a resolution of ca. 2◦, refined over key regions such as the North Atlantic and near the Equator. This model has 31 depth levels. The sea-ice module is the Louvain Ice Model (LIM). The coupling of these components is per-formed using the OASIS (version 3) coupler.
The performance of the model in its representation of the modern climate is described in detail in Marti et al. (2009). At the resolution used in the present study, the AMOC simu-lated for pre-industrial boundary conditions is weak (11 Sv) but its strength increases with resolution. This bias is partly related to the fact that there is no convection in the Labrador Sea in this model, for these boundary conditions (Swinge-douw et al., 2007a). This is due to an excess of precipitation in the North Atlantic and North Atlantic westerlies located too much to the South (Marti et al., 2009). Nevertheless the model’s sensitivity to prescribed freshwater fluxes such as in Stouffer et al. (2006) is similar to other models (Swinge-douw et al., 2009), as is the case for its sensitivity to freshwa-ter fluxes in climate projections (Swingedouw et al., 2007b; Schneider et al., 2007).
In the present study, we analyse three simulations of the IPSL CM4 model with boundary conditions for the Last Glacial Maximum, as defined by the PMIP2 protocol (Bra-connot et al., 2007a, http://pmip2.lsce.ipsl.fr): we use the ICE-5G ice-sheet reconstruction (Peltier, 2004), CO2, CH4
and N2O atmospheric concentrations of 185 ppm, 350 ppb
and 200 ppb respectively (Monnin et al., 2001; Dallenbach et al., 2000; Fl¨uckiger et al., 1999), and orbital parameters relevant for 21 ky BP (Berger, 1978). The river routing has been adapted for Last Glacial Maximum (LGM) conditions (Alkama et al., 2007). The vegetation is kept at its present-day distribution.
With such an experimental set up, snow accumulates over the ice sheets and this freshwater sink has to be sated in order to obtain stable simulations. This compen-sation is performed in three latitude bands, with limits at 90◦S/50◦S/40◦N/90◦N. In each latitude band, the excess of freshwater accumulating as snow on the ice sheets, which we define as ”calving”, is integrated and supplied to the ocean in the same latitude band. The 40◦N limit roughly repre-sents the southernmost latitude reached by icebergs during ice ages. Freshwater fluxes due to calving collected North of this limit are delivered to the Atlantic and Arctic oceans but not to the Pacific since observations suggest that these are the regions were ice rafted detritus are most abundant. In spite of this procedure, the first LGM simulation performed with our model had a remaining imbalance in the freshwa-ter budget due to a slightly non conservative atmospheric convection scheme. Therefore two additional simulations in which the freshwater budget is closed using different meth-ods prolong this first, unbalanced, 200-year-long simulation: in LGMa, the bias is compensated by multiplying global pre-cipitations by 2.1% over the oceans. In LGMb, the “calving” flux is multiplied by 44% in the three latitude bands defined
above. Both methods lead to a closed fresh water budget at the atmosphere-ocean interface. LGMa has been run for 300 years and LGMb for 1000 years. An additional sensitivity experiment, LGMc, is performed, where the calving fluxes in the three regions defined above have been multiplied by 100% (as compared to 44% for LGMb). In this simulation, which has been integrated for 420 years starting from year 150 of LGMb, the freshwater balance is not closed.
In terms of differences of fresh water fluxes over the ocean, the largest differences between the experiments are in the North Atlantic/Artic region, which receives 0.08 Sv more fresh water in LGMb than LGMa, and 0.1 Sv more in LGMc compared to LGMb. These figures remain stable throughout the simulations. The differences in fresh water forcing are comparatively very small over the Austral Ocean: the calving is 0.012 Sv less in LGMb compared to LGMa and 0.015 Sv less in LGMc compared LGMb. Hence, even though our experiments do not follow the classical fresh water hosing experimental set-up, as described for example by Stouffer et al. (2006), the freshwater flux differences in the North At-lantic/Arctic regions are of the same order of magnitude as in many other fresh water hosing experiments (cf. Sects. 1.2 and 1.3), if not on the low side compared to the 1 Sv used in some extreme experimental set-ups.
It is not our goal here to perform a detailed comparison of our model results with Last Glacial Maximum paleo-data. Within the PMIP2 project, an earlier LGM simulation with the same model has been extensively compared to paleo-records and to other model results. This simulation of the LGM climate was very much in line with results from other models (e.g. Masson-Delmotte et al., 2006; Kageyama et al., 2006; Braconnot et al., 2007a,b; Ramstein et al., 2007; Otto-Bliesner et al., 2009). A surprising result from our LGMa or LGMb simulations compared to the pre-industrial one is the increase in AMOC. This is in contradiction with paleodata (e.g. Lynch-Stieglitz et al., 2007) but it is found in several models (Weber et al., 2007). In our model, it is partly related to its under-evaluation for the pre-industrial case. This was an additional motivation to obtain a LGM simulation with a collapsed AMOC, but a more detailed comparison between all the LGM simulations presented here and the pre-industrial basic state is left for a forthcoming study, as our goal here is to better understand the differences between these three LGM simulations.
3 Large-scale oceanic and climatic adjustments of
the AMOC to different freshwater perturbations
3.1 Evolution of the AMOC and North Atlantic deep
water formation
0 200 400 600 800 1000 0
5 10 15 20
time (years)
max AMOC (Sv)
Fig. 1. Time evolution of the maximum of the Atlantic Merid-ional Overturning Circulation (in Sv, 1 Sv=106m3/s) in runs LGMa (black), b (red) and c (blue).
LGMa and LGMb present strong and stable AMOCs, with strengths of 18 and 15 Sv respectively, and strong North Atlantic Deep Water (NADW) formation that reaches the bottom of the North Atlantic Ocean in the northern mid-latitudes, the AMOC collapses to 2 Sv by the end of simula-tion LGMc (Figs. 1 and 2). We can therefore conclude that the atmosphere-ocean state in LGMb is probably close to a North Atlantic fresh water threshold for which the AMOC collapses: although the additional fresh water in the North Atlantic is rather small in LGMc compared to other fresh water hosing experiments, the AMOC collapses within 300 years. We therefore obtain two simulations with extreme AMOCs, one in the “on” state (LGMa) and one in the “off” state (LGMc) and a simulation (LGMb) with an active AMOC slightly smaller than the LGMa maximum. LGMa and LGMb are therefore reminiscent of Greenland interstadi-als, while the extreme LGMc simulation, especially at its end when the AMOC has completely collapsed, is to first order relevant for a comparison to a Heinrich event, e.g. Heinrich events 2 or 1 which are close to the LGM.
To understand the differences in the AMOCs of our sim-ulations, we further study the characteristics of the NADW formation. In LGMa, it essentially takes place North of New-foundland and South of Iceland (Fig. 2), immediately South of the winter ice edge, as well as in the Arctic Ocean be-neath the sea ice. Some relatively deep mixed layers are also detected along the Norwegian coast. In LGMb, deep water formation disappears from the Arctic Ocean while it tends to increase in the northern North Atlantic areas. Since this occurs simultaneously with a global reduction in AMOC strength, this suggests that deep water formed in the Arc-tic in the LGMa simulation actually plays an important role in this interhemispheric water transport. Figure 3 illustrates that in the Southern Labrador Sea, an anomalous mixed layer depth pattern, consisting in a southward shift of the convec-tion site (black contours) develops in LGMb compared to LGMa. This is associated with an increase of sea ice cover
in the northwestern part of the area (pink contours) that leads to negative anomalous ice to ocean freshwater flux due to brine rejection and thus to a net oceanic freshwater loss fur-ther South of this ice formation area (blue colours). This freshwater loss locally overwhelms the freshwater input due to the experimental set-up (not shown). Thus, surface water density tends to increase locally and this favours deep water formation. A similar process is at play Southwest of Iceland, although the sea ice anomaly and the ice to ocean freshwa-ter flux are much weaker. Along the Norwegian coast, deep water formation clearly decreases at around 75◦N while it increases locally around 65◦N. Indeed, in this area, sea ice cover, largely capping the ocean from intense atmospheric cooling and thus preventing deep water formation, is pushed by anomalous southerly winds and thus decreases around 65◦N while it increases further North (not shown). We will
show that the anomalous deepening of deep convection in this area has an important climatic implication.
Figure 4 (l.h.s.) illustrates the timescale on which these deep convection changes set up in LGMb. The shallowing of the mixed layer in the Arctic area (Site 5) and off the Norwegian coast (Site 2) settles within the first years of the simulation. On the other hand, changes in the Labrador Sea (Site 3) and in the Norwegian Sea’s southern site (Site 4) are delayed and settle after several decades. In these areas, the interannual variability also clearly increases. This suggests a link with a change in atmospheric variability but the cou-pled simulations make it difficult to isolate the exact mecha-nism. However, it raises the possibility for delayed climatic responses to changes in the North Atlantic freshwater budget that can have important regional consequences.
LGMa
−20 −10 0 10 20 30 40 50 60 70 −4500
−4000 −3500 −3000 −2500 −2000 −1500 −1000 −500 0
LGMb
−20 −10 0 10 20 30 40 50 60 70 −4500
−4000 −3500 −3000 −2500 −2000 −1500 −1000 −500 0
LGMc
−20 −10 0 10 20 30 40 50 60 70 −4500
−4000 −3500 −3000 −2500 −2000 −1500 −1000 −500 0
−4 −2 0 2 4 6 8 10 12 14 16 18
Sv
120
o
W
60o
W 0o
60
oE
120 o E 180
oW
LGMa
120
o
W
60o
W 0o
60
oE
120 o E 180
oW
LGMb
200 500 800 1100 1400 1700 2000
m
120
o
W
60o
W 0o
60
oE
120 o E 180
oW
LGMc
40 120 200 280
m
Fig. 2.Atlantic meridional streamfunction (l.h.s) and maximum mixed layer depth reached over the winter months (February to April) (r.h.s) for LGMa (top), LGMb (middle), LGMc (bottom), years 201–250 for LGMa and b, 521–570 for LGMc. The thick black line on the mixed layer depth plots shows the limit of a 10% sea ice coverage in March.
Msadek and Frankignoul (2009) who showed that the multi-decadal fluctuations of the AMOC are mostly driven by deep convection south of Iceland in this model under modern cli-mate.
3.2 Global heat transport adjustements
The shutdown of the AMOC in LGMc induces an impor-tant weakening in oceanic heat transport. The global merid-ional oceanic heat transport is reduced by more than 0.32 PW between 10◦S and 60◦N. This decrease is lower than the
100
o
W
8 0 o
W
60o
W
40o
W 20oW
0
o
−1.1e−04 −7.0e−05 −3.0e−05 1.0e−05 5.0e−05 9.0e−05
Fig. 3. Colours: ice to ocean winter (January-February-March) anomalous (LGMb–LGMa) freshwater budget (in kg/m2/s). Black contours: anomalous (LGMb–LGMa) winter (JFM) mixed layer depth. Continuous (dashed) contours show positive (negative) anomalies. Contour interval is 150 m. The contour of zero anomaly is omitted. Pink contours: anomalous (LGMb–LGMa) winter (JFM) ice coverage. Continuous (dashed) contours show positive (negative) anomalies. Contour interval: 0.1.
budget and no storage in any heat reservoirs. These hypothe-ses are scarcely verified (see also Swingedouw et al., 2009), and Fig. 5 shows that the Bjerknes compensation is not total: it amounts to ca. 64% in terms of meridional heat transport at 17◦N. Changes in ocean and atmosphere heat transports between LGMa and LGMb are small compared to those as-sociated with a collapse of the AMOC. At this scale, there is no compensation between the anomalies in oceanic and atmospheric heat transports.
3.3 Global surface climate adjustments
As expected from previous model results and from the heat transport changes discussed above, the North Atlantic Ocean is cooler when the AMOC is weaker. In LGMb, compared to LGMa (Fig. 6, middle), this cooling is only significant at mid-latitudes, is rather constant along the year and does not exceed 2◦C (Fig. 7). Cooling is also simulated over the northern continents at mid- to high latitudes, with significant anomalies only during autumn and winter. Eurasia is slightly cooler in LGMb compared to LGMa, with a maximum dif-ference of 1◦C centred over Eastern Europe. It is therefore surprising to obtain a warmer (by∼1◦C in annual mean)
sur-face air temperature over the Norwegian Sea, a feature which is mainly significant during the transition seasons (Fig. 7). This is linked to an anomalous warming of the ocean associ-ated with the reinforcement of the convective activity in this area. Finally, a cooling of around 1◦C is also found over the Southeastern Pacific and East of the Antarctic Peninsula.
The cold anomaly over the North Atlantic is associated with changes in the stationary waves, as shown by the pres-ence of a cyclonic anomaly over the zone of cooling. This structure can be traced from the sea surface to the 200 hPa level and is shown for the 500 hPa level on Fig. 8 (middle). If we compare the location of this cyclonic anomaly to the mean flow on Fig. 8 (top), we can see that it corresponds to a southward shift of the jet-stream, which is consistent with the cooling inducing the strongest meridional temperature gra-dient more to the South than its position in LGMa. This anomaly can explain that the North Atlantic cooling does not expand over western Europe, which undergoes southerly wind anomalies.
Over northern Eurasia, another cyclonic anomaly devel-ops, bringing cold air from the North over central and eastern Europe. This cyclonic anomaly occurs for autumn and win-ter, consistent with the cooling simulated over these regions for these seasons. It is not possible, from our experiments only, to determine if the cyclonic anomaly over the North Atlantic is responsible for the Eurasian cyclonic anomaly via a disturbance of the autumn and winter stationary waves, or if the Eurasian cyclonic anomaly develops as a response to the cooling over this area. However, the surface temperature anomaly and associated atmospheric circulation anomalies seem to act as if they sustain each other. The warming over the Norwegian Sea does not correspond to an anomaly in the sensible heat transport (which structure, not shown, is very similar to the 500 hPa wind), hence confirming the rather lo-cal mechanism, developed in Sect. 3.1, based on changes in sea ice cover and surface winds. Precipitation differences be-tween LGMa and LGMb are scarcely significant and will not be discussed further.
0 50 100 150 200 250 300 0
2000 4000
1. deepening around Irminger Sea
A B
0 50 100 150 200 250 300
0 1000 2000
2. shallowing off Norway (north)
A
B
0 50 100 150 200 250 300
0 2000 4000
3. deepening in Labrador Sea
A B
0 50 100 150 200 250 300
0 1000 2000
4. deepening off Norway
A B
0 50 100 150 200 250 300
0 2000 4000
5. shallowing in Arctic
A B
time (years)
B − A
100
o
W
80 o W
60o W
40oW
20oW
0 o
3.
1. 4. 2. 5.
C − B
100
o
W
80 o W
60o W
40o W 20oW
0 o
3. 1.
2.
−1100 −900 −700 −500 −300 −100 100 300 500 700 900 1100 m
0 50 100 150 200 250 300 350 400
0 1000 2000
1. shallowing around Irminger Sea
C
B
0 50 100 150 200 250 300 350 400
0 1000 2000
2. shallowing off Norway
C
B
0 50 100 150 200 250 300 350 400
0 2000 4000
3. shallowing in Labrador Sea
C
B
time (years)
Fig. 4.Timeseries of winter mean mixed layer depth (m) averaged over areas of anomalous deep convection (indicated on the maps below the time series). Black line: LGMa, red line: LGMb, blue line: LGMc. All annual time series have been low-passed filtered using a 5-point running mean.
warm up in LGMc compared to LGMb, while the eastern Pa-cific section of the Southern Ocean cools by as much as 2◦C. To conclude, a weak reduction of the AMOC from 18 Sv (LGMa) to 15 Sv (LGMb) is associated with significant tem-perature anomalies of regional extent, while a strong reduc-tion of the AMOC, from 15 Sv (LGMb) to 2 Sv (LGMc), has a global imprint on the mean annual temperatures. The temperature response is clearly not linear w.r.t the AMOC strength.
In terms of mean annual precipitation in LGMc compared to LGMb (Fig. 9, bottom), there is a significant drying of the North Atlantic mid-latitudes, Western Europe and the north-ern Mediterranean coast, by up to 0.6 mm/day, which repre-sents a 20% reduction in annual rainfall over these regions. The Gulf of Mexico and surrounding regions, as well as the Atlantic Ocean off Florida, also experience a major decrease in precipitation. The pattern of this anomaly, which strad-dles Central America over the adjacent Pacific and Atlantic oceans (Fig. 9), is not associated with an underlying tem-perature anomaly (Fig. 6). This suggests a change in atmo-spheric dynamics to be responsible for the large precipitation reduction. Over the Northeastern Pacific and the northwest-ern North American coast, the precipitation increases by up to 0.8 mm/day. Over the Indian sub-continent and surround-ing ocean, the rainfall also decreases, indicatsurround-ing a weakened Indian monsoon. Finally, the largest change in hydrological
-30 -20 -10 0 10 20 30
-180 -150 -120 -90 -60 -30 0 30 60 90 120 150 180 -90
-70 -50 -30 -10 10 30 50 70 90
-5 -4 -3 -2 -1 0 1 2 3 4
-180 -150 -120 -90 -60 -30 0 30 60 90 120 150 180 -90
-70 -50 -30 -10 10 30 50 70 90
-5 -4 -3 -2 -1 0 1 2 3 4
-180 -150 -120 -90 -60 -30 0 30 60 90 120 150 180 -90
-70 -50 -30 -10 10 30 50 70 90
Fig. 6.Mean annual surface air temperature (◦C). Top: LGMa; mid-dle: LGMb–LGMa; bottom: LGMc-LGMb. The differences have been masked where not significant at the 95% level in a standard Student-T test. The time averages are taken over years 201–250 for LGMa and LGMb, and over years 521–570 for LGMc. Note that al-though this figure (and all maps hereafter) shows present coastlines, all simulations have actually used LGM coastlines.
cycle is found in the tropical Atlantic where the ITCZ clearly shifts southward. Indeed, a drying centered at around 10◦N, the mean ITCZ location in LGMb, is accompanied by a wet-tening centered at around 10◦S and extending over eastern Brazil (cf. Sect. 5.2).
How do these climate differences compare to the proxy evidence of abrupt millennial scale variability presented in Sect. 1.1? As discussed above, if we want to test the hy-pothesis that the recorded climatic changes are indeed due to AMOC variations, simulations LGMa and b would best compare to interstadials, while LGMc would be relevant for a Heinrich event. Qualitatively, the simulated climatic changes between an AMOC-off state, such as in LGMc, and an AMOC-on state, such as in LGMa and b, are in agree-ment with the records (1) over the North Atlantic, Greenland and Europe, which experience a strong cooling and drying; (2) over the tropical Atlantic, which undergoes a clear south-ward shift of the ITCZ; (3) over the Indian Peninsula and surrounding ocean, which are characterised by a decreased Indian monsoon. However, our model does not simulate a decrease of the South East Asian monsoon (precipitation is similar over China in the three simulations). Furthermore,
although it does simulate an Atlantic bipolar see-saw, it does not produce a clear warming over Antarctica for a collapsed AMOC. Possible reasons for these discrepancies will be dis-cussed in Sect. 6. The mechanisms for climate changes over the northern extratropics, the tropical Atlantic and the Indian monsoon region, where our model results appear to be rele-vant for interpreting the proxy records will be discussed fur-ther in Sect. 5.1.
4 Timing of the response in the AMOC “off”
state simulation
The timing of the heat transport change while the AMOC weakens in LGMc is fast both for the ocean and for the at-mosphere. Figure 10 shows that it appears in both transports within a few decades. The global heat transport at 17◦N has decreased by more than 0.27 PW, i.e. a half of its final de-crease in around a 60 years. The dede-crease in oceanic heat transport is partly compensated by the atmosphere after a few years. This timing pleads for a very rapid atmospheric adjust-ment to the North Atlantic cooling as modelled by Yang and Liu (2005) and by Shaffrey and Sutton (2006).
We can compare this timing of atmospheric and oceanic transport changes to the timing of the appearance of surface climate anomalies. Indeed, the difference in annual mean surface temperature associated with a collapse of the AMOC depicted on Fig. 6 does not appear at the same rate in ev-ery region of the globe. Fig. 11 (top) shows, for each point, the year after which half of the final anomaly represented on Fig. 6 is reached, and for which the anomaly remains larger than this threshold for at least 50 years. The first re-gions which experience climate changes in LGMc compared to LGMb are the mid-latitude western and central North At-lantic and the coastal areas of the Arctic Ocean. In these regions, the threshold of 50% of the final response is reached in less than 60 years after the beginning of the run (regions in blue). By this time, the AMOC is reduced by about 30% (to ca. 10 Sv) and the Atlantic heat transport by half. Tempera-ture anomalies over in the North Atlantic from 30◦N north-ward, the Arctic Ocean, Greenland, Eurasia, pass the 50% threshold by 120 years (regions in green), suggesting a rel-atively fast adjustement of the continental temperatures to the oceanic changes via the atmospheric circulation. Further South, the tropical Atlantic off the African coast as well as Africa North of 10◦N pass the threshold at around the same
LGMb-LGMa DJF
-180 -150 -120 -90 -60 -30 0 30 60 90 120 150 180
0 30 60
90 LGMc-LGMb DJF
-180 -150 -120 -90 -60 -30 0 30 60 90 120 150 180
0 30 60 90
-5 -4 -3 -2 -1 0 1 2 3 4
LGMb-LGMa MAM
-180 -150 -120 -90 -60 -30 0 30 60 90 120 150 180
0 30 60 90
-5 -4 -3 -2 -1 0 1 2 3 4
LGMc-LGMb MAM
-180 -150 -120 -90 -60 -30 0 30 60 90 120 150 180
0 30 60 90
LGMb-LGMa JJA
-180 -150 -120 -90 -60 -30 0 30 60 90 120 150 180
0 30 60 90
LGMc-LGMb JJA
-180 -150 -120 -90 -60 -30 0 30 60 90 120 150 180
0 30 60 90
LGMb-LGMa SON
-180 -150 -120 -90 -60 -30 0 30 60 90 120 150 180
0 30 60
90 LGMc-LGMb SON
-180 -150 -120 -90 -60 -30 0 30 60 90 120 150 180
0 30 60 90
Fig. 7.LGMb–LGMa anomalies (l.h.s.) and LGMc-LGMb anomalies (r.h.s) in 2 m temperatures (in◦C) for the 4 seasons. The differences have been masked where not significant at the 95% level in a standard Student-T test. The time averages are taken over years 201–250 for LGMa and LGMb, and over years 521–570 for LGMc.
5 Sv. This suggests that either the Atlantic bipolar seesaw is quite slow to establish, or that the AMOC change needs to be strong enough for it to appear. Anomalies of the northern subtropics need an extra 30 to 60 years to reach the Equator. The anomalies over the small region of the North Atlantic south of Greenland and Iceland, i.e. near the main convec-tion sites (Irminger and Labrador Seas) in LGMb, only pass the 50% threshold at around year 240. This corresponds to the shut down of these sites (Fig. 4). Finally the Northeast-ern Pacific and NorthwestNortheast-ern America undergo the warming shown on Fig. 6 after up to 300 yrs, which excludes an ex-clusive role of changes in atmospheric stationary waves in setting up this temperature anomaly.
Over the North Atlantic and Western Europe, the timing of the precipitation response (Fig. 11, bottom) is generally very much in phase with the temperature one (Fig. 11, top). The precipitation anomaly passes over the 50% threshold before year 60 for the western and central North Atlantic, before year 150 for the rest of the mid-latitude North Atlantic and the latest response occurs over the Greenland-Iceland con-vection site by year 240. This suggests a direct role of tem-perature anomalies on precipitation, the most simple mecha-nism for this link being via a reduction in evaporation. This is further discussed in Sect. 5.1. This type of response also
30
-180 -150 -120 -90 -60 -30 0 30 60 90 120 150 180 0
-30 75
45
15
-15 90
60
30
5
-180 -150 -120 -90 -60 -30 0 30 60 90 120 150 180 0
-30 75
45
15
-15 90
60
30
5
-180 -150 -120 -90 -60 -30 0 30 60 90 120 150 180 0
-30 75
45
15
-15 90
60
30
Fig. 8. December-January-February 500 hPa winds (m/s). Top: LGMa; middle: LGMb–LGMa; bottom: LGMc-LGMb. The shad-ing indicated points for which changes in both components of the wind are significant at the 95% level in a standard Student-T test. The time averages are taken over years 201–250 for LGMa and LGMb, and over years 521–570 for LGMc.
Hence, the timing of the temperature and precipitation re-sponses to the AMOC collapse simulated in LGMc suggest: (1) over the northern extratropics, a fast (of order decades) re-sponse of the North Atlantic which propagates over Eurasia, but a much slower (of order centuries) response over North America; (2) a fast response of the Indian monsoon, which might be related to the fast adjustement over the Eurasian continent; (3) an adjustement of the tropical Atlantic con-sistent for temperatures and precipitation, which occurs on slightly longer time-scales. In the next section, we investi-gate the mechanisms underlying these climate changes for these three regions.
5 Mechanisms for the climatic response in the AMOC
“off” simulation over selected areas
Our objective here is to understand the major features of the annual mean changes due to a collapse of the AMOC shown on Figs. 6 and 9 and introduced in Sects. 3.3 and 4. In par-ticular, as indicated above, we will focus successively on the northern extratropics, the tropical Atlantic and the Indian
0 1 2 3 4 5 6 7 8 9
-180 -150 -120 -90 -60 -30 0 30 60 90 120 150 180 -90
-70 -50 -30 -10 10 30 50 70 90
-1.8 -1.4 -1 -0.6 -0.2 0.2 0.6 1 1.4 1.8
-180 -150 -120 -90 -60 -30 0 30 60 90 120 150 180 -90
-70 -50 -30 -10 10 30 50 70 90
-1.8 -1.4 -1 -0.6 -0.2 0.2 0.6 1 1.4 1.8
-180 -150 -120 -90 -60 -30 0 30 60 90 120 150 180 -90
-70 -50 -30 -10 10 30 50 70 90
Fig. 9.Mean annual precipitation (mm/day). Top: LGMa; middle: LGMb–LGMa; bottom: LGMc–LGMb. The differences have been masked where not significant at the 95% level in a standard Student-T test. Student-The time averages are taken over years 201–250 for LGMa and LGMb, and over years 521–570 for LGMc.
monsoon region. We will concentrate on the response to a strong AMOC perturbation. Unless explicitely indicated, all figures and discussion will relate here to differences LGMc-LGMb.
5.1 Northern extratropics
Fig. 10. Difference (LGMc-LGMb) in meridional northward heat transport at 17◦N by the atmosphere (in red) and the ocean (in black).
Europe, North of the Black Sea. This behaviour is more pro-nounced in winter and spring in the temperature response shown on Fig. 7. This is consistent with the atmospheric circulation behaviour, which is similar for winter and spring (cf. Fig. 8, bottom) but with much less pronounced stationary waves over Eurasia in summer and autumn (not shown).
The precipitation response over the North Atlantic and Eu-rope also depends on the season, partly because the precipita-tion in LGMb, as for the present observed situaprecipita-tion, is highly seasonal (not shown). Over the North Atlantic Ocean, the de-crease in precipitation is maximum, in extent and amplitude, in winter and minimum in summer. This drying is strongest over the eastern side of the basin, where the cooling is also the largest. This points to a simple relationship between North Atlantic temperature and precipitation anomalies, via a decrease in evaporation (Fig. 12). Over the northern Mediter-ranean area, the decrease in precipitation is strongest in win-ter, while in western to central Europe, North of the Mediter-ranean Sea, the drying is strongest in autumn. For these two regions, the strongest response therefore occurs at the season for which the precipitation is maximum in the reference run. The temperature response to an AMOC collapse is rather constant throughout the year over the Eastern Pacific and Northwestern America, which undergo a warming (Fig. 7). There are no temperature differences in the rest of the extrat-ropical Pacific. This warming can be explained by a cyclonic anomaly, present at all seasons, extending from the dateline to the West American coast and from ca. 30 to 60◦N. How-ever, the slow timing of the response suggests that its estab-lishment also needs the surface ocean to adjust first. The pre-cise position and intensity of this cyclonic anomaly slightly change from season to season but its net effect is that south-westerly winds bring warmer air to the Northeastern Pacific and Northwestern America. This warming is accompanied by an increase in precipitation, which is strongest, in ampli-tude and extent, in summer and autumn. This phenomenon
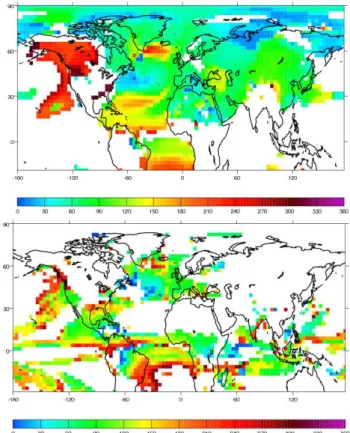
Fig. 11.Top: Timing of the appearance of significant anomalies in mean annual temperature in LGMc, as compared to LGMb, defined as the first year in which the anomaly reaches at least half of the final anomaly for at least 50 years (the “final” anomaly is taken as the difference between years 521–570 of LGMc and years 100– 150 of LGMb). Bottom: Same as for top but for the mean annual precipitation (cf. final response Fig. 9).
is not only related to evaporation anomalies, as for the North Atlantic Ocean (Fig. 12), but also to the southward shift of the westerlies and storm-tracks which is prominent in sum-mer and autumn (not shown).
5.2 Tropical Atlantic
Fig. 12.LGMc-LGMb precipitation (l.h.s) and evaporation (r.h.s) anomalies in mm/day for the 4 seasons. The differences have been masked where not significant at the 95% level in a standard Student-T test. The time averages are taken over years 201–250 for LGMb and over years 521–570 for LGMc.
Fig. 13. Meridional atmospheric overturning streamfunction (1012kg/s). The contours represent for the averaged value for LGMb (years 201–250), with a clockwise rotation when positive. Red shaded zones stand for positive (clockwise) differences be-tween LGMc and LGMb (years 521–570 for LGMc, years 201–250 for LGMb). Blue shaded zones stand for negative (anticlockwise) ones.
of adjustment in response to an imposed Northern Hemi-sphere cooling is in agreement with several studies, (e.g. Zhang and Delworth, 2005; Chiang and Bitz, 2005; Broccoli et al., 2006).
of Mexico also appears to be associated with the southward shift of the ITCZ, or to an increase of the subsidence of the winter Hadley cell, since the anomalies are stronger in boreal autumn and winter and are not related to evaporation anoma-lies.
The impact of a strong weakening of the AMOC between the simulations LGMb and LGMc on the June to September (JJAS) precipitation is shown on Fig. 14a. The southward shift of the ITCZ in the Equatorial Atlantic is accompanied by a significant reduction in precipitation over the African monsoon region during the monsoon season. Other model-ing experiments (e.g. Chang et al., 2008) have highlighted the sensitivity of the African monsoon system to an addition-nal fresh water flux in the North Atlantic and Arctic. In our experiments, this impact is verified under glacial conditions.
5.3 Indian monsoon
The Indian monsoon precipitation is reduced by approxi-mately 0.5 to 2 mm/day in the Southwest of the subcontinent and in the northern Bay of Bengal in LGMc compared to LGMb. No changes are observed over land since in the refer-ence (LGMb) simulation, the largest monsoon signal is over the ocean. The reduction of the Indian monsoon intensity is also reflected in the weakened cross-equatorial flux from the Indian Ocean to the Arabian Sea (Fig. 14a). Hence our experiments show that under glacial conditions a collapse of the AMOC is associated with a significant remote impact on the Indian summer monsoon activity. As stated in Sect. 1.2, this teleconnection has been investigated for different time scales and there are several pathways by which the Indian monsoon rainfall may be influenced. The connection with the extratropics can find support in an atmospheric bridge with the changes over the North Atlantic (Goswami et al., 2006). The influence of a weakening of the AMOC can also modify the (tropical) Walker circulation (e.g. Lu et al., 2006). Local ocean-atmosphere feedbacks, e.g. through changes in SSTs and evaporation, can amplify the changes.
Here we use a physical indicator of the Indian monsoon based on the upper tropospheric temperature meridional gra-dient (Xavier et al., 2007; He et al., 2003). We compute the average of tropospheric temperature from 200 to 500 hPa (TT) for the JJAS season. The difference of TT between the simulations LGMc and LGMb (Fig. 14b) indicates a signif-icant seasonal cooling over the mid-latitudes. Over India, the meridional gradient of TT is reduced, as well as the sen-sitive heating over the Tibetan Plateau (not shown), result-ing in weaker Indian monsoon precipitation. This mecha-nism is in agreement with the teleconnection observed be-tween the Atlantic Multidecadal Oscillation and the Indian monsoon variability by Goswami et al. (2006) and Feng and Hu (2008). The anomaly of SSTs in the Northern Atlantic are passed in the upper troposphere over the whole Eurasian continent (cf. Sect. 5.1), creating an atmospheric bridge be-tween the North Atlantic and the Asian region. Since the SST
Fig. 14. (a)Difference of precipitation (mm/day) averaged for JJAS (June-July-August-September) between the simulations LGMc and LGMb (colours), and of surface winds at 10 m (m/s) (vectors);(b)
Difference of temperature averaged from 200 to 500 hPa (TT) for JJAS between LGMc and LGMb; for (a) and (b) the time averages are taken over years 201–250 LGMb, and over years 521–570 for LGMc, for comparison to other figures; (c)Evolution of TT av-eraged over the region (50◦E–100◦E, 20◦N–50◦N) (red) and of precipitation averaged over the region (60◦E–80◦E, 5◦N–15◦N) (blue) for LGMc minus LGMb (average over years 101–150).
6 Summary and discussion
The present study analyses three glacial coupled atmosphere-ocean simulations characterised by different Atlantic Merid-ional Overturning Circulations (AMOC). In response to an 0.08 Sv increase in North Atlantic fresh water flux, the AMOC reduces from 18 Sv (LGMa) to 15 Sv (LGMb). The climate differences between these runs are restricted to the northern North Atlantic, Nordic Seas and Europe. The cool-ing anomaly over the Northern North Atlantic associated with this slightly slower AMOC is strong enough to force a cyclonic anomaly in the atmospheric circulation over this region, which could take part in the slight warming over the Norwegian Sea. However, the main element explaining this surprising warm anomaly is the reinforcement of the oceanic convective activity in this area, partly resulting from the sea ice edge pushed further North by surface winds. An anoma-lous cooling appears further east in winter, due to northerly winds appearing as part of the stationary wave response to the SST changes over the North Atlantic and Nordic Seas. It is not possible to disentangle the roles of the atmosphere, ocean and sea ice in the temperature difference between the two simulations. Further experiments, using partial coupling of the model components, would be needed to test if the at-mospheric circulation changes and oceanic/sea ice response indeed reinforce each other, especially over the Norwegian Sea, as suggested by our first analyses. The difference in precipitation, on the other hand, is hardly significant for these simulations.
A further 0.1 Sv fresh water flux into the North Atlantic induces a collapse of the AMOC in LGMc, compared to LGMb. As noted by Fl¨uckiger et al. (2008), the climatic re-sponse to this shutdown does not appear to be a simple ampli-fication of the climate anomalies simulated as a response to a weak AMOC perturbation. This has important implications for paleo-record interpretations, which could otherwise a pri-ori assume a linear reponse w.r.t the forcing, i.e. in our case a change in AMOC. The surface climate anomalies are of global extent, and qualitatively agree with the interpretation of paleorecords for the northern extratropics (in particular, the North Atlantic and surrounding regions such as Green-land and Europe), the tropical Atlantic, with the southward shift of the ITCZ and the Indian monsoon region, over which the monsoon decreases. However, the model does not simu-late a warming over Antarctica (despite a warming over most of the Southern Ocean) or a weakening of the East Asian monsoon. It could simply be that the model is not sensi-tive enough to a collapse of the AMOC compared to the cli-matic changes suggested by the different paleo-records, or that the model is missing crucial feedbacks (from dust, veg-etation or biogeochemical cycles, for instance), or that some of these climatic changes are not related to AMOC differ-ences. However, before drawing any conclusion of this type, further experiments would have to be performed. Indeed, although it is probably legitimate to claim that LGM
bound-ary conditions are closer to the boundbound-ary conditions which prevailed during times of strong millennial abrupt changes (Marine Isotope Stage 3 (MIS3) from ca. 60 to 30 ky BP) than present conditions, these are far from being entirely re-alistic for this period (for a recent study, see e.g. Van Meer-beeck et al., 2009). In particular, MIS3 is characterised by a stronger Northern Hemisphere summer insolation than dur-ing the LGM or the present, which would favour stronger Indian and South-East Asian monsoons in the basic state, as shown by the numerous studies of the Holocene climate (e.g. Braconnot et al., 2007a,b). This monsoon could then be more sensitive to AMOC changes. Also, for quantitative compar-isons, including proxies such as water isotopes in the model would certainly bring a lot of precise understanding of the proxy records.
Our main objective here was to investigate the mecha-nisms for possible teleconnections with the North Atlantic changes. We have focussed our study on the three regions for which the results simulated by our model appeared rel-evant compared to the proxy records: the northern extrat-ropics, the tropical Atlantic and the Indian monsoon region. The climate response in the northern extratropics is domi-nated by large changes in stationary waves, with a strong cyclonic anomaly over the northern North Atlantic persis-tent throughout the year, but stronger in winter and spring. These changes in stationary waves explain the smaller cool-ing over western Europe, as compared to the North Atlantic, because this region is affected by southwesterly wind anoma-lies. They also explain a warming over the Northeastern Pa-cific and America’s northwestern coast, affected by south-westerly wind anomalies too. However in this latter case, the long timing for the set up of this anomaly pleads for a role of the Pacific Ocean in forcing the associated atmospheric cir-culation anomaly. The precipitation anomalies over the At-lantic extratropics are mostly related to a strong evaporation decrease due to the cooling there and not so much to atmo-spheric circulation changes, such as in other regions. Indeed, over the Northeastern Pacific/Northwestern America, for ex-ample, they appear to be also related with a southward shift of the westerlies/storm-tracks.
increase in precipitation over the Amazon region appears to be amplified by a local evaporation-precipitation feedback. Finally, we analyse the weakening of the Indian monsoon in response to the AMOC collapse as a consequence of an atmospheric bridge between the North Atlantic and the mon-soon area, which involves the large cooling of the upper tro-posphere over Eurasia, and the subsequent decrease in the tropospheric meridional gradient between India and North-ern Eurasia.
These surface climate changes associated with an AMOC shutdown do not appear simultaneously in all regions of the globe. The timing of the response is of the order of a hundred years over the Atlantic, Eurasia and for the Indian monsoon. The response over the northwestern Pacific is the slowest to appear, with a timescale of around 250 years. The tropi-cal Atlantic responds with intermediate timestropi-cales compared to these extremes. This timing suggests (1) a very fast cli-matic response over the Arctic and Northern Eurasia, which is probably related to an atmospheric stationary wave change amplified by the sea-ice and snow-albedo feedbacks; (2) an extension of this cooling over most of Eurasia and North Africa; (3) a propagation of the temperature anomalies from the central North Atlantic along the subtropical gyre along the coasts of Africa, before the temperature cools down in the North Atlantic low latitudes; (4) relatively slower ocean responses for the largest convection site of the northwestern North Atlantic, for the South Atlantic and, finally, for the Northwestern Pacific. Comparing these results to paleodata with sufficient temporal resolution and chronological control would therefore be a good test of the model’s sensitivity to freshwater forcings and states of the AMOC.
Each step in the climatic response depicted above corre-sponds to a precise AMOC value (Fig. 1). However, this does not mean that the AMOC has to pass below this value to ob-tain the described response. Indeed, the climatic response over some regions such as the North Atlantic sub-tropical gyre are indirectly related to the slow down of the AMOC, via the propagation (by different possible mechanisms) of the initial cooling of the mid-latitude Western and Central At-lantic. It is therefore not possible, from our experiments, to strictly disentangle the direct and immediate response to an AMOC decrease from the propagation of a signal advected from another region because the AMOC decrease and the cli-mate signal propagation can occur with similar timescales. Further experiments, with different speeds of AMOC col-lapse and/or in which the atmosphere and the ocean are only partially coupled, would be necessary to pin down the exact roles of the ocean or the atmosphere, as has been performed by other models (e.g. Krebs and Timmermann, 2007; Yang and Liu, 2005).
Concerning the sensitivity of the AMOC under LGM con-ditions, a companion paper shows that the model we use, the IPSL CM4 model, is actually more sensitive to freshwater input in the North Atlantic in the glacial context analysed here than under various interglacial climates (Swingedouw
et al., 2009). This is in line with the analyses from Ganopol-ski and Rahmstorf (2001). This difference in sensitivity sheds light on the necessity of comparing proxy data and simulations that are under the most possible realistic bound-ary conditions. The reason for these differences is however not elucidated yet and will be the subject of a future study.
A final remark is related to the hydrological cycle, which is deeply affected by a collapse in the AMOC. Following Leduc et al. (2007), we can wonder whether this constitutes a positive or a negative feedback compared to the freshwater anomaly which is the initial cause of the AMOC collapse. The study of these feedbacks and of the conditions needed for a recovery of the AMOC from the “off” state obtained in our third simulation is complementary to the present study and will be presented in a forthcoming paper.
Acknowledgements. All simulations presented in this work were
run on the Commissariat A l’Energie Atomique super-computing facilities. This study has been partly funded by ANR-BLANC IDEGLACE (ANR-05-BLAN-0310-01).
Edited by: H. Renssen
The publication of this article is financed by CNRS-INSU.
References
Alkama, R., Kageyama, M., Ramstein, G., Marti, O., Ribstein, P., and Swingedouw, D.: Impact of a realistic river routing in coupled ocean-atmosphere simulations of the Last Glacial Maximum climate, Clim. Dynam., 30, 855–869, doi:10.1007/ s00382-007-0330-1, 2007.
Altabet, M. A., Higginson, M. J., and Murray, D. W.: The effect of millennial-scale changes in Arabian Sea denitrification on atmo-spheric CO2, Nature, 415, 159–162, 2002.
Berger, A. L.: Long-term variations of daily insolation and Quater-nary climatic changes, J. Atmos. Sci., 35, 2362–2367, 1978. Bitz, C. M., Chiang, J. C. H., Cheng, W., and Barsugli, J. J.: Rates
of thermohaline recovery from freshwater pulses in modern, Last Glacial Maximum, and greenhouse warming climates, Geophys. Res. Lett., 34, L07708, doi:10.1029/2006GL029237, 2007. Bjerknes, J.: Atlantic air-sea interaction, Academic Press, 10, 1–82,
1964.
Blunier, T., Chappellaz, J., Schwander, J., D¨allenbach, A., Stauf-fer, B., Stocker, T. F., Raynaud, D., Jouzel, J., Clausen, H. B., Hammer, C. U., and Johnsen, S. J.: Asynchrony of Antarctic and Greenland climate change during the last glacial period, Nature, 394, 739–743, 1998.
from North Atlantic sediments and Greenland ice, Nature, 365, 143–147, 1993.
Bout-Roumazeilles, V., Nebout, N. C., Peyron, O., Cortijo, E., Landais, A., and Masson-Delmotte, V.: Connection between South Mediterranean climate and North African atmospheric cir-culation during the last 50 000 yr BP North Atlantic cold events, Quaternary Sci. Rev., 26, 3197–3215, 2007.
Braconnot, P., Otto-Bliesner, B., Harrison, S., Joussaume, S., Pe-terchmitt, J.-Y., Abe-Ouchi, A., Crucifix, M., Driesschaert, E., Fichefet, T., Hewitt, C. D., Kageyama, M., Kitoh, A., Lan, A., Loutre, M.-F., Marti, O., Merkel, U., Ramstein, G., Valdes, P., Weber, S. L., Yu, Y., and Zhao, Y.: Results of PMIP2 coupled simulations of the MidHolocene and Last Glacial Maximum -Part 1: experiments and large-scale features, Clim. Past, 3, 261– 277, 2007a,
http://www.clim-past.net/3/261/2007/.
Braconnot, P., Otto-Bliesner, B., Harrison, S., Joussaume, S., Pe-terchmitt, J.-Y., Abe-Ouchi, A., Crucifix, M., Driesschaert, E., Fichefet, Th., Hewitt, C. D., Kageyama, M., Kitoh, A., Loutre, M.-F., Marti, O., Merkel, U., Ramstein, G., Valdes, P., Weber, L., Yu, Y., and Zhao, Y.: Results of PMIP2 coupled simulations of the Mid-Holocene and Last Glacial Maximum - Part 2: feed-backs with emphasis on the location of the ITCZ and mid- and high latitudes heat budget, Clim. Past, 3, 279–296, 2007b, http://www.clim-past.net/3/279/2007/.
Broccoli, A. J., Dahl, K. A., and Stouffer, R. J.: Response of the ITCZ to Northern Hemisphere cooling, Geophys. Res. Lett., 33, L01702, doi:10.1029/2005GL024546, 2006.
Chang, P., Zhang, R., Hazeleger, W., Wen, C., Wan, X. Q., Ji, L., Haarsma, R. J., Breugem, W. P., and Seidel, H.: Oceanic link between abrupt changes in the North Atlantic Ocean and the African monsoon, Nature Geosci., 1, 444–448, 2008.
Chiang, J. C. H. and Bitz, C. M.: Influence of high latitude ice cover on the marine Intertropical Convergence Zone, Clim. Dynam., 25, 477–496, 2005.
Chiang, J. C. H., Cheng, W., and Bitz, C. M.: Fast tele-connections to the tropical Atlantic sector from Atlantic thermohaline adjustment, Geophys. Res. Lett., 35, L07704, doi:10.1029/2008GL033292, 2008.
Claussen, M., Ganopolski, A., Brovkin, V., Gerstengarbe, F.-W., and Werner, P.: Simulated global-scale response of the climate system to Dansgaard/Oeschger and Heinrich events, Clim. Dy-nam., 21, 361–370, 2003.
Clement, A. C. and Peterson, L. C.: Mechanisms of abrupt climate change of the last glacial period, Rev. Geophys., 46, RG4002, doi:10.1029/2006RG000204, 2008.
Combourieu Nebout, N., Turon, J.-L., Zhan, R., Capotondi, L., Londeix, L., and Pahnke, K.: Enhanced aridity and atmospheric high-pressure stablity over the western Mediterranean during the North Atlantic cold events of the past 50 k.y., Geology, 30, 863– 866, 2002.
Crowley, T. J.: North Atlantic deep water cools the Southern Hemi-sphere, Paleoceanography, 7, 489–497, 1992.
Dallenbach, A., Blunier, T., Fluckiger, J., Stauffer, B., Chappellaz, J., and Raynaud, D.: Changes in the atmospheric CH4gradient
between Greenland and Antarctica during the Last Glacial and the transition to the Holocene, Geophys. Res. Lett., 27, 1005– 1008, 2000.
Dansgaard, W., Johnsen, S. J., Clausen, H. B., Dahl-Jensen, D.,
Gundestrup, N. S., Hammer, C. U., Hvidberg, C. S., Steffensen, J. P., Sveinbj¨ornsdottir, A. E., Jouzel, J., and Bond, G.: Evidence for general instability of past climate from a 250-kyr ice-core record, Nature, 364, 218–220, 1993.
Denton, G. H., Alley, R. B., Comer, G. C., and Broecker, W. S.: The role of seasonality in abrupt climate change, Quaternary Sci. Rev., 24, 1159–1182, 2005.
Elliot, M., Labeyrie, L., and Duplessy, J.-C.: Changes in North Atlantic deep-water formation associated with the Dansgaard-Oeschger temperature oscillations (60–10 ka), Quaternary Sci. Rev., 21, 1153–1165, 2002.
EPICA community members: One-to-one coupling of glacial cli-mate variability in Greenland and Antarctica, Nature, 444, doi:10.1038/nature05301, 2006.
Feng, S. and Hu, Q.: How the North Atlantic Multidecadal Os-cillation may have influenced the Indian summer monsoon dur-ing the past two millennia, Geophys. Res. Lett., 35, L01707, doi:10.1029/2007GL032484, 2008.
Fl¨uckiger, J., D¨allenbach, A., Blunier, T., Stauffer, B., Stocker, T. F., Raynaud, D., and Barnola, J.-M.: Variations in atmospheric N2O concentration during abrupt climatic changes, Science, 285,
227–230, 1999.
Fl¨uckiger, J., Knutti, R., White, J. W. C., and Renssen, H.: Modeled seasonality of glacial abrupt climate events, Clim. Dynam., 31, 633–645, doi:10.1007/s00382-008-0373-y, 2008.
Ganopolski, A. and Rahmstorf, S.: Rapid changes of glacial cli-mate simulated in a coupled clicli-mate model, Nature, 409, 153– 158, 2001.
Genty, D., Blamart, D., Ouahdi, R., Gilmour, M., Baker, A., Jouzel, J., and Van-Exter, S.: Precise dating of Dansgaard-Oeschger cli-mate oscillations in western Europe from stalagmite data, Nature, 421, 833–937, 2003.
Gonz´alez, C., Dupont, L. M., Behling, H., and Wefer, G.: Neotrop-ical vegetation response to rapid climate changes during the last glacial period: Palynological evidence from the Cariaco Basin, Quaternary Res., 69, 217–230, 2008.
Goswami, B. N., Madhusoodanan, M. S., Neema, C. P., and Sen-gupta, D.: A physical mechanism for North Atlantic SST influ-ence on the Indian summer monsoon, Geophys. Res. Lett., 33, L02706, doi:10.1029/2005GL024803, 2006.
Grimm, E. C., Watts, W. A., Jacobson, Jr., G. L., Hansen, B. C. S., Almquist, H. R., and Dieffenbacher-Krall, A. C.: Evidence for warm wet Heinrich events in Florida, Quaternary Sci. Rev., 25, 2197–2211, 2006.
He, H. Y., Sui, C. H., Jian, M. Q., Wen, Z. P., and Lan, G. D.: The evolution of tropospheric temperature field and its relationship with the onset of Asian summer monsoon, J. Meteorol. Soc. Jpn, 81, 1201–1223, 2003.
Heinrich, H.: Origin and consequences of cyclic ice rafting in the Northeast Atlantic ocean during the past 130 000 years, Quater-nary Res., 29, 142–152, 1988.
Hewitt, C. D., Broccoli, A. J., Crucifix, M., Gregory, J. M., Mitchell, J. F. B., and Stouffer, R. J.: The effect of a large fresh-water perturbation on the glacial North Atlantic ocean using a coupled General Circulation Model, J. Climate, 19, 4436–4447, 2006.