IMPACT OF SERVICE QUALITY ON CUSTOMER
SATISFACTION: EVIDENCES FROM THE
RESTAURANT INDUSTRY IN PAKISTAN
MS Candidate Ubedullah Amjad Ali SHAIKH Institute of Business and Technology – Biztek, Karachi, Pakistan Naveed Ur Rehman KHAN Universiti Pendidikan Sultan Idris – UPSI, Perak, Malaysia
Email: naveed.r.khan@gmail.com
Abstract:
The purpose of this study is to contribute to the literature of service quality importance in restaurant industry. The study has been based upon the Servqual technique and Dineserv tool of improving the quality by the service providing organizations. The study is undertaken from the perspective of Pakistani Restaurant Industry and the customers' perceptions vis-à-vis restaurant dining. Two variables of Servqual, i.e. Tangibles and Responsiveness, have been examined to demonstrate the significance of service quality on customer satisfaction. The results endorse the importance of enhanced complementary service standards in restaurant industry. Finally, the findings provide an insight for the Pakistani restaurant service providing establishments and suggestion have been made for the caretakers of the industry on ways to improve service quality.
Keywords: marketing; restaurants; servqual; customer satisfaction
Introduction
The restaurant industry has evolved over the past few decades from merely a meals providing facility to an augmented combination of service associated features. These features are emphasized to satisfy the complementary needs of its customers. This notion of satisfaction is mainly attributed to the quality of service. Hence a lot of probing has been going on for the past few decades to rationalize and prove a direct relationship between the two.
Many of theories and models have been established in this regard. Zeithaml, Parasuraman and Berry (1988) proposed an empirically derived method called Servqual to be used by service organizations to improve quality. The Servqual scale was employed widely to measure the service quality in different industries of service sector including restaurants
(Bojanic & Rosen, 1994; Fu, 1999). This methodology was based around five key dimensions. All of the dimensions have significant impact of varying degrees on customer satisfaction.
Several studies have been conducted to analyze the degree of impact of Servqual dimensions on the customer satisfaction, for example
Dineserv produced by Stevens and et al (1995). However, the difference of the population sample, their cultural values, environment, per capita income and emotions play a significant role in evaluating these dimensions. Therefore, this study is conducted to analyze the service quality impact on a customer of Pakistani restaurant industry.
constraints, the researchers decided to select and conduct the study on the two most applicable dimensions of Servqual
in the local environment.
Literature Review
In modern times, efficient and professional catering and restaurant services are must for every event, celebration or party. Whether it is a birthday celebration, wedding catering, anniversary party, social, traditional, corporate or political event - quality and delicious food serving is a must to complete the event. Restaurant and catering can be demanding work that will require a lot of stamina and inner strength. Business/ employees should also possess the ability to work under stress. Firm success depends solely on its reputation; it is good to be daringly careful with the jobs it takes up. Strive to provide a high quality, superior service at all times. Never let qualities be diminished maintain the standards for repute and references promise (Jones, 2009).
There is not much official data available for caterers and restaurant businesses. However, one of the most reliable website of Pakistan’s businesses The Phonebook mentioned 377 caterers and 616 restaurants in Karachi (Ghouri, Khan et al, 2011). Further with the discussion around 3000 caterers operating in this business (Khan, 2004) in which ten big caterers who have major share of market specially Hanif Rajput Catering who has an asset base of approximately USD 57.53 million and an inventory of furniture, crockery and transport worth USD 0.345 million (Kamal, Ather and Shahid, 2005) and approximate 350-400 local restaurants in Karachi. According to Kamal, Ather and Shahid (2005) that 150 caterers are running their businesses with 150,000 employees. Every year the demand for the Catering Business will be going on increasing (Doyle, 2009).
Catering is one of the highest rising sectors (Jones, 2009) with restaurants. Catering business may be a very profitable field to get into (Skoglund, 2008), catering business has the potential of over USD 460.24 million per annum (Qureshi, 2004) Caterers say the estimated daily turnover of the catering business in the city is in the range of USD 75 thousand to USD 80 thousand (Khan, 2004) in excess demand season, but according to CEO of Hanif Rajput Caterers, Javed Rajput "catering business is still an unorganized sector, professionalism has really not permeated" (Kamal, Ather and Shahid, 2005). By the 1990’s the competition in the catering business became intense (Kamal, Ather and Shahid, 2005) along with restaurants.
According to Farrukh (1999) ‘Dining out’ is growing in popularity. More than 11 million people dine out regularly. In the past, most local hotels and restaurants served traditional foods. Recently, however, ethnic and fast foods, including western-style/ Chinese style fast food, have become popular and an increasing number of fast food chains have been successfully established in the major urban areas.
The sector is dominated by numerous and midsized Family restaurants in which 62% are family restaurants, 15% are fast food restaurants, 6% hotels and 17% are ethnics.
Some reasons that now people like to visit restaurant or take caterer services such as:
• Rapid urbanization.
• Increased female participation in the work force.
• Increased exposure to different foods via the popular media, from workers and students returning from overseas.
• Promotional activities of the local industry.
• Trend in society.
However, the focus of this research is services quality which definitely has remote correlation with the above stated challenges.
Service quality is an abstract and elusive construct because of three features unique to services: intangibility, heterogeneity, and inseparability of production and consumption (Parasuraman, Zeithaml, and Berry 1985). Zeithaml (1987) defines perceived quality as “the consumer's judgment about an entity's overall excellence or superiority". Stevens and et al (1995) describe it as, "perceived service quality is a function of the interaction among three independent variables: normative expectations, predictive expectations, and actual service quality. The lower the expectations the consumers have about what should happen, the better their perceptions of the actual service. And the higher their expectations about what will happen, the better their perceptions of the actual service". Whereas, Oliver (1981) gives the definition of satisfaction as," it is the summary psychological state resulting when the emotion surrounding disconfirmed expectations is coupled with the consumer's prior feelings about the consumption experience" (p. 27).
The study of service quality brought much into the attention of researchers about two decades ago, when Valarie, Zeithaml, et al (1988), introduced Servqual. It is an empirically derived method that could be used by any service organization to improve service quality (Cronin & Stephen, 1992). It is a multi-item scale developed to assess customer perceptions of service quality in service and retail organizations. The scale addresses the notion of service quality in response to the different features of above said dimensions.
Zeithaml, Parasuraman and Berry's (1988) research in service
marketing shows that a significant gap may exist between customers' expectations and the assessment by managers of those expectations. According to Brown and Bond (1995), "the gap model is one of the best received and most heuristically valuable contributions to the service literature". Asubonteng et al. (1996) conclude that, "until a better but equally simple model emerges, Servqual will predominate as a service quality measure".
While applying the Servqual
dimensions; for customer satisfaction in restaurant industry; Dube et al (1994) state that "Ultimately, a manager would take this information to analyze the areas that, if improved, would have the largest impact on satisfaction, taking into account costs and risks". Referring to the potential for improvement in Restaurant industry, they further state that, "As part of the consideration of costs and benefits of any service improvement, a manager must determine the potential presented by each service attribute in terms of satisfaction or repeat-purchase improvement."
Shahin (2006) writes "managers in the service sector are under increasing pressure to demonstrate that their services are customer-focused and that continuous performance improvement is being delivered. Given the financial and resource constraints under which service organizations must mange it is essential that customer expectations are properly understood and measured and that, from the customers' perspective any gaps in service quality are identified. This information then assists a manager in identifying cost-effective ways of closing service quality gaps and of prioritizing which gaps to focus on – a critical decision given scarce resources."
can't entirely understand the customers' satisfaction process (Ladhari, Morales et al, 2005). However, the customer opinion of service quality is change overtime (Palmer and O’Neill, 1999).
About their dining out experiences concerning the consumers, Stevens and et al (1995) state that, "Consumer is impatient and sophisticated. If your restaurant isn't providing satisfaction – service and value – the consumer will leave it for another …. today the restaurateur who provides great service and value has a competitive advantage over those operators who do not". They have developed a tool named Dineserv, designed to assess continual assessment of customers' perceptions of restaurant's quality. It is a 29 item questionnaire to judge, restaurant consumers' opinions, in order to improve the standards accordingly by the restaurateurs.
Referring to a 1986 Gallup report results, Stevens and et al (1995) state that of consumers going to a restaurant for the first time, 44 percent went because of a recommendation and another 10 percent went with someone who had been there before. They surveyed three types of diners, fine-diners, casual fine-diners, and quick-service consumers and found that the higher the perception of service quality, the greater the intention to return and to recommend. Furthermore; about the impact of word-of-mouth advertising; referring to Plymire's 1991 article, they state that, "91 percent of a restaurant's dissatisfied customers will never come back, and they will typically tell eight to ten others about their negative experiences". However, they suggest three ways to improve customers' perceptions about service:
• improve the service,
• lower the expectations of what should happen, and
• raise the expectations about what will happen.
Kim, Nee Ng, et al (2008), have tried to investigate the relative importance of institutional Dineserv
factors that affect customer satisfaction and also to examine the ultimate satisfaction influence on return intention and word-of-mouth endorsement. Moreover Sulek & Hensley (2004) provide evidence that fairness in services increase the delightness in customer behaviour and interpret it as a compliment.
As Lovelock (1998) explains that the services are heterogeneous in nature, so no two encounters will bring the same emotions and ultimately differing in the level of satisfaction. Therefore, Michael Edwardson (1998), argues that, "customer satisfaction measurement and research as commonly applied, needs to now move to the next stage and consider the specific and unique consumer emotions and emotional knowledge structures that comprise the variety and richness of the consumer experience".
Allan Yen-Lun Su (2002) has tried to validate five dimensions of service quality contained in the Dineserv
instrument in a chain operated steakhouse and explored the differences in perceived service quality for customers at different serving periods and for groups of different customer loyalty. He thinks that the results of his study will help restaurant management establish a total quality management (TQM) program to improve overall service quality to restaurateurs.
Research Model
Figure 1 illustrates the model of study. The two service quality variables i.e. tangibles and responsiveness were studied to analyze their impact on customer satisfaction.
Figure 1. Model of Study Hypothesis
H1- There is a positive relationship between the tangible features and customer satisfaction.
H2- There is a positive relationship between the responsiveness features and customer satisfaction.
Research Design and Methodology
In order to conduct the analysis, a questionnaire was adopted from the study of Zeithaml etal (1993) and Stevens and et al (1995). The questionnaire composed of three sections, section one collects the demographic information, section two collects the responses on independent variables and section three collects the responses on dependent variable. However, demographic adjustments were made in context of Pakistan. The items of variables were rated on five point Likert scale. The response was taken from a sample of 400 customers in total. In order to make the data reliable and generalize the findings, they were divided into equal numbers across the four provincial capitals;
ultimately to be surveyed from different restaurants. The target sample belonged to the middle class and upper middle class families, who dine out at least once every month. The data was collected during a period of five weeks, while personally visiting the restaurants and asking the volunteer customers to either tell or write their replies in response to the questionnaire developed by the group. SPSS 15 was used in order to get the statistical analysis, the percentage, the weighted percentage; the descriptive statistics and the correlation analysis were employed to examine the results.
Discussion and Analysis To measure the reliability of the instruments used, Cronbach’s alpha is employed. According to Sekaran (2005) instrument is acceptable for analysis if Cronbach’s alpha is greater than 0.6 and is within 0.7. The result of reliability testing of the instrument used in this study is well above 0.6; hence, it is acceptable for further analysis.
Table 1 Reliability Test
Variable Number of Items Alpha Reliability
Tangibles 11 0.785
Responsiveness 9 0.832
Satisfaction 9 0.828
Customer Satisfaction
The findings of first variable
Tangibles from all four cities in the respective order are given below, whereby:
SDA = Strongly Disagree DA = Disagree
N = Neutral (neither agree nor disagree)
A = Agree
SA = Strongly Agree
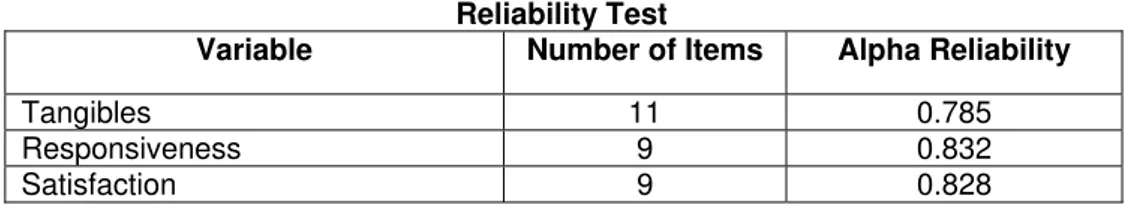
City No.1: Islamabad
The data gathered from the country’s capital city of Islamabad was compiled and analyzed by using SPSS and MS Excel. The analysis clearly points that amongst 100 people selected randomly from the city, 70 percent of them responded in favor of tangibles. This shows that a clear majority of city’s restaurant customers gives the importance to tangible aspects, while making their choice to dine out in a restaurant.
Whereas, 21 percent of the customers remained neutral in deciding about whether or not to consider the
tangibles, only 9 percent disagreed that tangibles are important for making their choice of a restaurant. Out of which a negligible proportion i.e. 2 percent, strongly disagreed. However it is noteworthy from the results that this proportion of the customers, who disagree vis-à-vis tangibles importance is only one tenth of the total customers surveyed from the city.
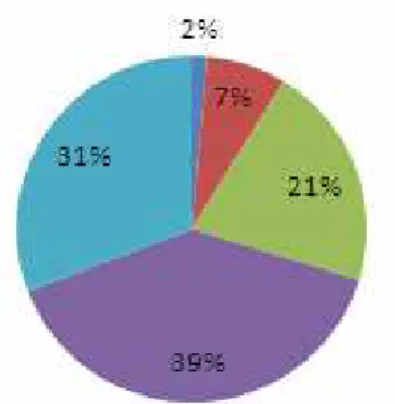
City No.2: Lahore
However, 15 percent of the customers remained neutral in deciding about whether or not to consider the tangibles. Similarly 15 percent disagreed that tangibles are important for making their choice of a restaurant. Out of which only 6 percent strongly disagreed.
City No.3: Karachi
The data gathered from country’s largest metropolitan city of Karachi was also compiled and analyzed by using same software. The analysis clearly points that amongst 100 people
selected randomly from the city, about two thirds of the respondents were in favor of tangibles. This corresponds to the prior results that a clear majority of city’s restaurant customers regard the tangible aspects as important, while making their choice to dine out in a restaurant. This constitutes 67 percent of total respondents in the city. However, approximately one fourth of the surveyed customers remained neutral in deciding about whether or not to consider the tangibles in their decision. Once again only almost one tenth of them disagreed.
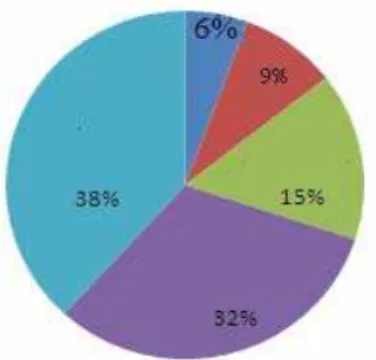
City No.4: Peshawar
Finally, the data was gathered from north-western capital city of Peshawar and was compiled and analyzed in the same manner. The restaurant customers of the Peshawar city were found overwhelmingly
considering the tangibles as the most important factor while making their choices for eating out in restaurants. The analysis clearly points that amongst 100 people selected randomly from the city, about three fourth were in favor of tangibles.
Figure 2. Lahore City Statistics
Whereas 18 percent of the respondents were indecisive about the tangible features, only 1 respondent strongly disagreed to this. However, 6
percent of them disagreed vis-à-vis impact of tangibles in their decision making process for restaurant dining.
Table 2 Tangibles correlation between different cities
Tang. Islamabad
Tang. Lahore
Tang. Karachi
Tang. Peshawar
Tang. Islamabad 1
Tang. Lahore 0.2 1
Tang. Karachi 0.7 0.3 1
Tang. Peshawar 0.3 0.06 0.3 1
While analyzing the response from different cities, it was also tried to see the relationship of response amongst the restaurant customers of above mentioned four cities. All of the cities are having positive correlation, which is statistically significant as far as the tangibles impact is concerned. This shows that in the major cities of Pakistan, people are having the same attitude in their preferences for restaurants’ selection for eating out. This shows the similar overall trend of customer defined service standards.
Besides this provides a guideline for restaurant owners as well as the employees to adopt and maintain the service quality standards that can satisfy their customers vis-à-vis tangible features of the premises.
Similarly, the findings of second variable Responsiveness from all four cities in the respective order are given below, presented both in a tabular as
well as graphical form. The data was gathered in the similar fashion as in the case of tangibles survey. Also the data was compiled by using the same graphical and descriptive analysis used for prior variable i.e. tangibles.
City No.1: Islamabad
The respondents of the Islamabad city showed exactly the same response vis-à-vis responsiveness features. The 70 percent of them either agreed or strongly agreed that for them responsiveness is important when they decide whether or not to dine out in a particular restaurant. This becomes even more important for them for their re-visits to the same restaurants. The 21 percent of them remained neutral, whereas only 9 percent of them disagreed and said that the responsiveness features were not important for their decision making process.
City No.2: Lahore
Once again we can see from figure 2, that the 70 percent of the respondents from Lahore value the elements of responsiveness as important in their choice for restaurants
while going out for meals. Approximately 15 percent of them remained neutral and almost the same number of customers disagreed to the notion of responsiveness’ impact on their satisfaction.
City No.3: Karachi
As we can see from figure 3, that the data gathered from the respondents of Karachi tells that approximately two third of them agreed that the responsiveness elements have an impact on their choice of restaurant selection for eating out. Whereas approximately one fourth remained indecisive and only 11 percent of the customers disagreed.
City No.4: Peshawar
The respondents from Peshawar showed the same trend towards responsiveness elements as with that of the tangibles. Almost one fourth of them were indecisive. The two third of them were in favor of taking into consideration responsiveness elements while deciding to visit or not a particular restaurant. However the noteworthy point is that in Peshawar no one of the customers surveyed strongly disagreed the impact of responsiveness.
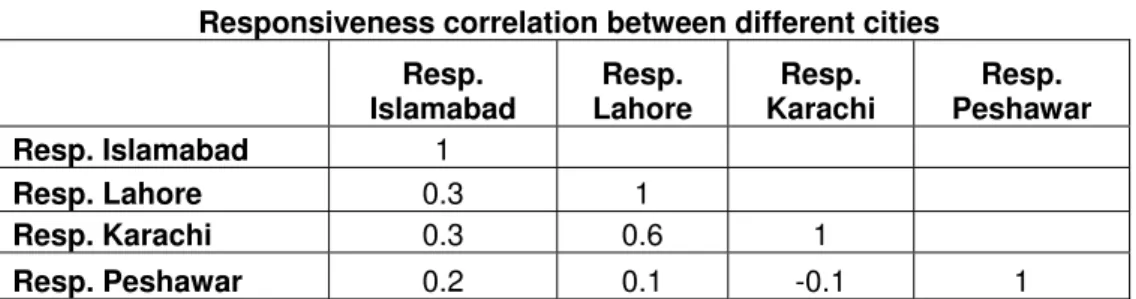
Responsiveness Correlation between Different Cities
The attitude of Islamabad’s respondents is positively correlated with the same of other three cities. The respondents of Lahore are also showing the same attitude towards the impact of responsiveness, which is positively correlated with the other
cities. Only the respondents from Karachi are showing the negative correlation with the respondents from Peshawar. This can be attributed to the extremely contrast values of both the cities. Also this can be due to the difference in living style, the availability of choices of restaurants as well as the contrast in target market.
Table 3 Responsiveness correlation between different cities
Resp. Islamabad
Resp. Lahore
Resp. Karachi
Resp. Peshawar
Resp. Islamabad 1
Resp. Lahore 0.3 1
Resp. Karachi 0.3 0.6 1
Resp. Peshawar 0.2 0.1 -0.1 1
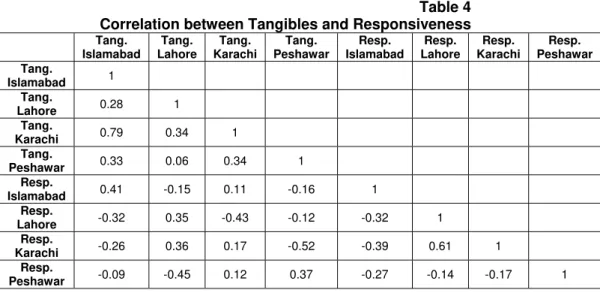
Correlation between Tangibles and Responsiveness
The following table presents a picture of the correlation between the two variables tested. The tangibles response of customers of restaurants from Islamabad is positively correlated with the same of responsiveness. However he same is negatively correlated with response of other cities, which is neutral. Tangible in Lahore is positively correlated with responsiveness of the same city. The same is the case with the tangibles and
the responsiveness of Karachi. Both are positively correlated with each other. The same trend continues, when we look at the results of Peshawar. Both the tangibles as well as the responsiveness of Peshawar are positively correlated with each other.
This trend of results indicates that a majority of the customers who value tangibles also value responsiveness. This shows that both of these variables; tested for this study; move parallel to each other.
Table 4 Correlation between Tangibles and Responsiveness Tang.
Islamabad
Tang. Lahore
Tang. Karachi
Tang. Peshawar
Resp. Islamabad
Resp. Lahore
Resp. Karachi
Resp. Peshawar Tang.
Islamabad 1
Tang.
Lahore 0.28 1
Tang.
Karachi 0.79 0.34 1
Tang.
Peshawar 0.33 0.06 0.34 1
Resp.
Islamabad 0.41 -0.15 0.11 -0.16 1
Resp.
Lahore -0.32 0.35 -0.43 -0.12 -0.32 1
Resp.
Karachi -0.26 0.36 0.17 -0.52 -0.39 0.61 1
Resp.
Peshawar -0.09 -0.45 0.12 0.37 -0.27 -0.14 -0.17 1
Hypothesis Testing
H1: There is a positive relationship between the tangible features and customer satisfaction
Table 5 Results of Hypothesis One
Model R Durbin-Watson F Sig.
1 0.104 1.900 3.657 0.057
The R value is 0.104, which shows a strong dependant relationship and it explains 10% of the dependant variable i.e. customer satisfaction. The F value 3.667 is also significant at 90% confidence level indicating that the variables are not overlapping each other. The Durbin Watson statistics is also between within the acceptable
range showing that there is no auto correlation and tangibles are impacting customer satisfaction. On the basis of regression analysis conducted to test H1, we accept our hypothesis.
H2: There is a positive relationship between the responsiveness features and customer satisfaction.
Table 6 Results of Hypothesis One
Model R
Durbin-Watson F Sig.
Unstandardized Coefficients B
1 0.474 2.025 111.010 0.000 0.753
The R value is 0.474, which shows a strong dependant relationship and it explains 47% of the dependant variable i.e. customer satisfaction. The F value 111.010 is also noteworthy at 95% confidence level indicating that the variables are significantly different. The
there is a very strong relationship between customer satisfaction and responsiveness. On the basis of results obtained through regression analysis, we accept H2.
Conclusions
Responsiveness is more important than tangibles for the local restaurant industry customers. Anecdotal evidence from the fast foods and eating-in snack bars in Pakistan, specially the ethnic fast foods supports this view. So, the order of priority for the industry should be to improve responsiveness first and then to work on tangibles. Moreover, an educated owner / manager of the restaurant brings customer satisfaction at peaks.
After conducting the detailed analysis, it is concluded that the tangibles and responsiveness, which
are the two important dimensions of service quality, have a significant impact on the satisfaction of restaurant customers of Pakistan. In other counties also the similar findings have been proved in various studies conducted on this subject. This study also supports the significant impact of the service quality variables studied vis-à-vis customer satisfaction.
Last but not least, M-commerce marketing will be a good idea to get the customer feedback and expend business. Hence Restaurant businesses should adopt new strategies which may help to overcome the lacking in their marketing activities in general and customer satisfaction in particular (Ghouri, Khan et al, 2011). Indeed it has an overall impact on firm’s performance.
REFERENCES
Arash Shahin (2006), "SERVQUAL and model of service quality gaps: A framework for determining and prioritizing critical factors in delivering quality services",
ICFAI University Press, 5 (1), 117-131.
Asubonteng, P., McCleary, K.J. and Swan, J.E (1996), "SERVQUAL revisited: a critical review of service quality", Journal of Services Marketing, Vol. 10, No. 6, pp. 62-81.
Bojanic, D. C., & Rosen, L.D (1994), "Measuring Service Quality in Restaurants: An Application of the SERVQUAL Instrument", Hospitality Research Journal, 18(1), 4-14
Brown, S.W. and Bond, E.U. III (1995), "The internal/external framework and service quality: Toward theory in services marketing", Journal of Marketing Management, February, pp. 25-39.
Cronin, Joseph Jr. & Stephen A. Taylor (1992), "Measuring Service Quality: A Re-examination and Extension", Journal of Marketing, 56(3), 55-68.
Dube, L., Renaghan, L. M., Miller, J. M (1994),"Measuring Customer
Satisfaction for Strategic Management", Cornell Hotel and Restaurant Management Quarterly, (Feb) Vol. 35(1), 39-47.
Edwardson, M (1998), “Measuring emotions in service encounters: An. exploratory analysis”, Australasian Journal of Market Research, 6 (2), 34-48.
Fu, Y.Y (1999), "Service Quality Dimensions Influencing Older Diners' Intention to Return", Proceedings of Fourth Annual Graduate Education and Graduate
Ambreen (2011), “Marketing Practices and Their Effects on Firm’s Performance: Findings from Small and Medium Sized Catering and Restaurants in Karachi”,
International Journal of Business and Management, Vol .6, No. 5. pp. 251-259 Ladhari R, Morales M and Lakhal S (2005), "Service quality, emotion and satisfaction in restaurant setting", Proceedings of the Annual Conference of the Administrative Sciences Association of Canada, Marketing Division Toronto, Ontario May 28-31,2005.
Lovelock, C.H., Edwardson M., Patterson P.G (1998) “Managing the customer Service function", Sydney, Prentice-Hall, 423 – 445.
Oliver, Richard L 1981, "Measurement and Evaluation of Satisfaction Process in Retail Setting" Journal of Retailing 57 (fall): 25-48.
Palmer, A. and O’Neill, M (1999), "The effects of tangibles on long-term perceptions of service quality", ANZMAC Annual Conference, University of New South Wales, Sydney.
Parasuraman A., Zeithaml Valarie A. and Berry Leonard L (1985), "A Conceptual Model of Service Quality and Its Implications for Future Research", Journal of Marketing (Fall), 41-50.
Parasuraman, A., Zeithaml, V.A. and Berry, L.L (1988), "SERVQUAL: a multi-item scale for measuring consumer perceptions of the service quality", Journal of Retailing, Vol. 64, No. 1, 12-40.
Parasuraman A., Zeithaml V. A. and Berry Leonard L (1988), "SERVQUAL: A Multiple-Item Scale for Measuring Consumer Perceptions of Service Quality",
Journal of Retailing, 64 (1), (Spring), 12-37.
Plymire, J (1991), “Complaints as opportunities”, Journal of Consumer Marketing 8 (2), 39-43.
Qureshi, F. (2004). Need to regulate the catering business, Daily Dawn, [Online] Available: http://www.dawn.com/2004/04/13/letted.htm#7 (October 09, 2009) Sekaran, U. (2005). Research methods for business: A skill-building approach (4th
edition). New York: John Wiley & Sons.
Su, A.Y (2002), “Service quality in a chain-operated steakhouse”. Proceedings from 2002 International CHRIE Conference.
Sulek, Joanne M. & Hensley, Rhonda L (2004), "The Relative importance of Food, Atmosphere, and Fairness of Wait: The Case of a Full-Service Restaurant",
Cornell Hotel and Restaurant Administration, 45(3), 235-247.
Waters, Jennifer (1998), “Eye on service”, Restaurants & Institutions, 108 (28), 46-50.
Woo Gon Kim, Christy Yen Nee Ng & Yen-Soon Kim (2008)," Influence of institutional DINESERV on customer satisfaction, return intention, and word-of-mouth", International Journal of Hospitality Management, Vol. 28(1), March 2009, 10-17.
Yuksel, Atila & Yuksel, Fisen (2002), "Measurement of tourist satisfaction with restaurant services: A segment-based approach", Journal of Vacation Marketing, 9(1), 52-58.