Barrier Permeability and Apparent Diffusion Coefficient
in a Rat Model of Ischemic Stroke
Saeid Taheri., Eduardo Candelario-Jalil., Eduardo Y. Estrada, Gary A. Rosenberg*
Department of Neurology, University of New Mexico, Health Sciences Center, Albuquerque, New Mexico, United States of America
Abstract
Variations in apparent diffusion coefficient of water (ADC) and blood-brain barrier (BBB) permeability after ischemia have been suggested, though the correlation between ADC alterations and BBB opening remains to be studied. We hypothesized that there are correlations between the alteration of ADC and BBB permeability. Rats were subjected to 2 h of transient middle cerebral artery occlusion and studied at 3 and 48 h of reperfusion, which are crucial times of BBB opening. BBB permeability and ADC values were measured by dynamic contrast-enhanced MRI and diffusion-weighted imaging, respectively. Temporal and spatial analyses of the evolution of BBB permeability and ADC alteration in cortical and subcortical regions were conducted along with the correlation between ADC and BBB permeability data. We found significant increases in BBB leakage and reduction in ADC values between 3 and 48 h of reperfusion. We identified three MR tissue signature models: high Kiand low ADC, high Kiand normal ADC, and normal Kiand low ADC. Over time, areas with normal Kiand low ADC transformed into areas with high Ki. We observed a pattern of lesion evolution where the extent of initial ischemic injury reflected by ADC abnormalities determines vascular integrity. Our results suggest that regions with vasogenic edema alone are not likely to develop low ADC by 48 h and may undergo recovery.
Citation:Taheri S, Candelario-Jalil E, Estrada EY, Rosenberg GA (2009) Spatiotemporal Correlations between Blood-Brain Barrier Permeability and Apparent Diffusion Coefficient in a Rat Model of Ischemic Stroke. PLoS ONE 4(8): e6597. doi:10.1371/journal.pone.0006597
Editor:Christoph Kleinschnitz, Julius-Maximilians-Universita¨t Wu¨rzburg, Germany
ReceivedMay 21, 2009;AcceptedJuly 16, 2009;PublishedAugust 11, 2009
Copyright:ß2009 Taheri et al. This is an open-access article distributed under the terms of the Creative Commons Attribution License, which permits unrestricted use, distribution, and reproduction in any medium, provided the original author and source are credited.
Funding:This work was supported by grants from the National Institutes of Health (NIH) to GAR (R01 NS045847 and R01 NS052305). ECJ was supported by a research grant from the American Heart Association (AHA, 0720160Z, Pacific Mountain Affiliate). The funding agencies had no role in study design, data collection and analysis, decision to publish, or preparation of the manuscript.
Competing Interests:The authors have declared that no competing interests exist. * E-mail: [email protected]
.These authors contributed equally to this work.
Introduction
The use of magnetic resonance imaging (MRI) techniques, including apparent diffusion coefficient (ADC) obtained by diffu-sion-weighted imaging (DWI), perfudiffu-sion-weighted imaging (PWI), and contrast-enhanced MRI has been increasingly important in evaluating various treatment strategies in both experimental models of cerebral ischemia [1–4] and stroke patients [5–10]. Advances in imaging speed and computer analysis permit multimodal assessments of individual pixels, which improve predictions of tissue outcome.
Blood-brain barrier (BBB) disruption is an important patholog-ical hallmark of ischemia with or without reperfusion, and it is associated with vasogenic edema, hemorrhagic transformation, and has been linked to poor outcome in stroke patients [8,9]. Using either the 14C-Sucrose quantitative method or the extravasation of Evans blue-albumin, others and we had previously described a biphasic opening of the BBB in the rat middle cerebral artery occlusion (MCAO) stroke model [11–13]. There is an early significant increase in BBB opening after 2–3 h of reperfusion following MCAO, the timing of which depends on the duration of ischemia [14]. After this initial opening, the BBB restores its functions and no significant changes in permeability to either14C-sucrose or Evans blue-albumin are observed until 24 to 48 h after reperfusion. Dramatic BBB breakdown occurs after
48 h of recirculation, which is accompanied by significant vasogenic edema and leukocyte infiltration [11–13].
Previous studies have reported an associated decline in ADC intensity in ischemic lesion induced by MCAO in animal models [15,16]. Although there is not a strong consensus on the origin of the decline in ADC in ischemic lesions, swelling of cells and limiting the intracellular space are plausible explanations for the reduction of ADC of water. Reperfusion after focal cerebral ischemia leads to a regional disruption of the BBB and vasogenic edema [14,17]. Regional changes in BBB permeability and ADC after stroke have been associated with different pathophysiological alterations in the lesion area [17–19]. However, the correlation between the alteration of ADC and the BBB permeability has been incompletely characterized. Development of anin vivomethod of BBB permeability quantification using fast T1 sequences and multiple times sampling after contrast injection has made it possible to perform pixel-by-pixel measurement of permeability coefficient and ADC. It has been previously shown that MRI-based BBB quantification using Gd-DTPA highly correlates with the14C-sucrose method to quantify BBB breakdown in rat focal cerebral ischemia [20,21].
cerebral ischemia in a rat model. We next determined whether ADC reduction correlated with BBB permeability changes in different brain areas. Cerebral cortex and subcortical regions were studied at 3 and 48 h of reperfusion, representing the early and delayed BBB disruption, respectively. Quantitative spatial and temporal information about the blood-to-brain influx rate constants (Ki) was estimated from a series of dynamic contrast-enhanced
magnetic resonance images (D-CEMRI) [22–25]. ADC values were calculated from images obtained by DWI. Using generalized linear modeling techniques, we show a region-specific lesion evolution where the extent of initial ischemic injury reflected by low values in ADC maps determines BBB permeability changes.
Results
Marked regional differences were observed in the degree of increment in BBB permeability and reduction in ADC values
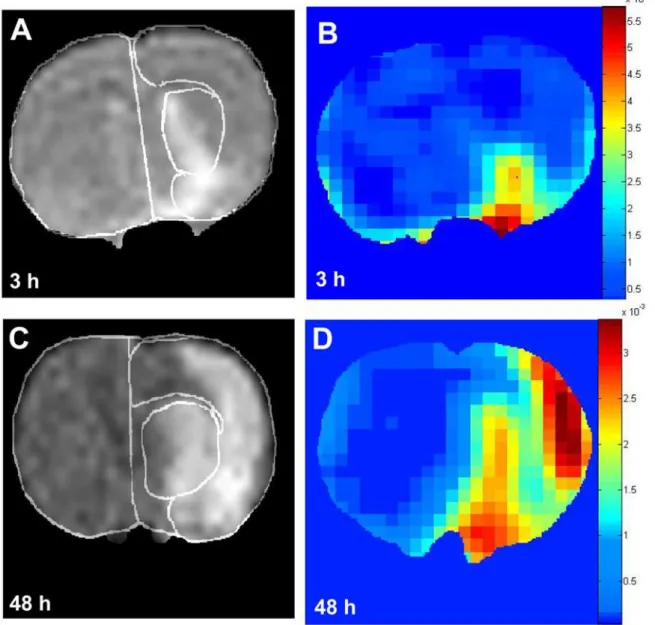
(calculated from DWI images) in cerebral cortex and subcortical regions at 3 and 48 h following 2 h of MCAO. The extent of the lesion calculated based on the altered ADC and BBB permeability was larger at 48 h compared with 3 h in cerebral cortex and subcortical areas.Figure 1 shows representative DWI and BBB permeability maps at 3 and 48 h of reperfusion. As expected, lesion size at 3 h after the reperfusion is smaller than at 48 h. Moreover, DWI images show that the lesion at 3 h is confined to the subcortical and partly to cortical areas (mainly piriform cortex), while at 48 h of recirculation the lesion extends to large areas of the cerebral cortex and subcortex (Fig. 1A and 1C). Based on ADC maps obtained from DWI, the progression of lesion is from the subcortical area towards the cortical area.
Permeability maps show dramatic increases in areas with significant BBB leakage between 3 and 48 h of reperfusion in both cerebral cortex and subcortex (Fig. 1B and 1D). However, at the earlier time point (3 h) the increased permeability was confined to
the piriform cortex and small areas of the striatum (Fig. 1B). Using 14C-sucrose to evaluate BBB disruption, previous studies have shown that the piriform cortex is the main site in early BBB injury [12,26].
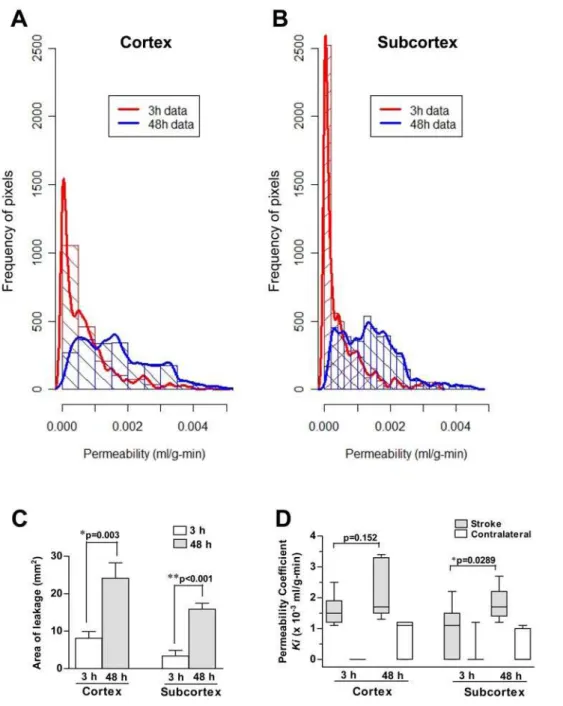
The spatiotemporal distribution of BBB permeability for cerebral cortex and subcortical areas is presented inFig. 2. The BBB permeability at 3 h of reperfusion is not as high as the permeability at 48 h for both cerebral cortex and subcortical areas, as shown by the area under the curve (Fig. 2A and 2B). There was a marked increase in the percentage of pixels with Ki
higher than 0.001 ml/g-min between 3 and 48 h of recirculation (24.5% at 3 hvs.68.4% at 48 h for cerebral cortex, p,0.0001,x2
test; and 17% at 3 hvs.64.2% at 48 h for the subcortical regions,
p,0.0001,x2test). In a rat model of focal cerebral ischemia, it has
been previously shown that Kivalues higher than 0.001 ml/g-min
are abnormal [27]. We calculated the area of leakage by multiplying the number of pixels with Ki values higher than
0.001 ml/g-min by the pixel size. Quantitative data shown in
Fig. 2Cindicate that there is a statistically significant (p,0.01) increase in the area of leakage in the ipsilateral cortex and subcortex between 3 and 48 h of reperfusion. For each brain region, we calculated the median of Kivalues for ipsilateral (stroke)
and contralateral side and found a significant increase in the BBB permeability values between the ischemic and contralateral side at a given time point (Fig. 2D). However, a significant increase (p,0.03) in the Ki values was only found for the subcortex
Figure 2. Cumulative spatiotemporal distribution of BBB permeability for cerebral cortex and subcortex (Panels A and B).Statistical analysis of raw data presented inAandBwas performed by calculating the area of leakage for each brain region with Kivalues higher than 0.001 ml/ g-min. As shown in panelCandD, BBB permeability changes at 48 h were significantly higher than at 3 h. The vertical axis shows the frequency of pixels with different Kivalues (shown in the horizontal axis).
between 3 and 48 h of reperfusion. There was a trend toward an increase in the Kivalues at 48 h with respect to 3 h in the cerebral
cortex, but this increase did not reach statistical significance (Fig. 2D).
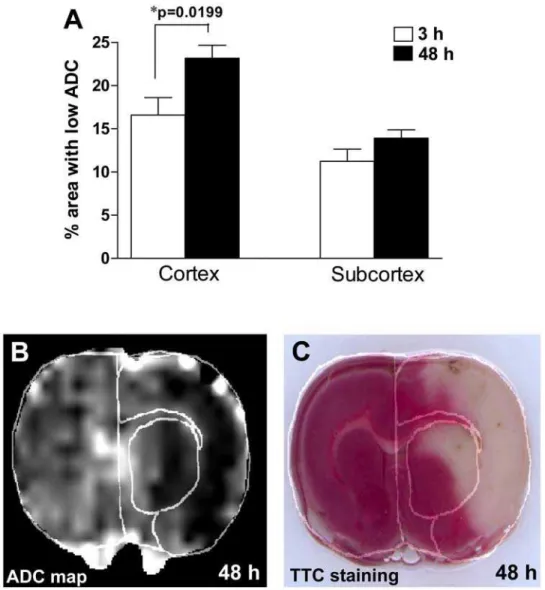
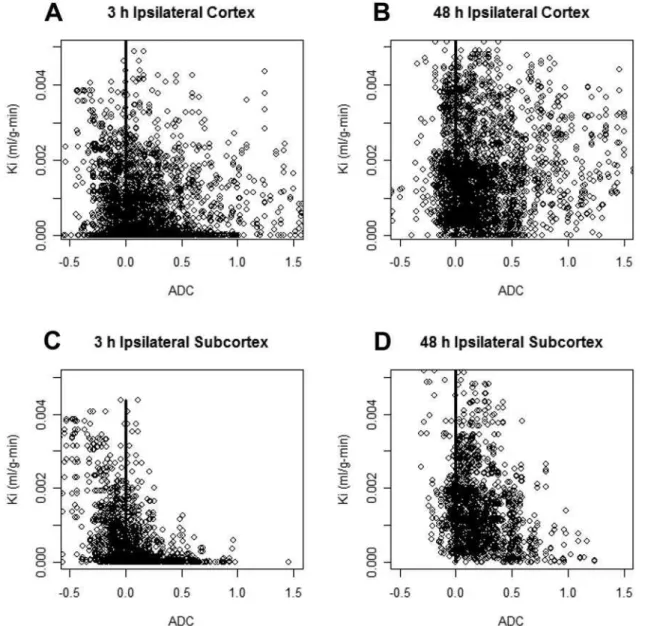
We calculated the ipsilateral area with ADC values less than 80% of the mean contralateral hemisphere values on ADC maps for each experimental animal at 3 and 48 h of recirculation. As expected, we found larger areas with ADC reduction at 48 h as compared with 3 h in the cerebral cortex (Fig. 3). However, we did not find a significant increase in areas with low ADC between 3 and 48 h in the subcortex (Fig. 3A). Tissue damage observed at 48 h in ADC maps (Fig. 3B) was confirmed by histological staining using 2,3,5-triphenyltetrazolium chloride (TTC) (Fig. 3C). Changes in ADC reflect both a decrease due to cytotoxic edema and an increase from vasogenic edema, which may be related to BBB permeability changes. Thus, we established a pixel-by-pixel correlation between ADC and BBB permeability values for the ipsilateral side of both cerebral cortex and subcortex at the two different time points under study. Scatterplots shown in Fig. 4
indicate that there are more pixels with increased permeability (Ki.0.001 ml/g-min) at 48 h than at 3 h, supporting data shown
inFig. 2. We observed a marked heterogeneity in the population of pixels with high Kivalues and either reduced or normal ADC
values. At 3 h, we found a large number of pixels with very low Ki
(,0.001 ml/g-min) and a wide range of ADC values, from low to normal (higher than 80% of the contralateral ADC average). Between 3 and 48 h, we observed a shift in the population of pixels with low Kiand either low or normal ADC toward a higher Ki
value (Fig. 4). We identified three main different populations of pixels within each brain area in the ipsilateral side: high Ki
(.0.001 ml/g-min) and low ADC (lower than 80% of the contralateral ADC average), high Ki and normal ADC, and
normal Ki and low ADC. We calculated the area for each
population of pixels (Fig. 5). We built a color-coded Ki-ADC map
where the three main populations of pixels with different Kiand
ADC values are spatially represented for both time points (Fig. 5A
and 5B). For the cerebral cortex and subcortex, we found a
dramatic significant increase between 3 and 48 h in the areas with high Kiand either low or normal ADC (Fig. 5C and 5D). In
cerebral cortex, we did not find a statistically significant reduction in the areas with normal Kiand low ADC over time (Fig. 5C).
However, in the subcortical regions there was a significant
Figure 3. A.Changes in the area with hypointensive ADC at 3 and 48 h of reperfusion. Significant increases in areas with ADC abnormalities were found between 3 and 48 h in the cerebral cortex. Brain damage observed at 48 h in ADC maps (B) was confirmed histologically using TTC staining (C). Areas of the subcortex and cerebral cortex are demarcated in panelsBandC.
decrease in the areas with reduced ADC and normal Kivalues
(Fig. 5D).
Discussion
We report a MRI-based pixelwise analysis of BBB permeability and ADC values in a clinically relevant model of ischemic stroke. These data indicate that BBB breakdown is not only restricted to areas with reduced ADC. Furthermore, areas with low ADC values do not always have increased BBB opening. Having both spatial and intensity data provides a more accurate picture of the BBB disruption. Adding ADC information more accurately characterizes the state of the tissue pixel by pixel. Such unique information can be used to assess the role of ischemia (ADC) on vascular integrity (BBB permeability). With this information, the benefits of a treatment can be more clearly assessed.
The increase in tissue area in regions with high Kiand low ADC
suggest that these are the core areas that are most severely damaged and are unlikely to be salvageable. A region with high Ki
and normal ADC has growth but to a lesser degree, and some return of function may be possible. This might suggest secondary permeability alterations in areas surrounding the ischemic core, while cellular viability is not compromised. However, part of the region with preservation of the BBB integrity, in spite of an ischemic insult that causes low ADC, had some chance of recovery. We found that sections of this region were less affected at 48 h; this reduction may also be interpreted as showing removal of edema fluid, which may be possible when the capillary is intact. In such a case, agents that act to preserve capillary function may provide the basis for cellular recovery even in the event of injury to other cells.
Our data are in line with previous reports indicating that over time, the amount of tissue lost increases and the cerebral cortex accounts for most of the brain tissue that eventually becomes infarcted [14,28,29]. It is now well documented that neuroin-flammatory mechanisms are responsible for the neuronal death in the ischemic penumbra, a potentially recoverable tissue surround-ing the infarct core [30]. Since the pixels with high Kiand normal
Figure 4. Scatterplots and fit lines showing the correlations between ADC and Kifor the ipsilateral side of cerebral cortex (A and B)
and subcortex (C and D) at 3 and 48 h of reperfusion following 2 h of MCAO in the rat.
Figure 5. Analysis of correlations between BBB permeability and the ADC values in cerebral cortex and subcortex.Color-coded Ki -ADC maps (AandB) show the three main populations of pixels with different Kiand ADC values for both time points. Quantitative changes of each area over time are presented in panelsCandD. Based on the abnormality of ADC values and the BBB permeability; we have recognized three different areas in the ipsilateral side. These areas are labeled as tissue signatures corresponding to different pathophysiology in the evolution of lesion. Each tissue signature is represented by a different color at two different time points, 3 and 48 h of reperfusion. *p,0.05 and **p,0.01 with respect to 3 h.
ADC were surrounding the core, this region most likely represent penumbra, which is consistent with inflammatory BBB opening.
Our present data indicate that in the cerebral cortex the extravascular Gd-DTPA enhancement, indicative of BBB break-down, is observed in large areas and the BBB permeability coefficients at 48 h are not significantly different from 3 h. Unlike the cortex, in the subcortical areas we found significant differences in both the degree and area of leakage between 3 and 48 h. The reason(s) for these regional differences is not presently known, but could be related to the degree of tissue infarction. By 48 h of recirculation, much of the ischemic core (mainly subcortex) had undergone cell death, thus the BBB is disrupted, and the contrast agent could accumulate resulting in high Kivalues. A recent study
utilizing a rat model of 90 min of transient focal cerebral ischemia found that there is an inverse correlation between Kiand ADC
values [31], which suggest that the degree of ischemic brain damage may influence the extent of BBB permeability.
Detection of BBB opening using D-CEMRI largely depends on the delivery of the paramagnetic contrast agent to the affected areas of the brain. Thus, it may be possible that we missed the BBB damage in areas with marked ADC hypointensities due to inefficient delivery of Gd-DTPA. This could have been the result of disturbances in cerebral blood flow (CBF) in the affected region. Whether or not regional reductions in CBF determining the delivery of Gd-DTPA may be a confounder in our results is difficult to recognize based on our data.
An ADC threshold set at approximately 80% of the normal ADC has been found to correlate well with the loss of ATP and breakdown of energy metabolism in an animal model of temporary focal cerebral ischemia [32]. However, using proton MR spectroscopic imaging along with several MRI techniques including ADC mapping, a previous human study showed that there is a large metabolic heterogeneity in tissue damage inside ischemic areas showing similar decreased mean ADC values [19]. This suggests that areas with similar reduction in ADC values have different stages of ischemic injury, and possibly degree of BBB permeability changes.
We used data from two groups: one at 3 h and the other at 48 h. This limited this study to two time points after recirculation, representing the early (3 h) and delayed BBB disruption (48 h) in this rat stroke model [11–13]. As confirmed statistically, we observed low variability in the studied parameters at these time points between the two groups subjected to MCAO. Thus, changes seen between 3 and 48 h reflect progression of ischemic injury. The homogeneity of the groups allowed for the analysis of the correlations between ADC and BBB alterations at 3 and 48 h in these two groups even though they are formed by different animals. It would have been ideal to perform a longitudinal study using the same animals. We believe that future studies have to be conducted to include other time points to better characterize the temporal changes in water homeostasis and its relation to cell death after ischemia.
Based on data fromFigs. 4and5, we hypothesized that there might be a model representing the relationships between Kiand
ADC with the temporal evolution of the infarct in this rat stroke model. A previous study has utilized the generalized linear modeling (GLM) technique for finding structural correlations between parameters obtained by multimodal MRI in human cerebral ischemia [33]. To obtain a simple predictive model of tissue fate in cerebral cortex, we correlated ADC and BBB permeability for the two time points assuming that data are independently and identically distributed. Using GLM over all pixel values, we obtained the following linear structural equation for predicting Kivalues at 48 h in the cerebral cortex:
Ki48~2:765|10 {5z1
:991|10
{3|ADC
48z1:138|10
{4|ADC 03
z1:453|10
{1|K
i03 pvaluesv0 :001
ð Þ:
This model indicates that it is possible to predict the BBB permeability in the cerebral cortex at the pixel level at 48 h of reperfusion, and thus to build the permeability map at this time point from the ADC and Kivalues at 3 h and the ADC at 48 h in
the cerebral cortex.
We then tested this model for the subcortex area and found that the coefficient for ADC at 3 h was not statistically significant indicating that ADC at 3 h is not a component of the corresponding structural model. Thus, the equation for predicting Ki values at 48 h for the subcortical regions reduces to the
following equation:
Ki48~1:368|10 {5z2
:210|10
{3|ADC 48
z7:333|10
{2|K
i03p valuesv0 :001
ð Þ:
The differences in these two structural equations for cortical and subcortical areas clearly indicate that the nature of correlations between BBB permeability and edema in these two regions are different.
Over time, we observed reduction in the area with low ADC and normal Ki(cytotoxic edema) and increase in regions with low
ADC and high Ki (cytotoxic+vasogenic edema), suggesting that
early hypoxia with preserved BBB function grows into core tissue unlikely to recover. On the other hand, pixels with normal ADC and high Ki (vasogenic edema) showed only moderate growth.
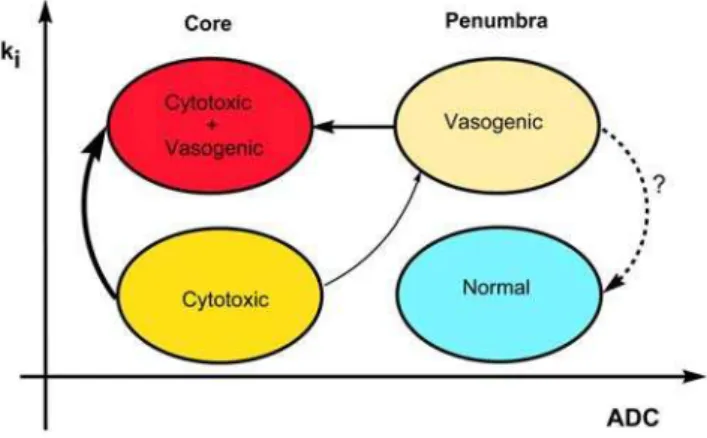
When the BBB is disrupted and the cell has not swollen yet, the vasogenic edema occurs. However, when the cell begins to swell with or without BBB injury, cytotoxic edema occurs. Generally, there is some combination of both with one predominating. A proposed model representing transition between different states of tissue is shown inFig. 6.
Figure 6. Proposed model showing possible transitions between different states of tissue injury during the progres-sion of ischemic stroke.Cytotoxic edema is characterized by low ADC values with preserved BBB function (normal Ki), while vasogenic edema is identified by high Kivalues. The core of the infarct display
high Ki and low ADC values (a mixture of cytotoxic and vasogenic
edema). Based on data from the merged ADC+Kimaps (Fig. 5), the main transition occurs from areas with cytotoxic edema to areas with both cytotoxic and vasogenic edema (core of the infarct), which is depicted with a thicker arrow in the schematic.
While there is consensus that a drop in ADC is a harbinger of cell death, the implications of changes in BBB permeability are less clear. Combining ADC with Kiprovides insights into the role of
permeability. Assuming that high Kiwith normal ADC equates
with inflammatory BBB opening, pixels with these characteristics have the potential to recover. However, when ADC is low, suggesting more severe hypoxia, the potential for evolution into core-like pixels appears to be greater. Although the variability in the individual groups was small, further studies will be needed in the same animal over multiple times to validate a predictive model. Finally, the ability to separate vasogenic and cytotoxic components, even if not totally precise, will be very informative in testing drugs and will have us closer to the ability to use multimodal MRI to test drugs in clinical trials.
Materials and Methods
Rat Model of Focal Cerebral Ischemia
All animal studies were approved by the University of New Mexico Animal Care and Use Committee and conformed to NIH guidelines for use of animals in research. Sixteen Wistar rats weighing 280–300 g were used in this study. The rat focal cerebral ischemia model has been described in detail previously [4,12]. In brief, the right hemisphere focal cerebral ischemia was induced in animals by inserting a nylon filament through the external carotid artery (ECA) in order to occlude the middle cerebral artery. After 2 h of ischemia, the filament was removed from the ECA to allow reperfusion.
Magnetic Resonance Imaging (MRI)
For the MRI study, two groups of rats were used: the first group consisting of 8 rats was studied 3 h after the reperfusion while the second group of rats was studied at 48 h (n = 8). Prior to MRI, rats were anesthetized with 2.5% isoflurane at 1 L/min N2O/O2
(70:30) flow under spontaneous respiration. Heart rate and respiration rate were continuously monitored during scanning and maintained within normal values. MR imaging was performed on a 4.7T horizontal bore BiospecHdedicated research MR scanner (Bruker Biospin, Billerica, MA), equipped with 500 mT/m (rise time 80–120ms) gradient set (for performing small animal imaging) and a small bore linear RF coil (ID 72 mm).
ADC Measurements
First, T2 weighted and diffusion weighted imaging (DWI) were performed with the following parameters; T2 weighted-2D RARE (Rapid Acquisition with Relaxation Enhancement), TR/TE 4000/65 ms, FOV 3.2 cm63.2 cm, slice thickness 2 mm, slice gap 1 mm, number of slices 2, matrix 2566128, number of averages 5, receiver bandwidth 100 kHz; DWI - 2D Diffusion weighted RARE, TR/TE 2000/31.2 ms, FOV 3.2 cm63.2 cm, slice thickness 2 mm, slice gap 1 mm, number of slices 2, matrix 64664, number of averages 22, receiver bandwidth 100 kHz,
d = 5 ms, D = 20 ms, b value of 0 and 900 s mm22
, diffusion gradient along the slice select direction. From DWI images, pixel-by-pixel maps of ADC of water were estimated [4]. We utilized an ADC threshold defined as pixels with ADC values lower than 80% of the mean contralateral hemisphere values on the ADC map [34]. The slices containing the lesion were identified from the T2 weighted structural images and same slice location was prescribed for all the subsequent MR protocols. We carefully separated the cerebral cortex and subcortex by registering the anatomical images (T2-w) into ADC and BBB maps and demarcating the brain areas in each slice. At 48 h of reperfusion, tissue damage seen in ADC maps was confirmed using the TTC staining. Two-mm thick brain
slices were incubated at 37uC for 30 min in a 2% solution of TTC as described in detail in our previous study [11].
BBB Permeability Measurements
BBB permeability was studied with a modification of D-CEMRI [21,25] as described in our recent studies [4,35]. Rats were injected 0.1 mmol/kg of gadolinium-diethylene-triamine-pentaa-cetic acid (Gd-DTPA, MW = 938 Da; Bayer Healthcare) as a bolus into the femoral vein via an indwelling catheter, followed by imaging with rapid T1 mapping protocol, collecting 14 images over 45 minutes. We visually checked the linearity of the plots [21] for the whole duration of the T1 imaging. The following optimized MR imaging parameters were used for this protocol: axial plane, two-dimension, inversion recovery-spin echo-echo planar imaging (IR-SE-EPI), TR/TE 8 s/19.4 ms, FOV 4.0 cm64.0 cm, slice thickness 2 mm, slice gap 1 mm, number of slices 2, matrix 64664, number of averages 2, receiver bandwidth 250 kHz. Non
slice selective magnetization inversion was performed using a hyperbolic secant (sech) RF pulse with pulse width 4 ms. The T1 mapping specific parameters for this protocol were: time for inversion (TI) = (100+6006n) ms where n = 0, 1, 2, …12, number
of TI points (n) is 13. The total scan time was 3 minutes and 12 seconds for each time point. The MRI protocol parameters for rapid T1 mapping were optimized for accuracy of T1 relaxation time estimate in a single, normal rat brain (control) prior to including that animal in the study.
MRI Data Analysis
Data processing was performed with custom software written in MATLAB (Mathworks, Natick, MA). Image analysis was per-formed using ImageJ (NIH, Bethesda, MD) and MRVision (Winchester, MA) software packages.
Permeability maps were constructed using time series data obtained by D-CEMRI, and a pixel by pixel method based on a compartmental modeling technique first proposed by Patlak [36] and used by others [4,17,21]. In brief, the method is based on the leakage of the contrast agent from plasma compartment into brain compartment through BBB resulting in the change of the MR signal intensity. The rate of changes in MRI signal intensity relates to BBB permeability (Ki). Optimal value for Kifor each pixel was
calculated by fitting the Patlak model equations into the time series of the pixel intensity employing nonlinear regression analysis. Then the Kivalue of each pixel is color-coded to construct a BBB
permeability map, where pixels with high intensity color represent high BBB permeability locations in the brain. Based on a previous report [27], we considered Kivalues higher than 0.001 ml/g-min
as increased permeability. For correlation analysis between ADC and Ki maps, we performed image registration using
image-processing toolbox of Matlab.
Statistical Analysis
The data were subjected to statistical analysis for two related purposes: description and inference. For descriptive statistics, data were separated into four different sets; ADC for cerebral cortex and subcortical areas, permeability for cerebral cortex and subcortical areas by accumulating pixel-based data of each region into a different set. ThenRstatistical computing environment (R
Mann-Whitney test (non-parametric data) were used for the statistical analyses. The increase in the percentage of pixels with high Ki
(.0.001 ml/g-min) between 3 and 48 h was analyzed running a 262 contingency table withx2statistics. A p value less than 0.05
was considered statistically significant.
Author Contributions
Conceived and designed the experiments: ST ECJ GAR. Performed the experiments: ST ECJ EYE. Analyzed the data: ST ECJ. Wrote the paper: ST ECJ GAR.
References
1. Jiang Q, Zhang RL, Zhang ZG, Ewing JR, Divine GW, et al. (1998) Diffusion-, T2-, and perfusion-weighted nuclear magnetic resonance imaging of middle cerebral artery embolic stroke and recombinant tissue plasminogen activator intervention in the rat. J Cereb Blood Flow Metab 18: 758–767.
2. Engelhorn T, Doerfler A, Kastrup A, Beaulieu C, de Crespigny A, et al. (1999) Decompressive craniectomy, reperfusion, or a combination for early treatment of acute ‘‘malignant’’ cerebral hemispheric stroke in rats? Potential mechanisms studied by MRI. Stroke 30: 1456–1463.
3. Dijkhuizen RM, Asahi M, Wu O, Rosen BR, Lo EH (2002) Rapid breakdown of microvascular barriers and subsequent hemorrhagic transformation after delayed recombinant tissue plasminogen activator treatment in a rat embolic stroke model. Stroke 33: 2100–2104.
4. Sood RR, Taheri S, Candelario-Jalil E, Estrada EY, Rosenberg GA (2008) Early beneficial effect of matrix metalloproteinase inhibition on blood-brain barrier permeability as measured by magnetic resonance imaging countered by impaired long-term recovery after stroke in rat brain. J Cereb Blood Flow Metab 28: 431–438.
5. Marks MP, Tong DC, Beaulieu C, Albers GW, de Crespigny A, et al. (1999) Evaluation of early reperfusion and i.v. tPA therapy using diffusion- and perfusion-weighted MRI. Neurology 52: 1792–1798.
6. Mitsias PD, Jacobs MA, Hammoud R, Pasnoor M, Santhakumar S, et al. (2002) Multiparametric MRI ISODATA ischemic lesion analysis: correlation with the clinical neurological deficit and single-parameter MRI techniques. Stroke 33: 2839–2844.
7. Lansberg MG, Thijs VN, Bammer R, Olivot JM, Marks MP, et al. (2008) The MRA-DWI mismatch identifies patients with stroke who are likely to benefit from reperfusion. Stroke 39: 2491–2496.
8. Warach S, Latour LL (2004) Evidence of reperfusion injury, exacerbated by thrombolytic therapy, in human focal brain ischemia using a novel imaging marker of early blood-brain barrier disruption. Stroke 35: 2659–2661. 9. Latour LL, Kang DW, Ezzeddine MA, Chalela JA, Warach S (2004) Early
blood-brain barrier disruption in human focal brain ischemia. Ann Neurol 56: 468–477.
10. Yang Q, Tress BM, Barber PA, Desmond PM, Darby DG, et al. (1999) Serial study of apparent diffusion coefficient and anisotropy in patients with acute stroke. Stroke 30: 2382–2390.
11. Candelario-Jalil E, Gonzalez-Falcon A, Garcia-Cabrera M, Leon OS, Fiebich BL (2007) Post-ischaemic treatment with the cyclooxygenase-2 inhibitor nimesulide reduces blood-brain barrier disruption and leukocyte infiltration following transient focal cerebral ischaemia in rats. J Neurochem 100: 1108–1120.
12. Rosenberg GA, Estrada EY, Dencoff JE (1998) Matrix metalloproteinases and TIMPs are associated with blood-brain barrier opening after reperfusion in rat brain. Stroke 29: 2189–2195.
13. Belayev L, Busto R, Zhao W, Ginsberg MD (1996) Quantitative evaluation of blood-brain barrier permeability following middle cerebral artery occlusion in rats. Brain Res 739: 88–96.
14. Neumann-Haefelin T, Kastrup A, de Crespigny A, Yenari MA, Ringer T, et al. (2000) Serial MRI after transient focal cerebral ischemia in rats: dynamics of tissue injury, blood-brain barrier damage, and edema formation. Stroke 31: 1965–1973.
15. Plaschke K, Bardenheuer HJ, Martin E, Sartor K, Heiland S (2006) Evolution of apparent diffusion coefficient and transverse relaxation time (T2) in the subchronic stage of global cerebral oligemia in different rat models. Exp Brain Res 169: 361–368.
16. Ringer TM, Neumann-Haefelin T, Sobel RA, Moseley ME, Yenari MA (2001) Reversal of early diffusion-weighted magnetic resonance imaging abnormalities does not necessarily reflect tissue salvage in experimental cerebral ischemia. Stroke 32: 2362–2369.
17. Nagaraja TN, Karki K, Ewing JR, Croxen RL, Knight RA (2008) Identification of variations in blood-brain barrier opening after cerebral ischemia by dual contrast-enhanced magnetic resonance imaging and T1sat measurements. Stroke 39: 427–432.
18. Liu KF, Li F, Tatlisumak T, Garcia JH, Sotak CH, et al. (2001) Regional variations in the apparent diffusion coefficient and the intracellular distribution of water in rat brain during acute focal ischemia. Stroke 32: 1897–1905.
19. Nicoli F, Lefur Y, Denis B, Ranjeva JP, Confort-Gouny S, et al. (2003) Metabolic counterpart of decreased apparent diffusion coefficient during hyperacute ischemic stroke: a brain proton magnetic resonance spectroscopic imaging study. Stroke 34: e82–e88.
20. Knight RA, Nagaraja TN, Ewing JR, Nagesh V, Whitton PA, et al. (2005) Quantitation and localization of blood-to-brain influx by magnetic resonance imaging and quantitative autoradiography in a model of transient focal ischemia. Magn Reson Med 54: 813–821.
21. Ewing JR, Knight RA, Nagaraja TN, Yee JS, Nagesh V, et al. (2003) Patlak plots of Gd-DTPA MRI data yield blood-brain transfer constants concordant with those of 14C-sucrose in areas of blood-brain opening. Magn Reson Med 50: 283–292.
22. Larsson HB, Stubgaard M, Frederiksen JL, Jensen M, Henriksen O, et al. (1990) Quantitation of blood-brain barrier defect by magnetic resonance imaging and gadolinium-DTPA in patients with multiple sclerosis and brain tumors. Magn Reson Med 16: 117–131.
23. Tofts PS (1996) Optimal detection of blood-brain barrier defects with Gd-DTPA MRI-the influences of delayed imaging and optimised repetition time. Magn Reson Imaging 14: 373–380.
24. Tofts PS, Kermode AG (1991) Measurement of the blood-brain barrier permeability and leakage space using dynamic MR imaging. 1. Fundamental concepts. Magn Reson Med 17: 357–367.
25. Patlak CS, Blasberg RG (1985) Graphical evaluation of blood-to-brain transfer constants from multiple-time uptake data. Generalizations. J Cereb Blood Flow Metab 5: 584–590.
26. Yang Y, Estrada EY, Thompson JF, Liu W, Rosenberg GA (2007) Matrix metalloproteinase-mediated disruption of tight junction proteins in cerebral vessels is reversed by synthetic matrix metalloproteinase inhibitor in focal ischemia in rat. J Cereb Blood Flow Metab 27: 697–709.
27. Jiang Q, Ewing JR, Ding GL, Zhang L, Zhang ZG, et al. (2005) Quantitative evaluation of BBB permeability after embolic stroke in rat using MRI. J Cereb Blood Flow Metab 25: 583–592.
28. Carano RA, Li F, Irie K, Helmer KG, Silva MD, et al. (2000) Multispectral analysis of the temporal evolution of cerebral ischemia in the rat brain. J Magn Reson Imaging 12: 842–858.
29. Li F, Silva MD, Sotak CH, Fisher M (2000) Temporal evolution of ischemic injury evaluated with diffusion-, perfusion-, and T2-weighted MRI. Neurology 54: 689–696.
30. Dirnagl U, Iadecola C, Moskowitz MA (1999) Pathobiology of ischaemic stroke: an integrated view. Trends Neurosci 22: 391–397.
31. Abo-Ramadan U, Durukan A, Pitkonen M, Marinkovic I, Tatlisumak E, et al. (2009) Post-ischemic leakiness of the blood-brain barrier: A quantitative and systematic assessment by Patlak plots. Exp Neurol:(in press).
32. Olah L, Wecker S, Hoehn M (2000) Secondary deterioration of apparent diffusion coefficient after 1-hour transient focal cerebral ischemia in rats. J Cereb Blood Flow Metab 20: 1474–1482.
33. Wu O, Koroshetz WJ, Ostergaard L, Buonanno FS, Copen WA, et al. (2001) Predicting tissue outcome in acute human cerebral ischemia using combined diffusion- and perfusion-weighted MR imaging. Stroke 32: 933–942. 34. Hoehn-Berlage M, Norris DG, Kohno K, Mies G, Leibfritz D, et al. (1995)
Evolution of regional changes in apparent diffusion coefficient during focal ischemia of rat brain: the relationship of quantitative diffusion NMR imaging to reduction in cerebral blood flow and metabolic disturbances. J Cereb Blood Flow Metab 15: 1002–1011.
35. Candelario-Jalil E, Taheri S, Yang Y, Sood R, Grossetete M, et al. (2007) Cyclooxygenase inhibition limits blood-brain barrier disruption following intracerebral injection of tumor necrosis factor-alpha in the rat. J Pharmacol Exp Ther 323: 488–498.
36. Patlak CS, Blasberg RG, Fenstermacher JD (1983) Graphical evaluation of blood-to-brain transfer constants from multiple-time uptake data. J Cereb Blood Flow Metab 3: 1–7.
37. R-Project (2007) The R Project for Statistical Computing. http://www.r-project. org.