Synergistic Interactions between Alzheimer’s Aβ40 and
Aβ42 on the Surface of Primary Neurons Revealed by
Single Molecule Microscopy
Chun-Chieh Chang
1*, John Christian Althaus
2, Cynthia J. L. Carruthers
2, Michael A. Sutton
2,3, Duncan G.
Steel
1,4,5, Ari Gafni
1,61 Department of Biophysics, University of Michigan, Ann Arbor, Michigan, United States of America, 2 Molecular and Behavioral Neuroscience Institute, University of Michigan, Ann Arbor, Michigan, United States of America, 3 Department of Molecular and Integrative Physiology, University of Michigan, Ann Arbor, Michigan, United States of America, 4 Department of Physics, University of Michigan, Ann Arbor, Michigan, United States of America, 5 Department of Electrical Engineering and Computer Science, University of Michigan, Ann Arbor, Michigan, United States of America, 6 Department of Biological Chemistry, University of Michigan, Ann Arbor, Michigan, United States of America
Abstract
Two amyloid- peptides (A 40 and A 4β) feature prominently in the extracellular brain deposits associated with Alzheimer’s disease. While A 40 is the prevalent form in the cerebrospinal fluid, the fraction of A 4β increases in the amyloid deposits over the course of disease development. The low in vivo concentration (pM-nM) and metastable nature of A oligomers have made identification of their size, composition, cellular binding sites and mechanism of action challenging and elusive. Furthermore, recent studies have suggested that synergistic effects between A 40 and A 4β alter both the formation and stability of various peptide oligomers as well as their cytotoxicity. These studies often utilized A oligomers that were prepared in solution and at μM peptide concentrations. The current work was performed using physiological A concentrations and single-molecule microscopy to follow peptide binding and association on primary cultured neurons. When the cells were exposed to a 1:1 mixture of nM A 40:A 4β, significantly larger membrane-bound oligomers developed compared to those formed from either peptide alone. Fluorescence resonance energy transfer experiments at the single molecule level reveal that these larger oligomers contained both A 40 and A 4β, but that the growth of these oligomers was predominantly by addition of A 4β. Both pure peptides form very few oligomers larger than dimers, but either membrane bound A 40/4β complex, or A 40, bind A 4β to form increasingly larger oligomers. These findings may explain how A 4β-dominant oligomers, suspected of being more cytotoxic, develop on the neuronal membrane under physiological conditions.
Citation: Chang C-C, Althaus JC, Carruthers CJL, Sutton MA, Steel DG, et al. (β01γ) Synergistic Interactions between Alzheimer’s A 40 and A 4β on the Surface of Primary Neurons Revealed by Single Molecule Microscopy. PLoS ONE 8(1β): e8β1γ9. doi:10.1γ71/journal.pone.008β1γ9
Editor: Walter Lukiw, Louisiana State University Health Sciences Center, United States of America Received July 15, β01γ; Accepted October β1, β01γ; Published December β, β01γ
Copyright: © β01γ Chang et al. This is an open-access article distributed under the terms of the Creative Commons Attribution License, which permits unrestricted use, distribution, and reproduction in any medium, provided the original author and source are credited.
Funding: This work was supported by National Institutes of Health (http://www.nih.gov/) 1R01AG0γββ76-01A1 and 5Rβ1AG0γγ7490β. The funders had no role in study design, data collection and analysis, decision to publish, or preparation of the manuscript.
Competing interests: The authors have declared that no competing interests exist. * E-mail: [email protected]
Introduction
Amyloid deposits in the brain, a hallmark of Alzheimer’s disease, are largely composed of two peptides, A 40 and A 4β, produced by the proteolytic cleavage of the amyloid precursor protein by - and -secretases. The two amyloid peptides differ only in the presence of an Ile–Ala dipeptide at the C-terminus of A 4β [1]. Although A 40 is produced in large abundance over A 4β, the latter is the majority peptide in the brain plaques [β–4] and an increase in the A 4β/A 40 ratio in the plasma is associated with familial forms of Alzheimer’s disease (AD) [5,6], while a reduction of A 4β concentration correlates with a decreased risk for AD [7].
Initial reports of a correlation between extent amyloid deposits and AD severity lead to the amyloid hypothesis for the disease; however, extensive recent work has revealed that neuronal damage is associated with small oligomeric species of A , leading to the peptide oligomer hypothesis for AD [8–14]. Indeed, elevated levels of A oligomers have been found to be a better indicator of disease in humans than plaque load [8,9,15,16]. More specifically, stabilized versions of A dimers or dimer aggregates were shown to reduce long-term potentiation in cultured neurons [17,18] and a comparison of cross-linked A dimers, trimers, and tetramers revealed that neurotoxicity increases nonlinearly with oligomer size [19]. Interestingly, numerous studies have shown that when A 4β is
incubated in solution at µM concentrations it possesses a considerably higher fibril formation rate than A 40 [β0,β1] and also forms larger, more cytotoxic, oligomers [ββ–β4].
Two different explanations could be proposed for the observed increase in the risk for AD with increased relative production of A 4β/A 40 ratio: 1. More potent cell disrupting oligomers are formed by A 4β, and their production rate rapidly increases at higher concentration of this peptide; or β. Synergistic interactions between A 40 and A 4β lead to the formation of mixed oligomers that are more pathogenic than oligomers formed by either peptide alone, and whose levels increase with increasing A 4β levels. While evidence for A 40-A 4β interactions has been documented in several of the studies listed above, these were all done using high (µM) concentrations of peptide, at least 1,000 times higher than the pM-nM concentration of A in brain tissue [8,9]. Moreover, the protocols used in these studies employed oligomers that were pre-made in solution and later added to the cultured cells. These oligomers are potentially significantly different, both in composition and properties, from the ones created at physiological peptide concentrations and in association with the neuronal membrane.
Studies using physiological concentrations of peptide, however, are experimentally challenging since they require cell–bound A species to be individually monitored over long periods of time at nanomolar to picomolar levels, the cell disrupting ones (likely a minority) need to be identified and their size, peptide composition and cellular interactions need to be characterized. An added difficulty is the fact that cell-bound A oligomers are heterogeneous and metastable, continuously interconverting between species [β5–β7] and their cellular membrane interactions are potentially complex and variable. For example, there is evidence that the peptide may associate with specific cellular receptors or protein complexes (e.g. NMDA receptors [β8,β9] and α7 nicotinic acetylcholine receptors [γ0]), it may associate with phosphatidylserine in the membrane [γ1], or bind to and insert directly into the lipid bilayer [γβ,γγ]. Since A is an amphiphilic peptide, the initial binding affinity of A is correlated with the polar interactions and anionic charge of lipid head groups [γ4]. Each of these modes of interaction reflects a different potential pathway to cell disruption.
Recently, our group [γ5–γ8] and others [γ9,40] employed single molecule microscopy, both in Total Internal Reflection Fluorescence (TIRF) and confocal to study the assembly and size distribution of A oligomers generated at physiological concentrations on the surface of model membranes, PC1β cells, SH-SY5Y neuroblastoma cells and cultured neuronal cells. We found that at these low peptide concentrations, only insignificant oligomerization occurred in solution even after five days of incubation, whereas the membrane facilitated the formation of surface bound oligomers with an obviously larger size distribution. Again with single molecule microscopy we also found that A 40 oligomers size correlates with conductance changes in a model membrane [γ5].
In the present study we extend our previous work to focus on synergistic interactions between A 40 and A 4β during their assembly into oligomers on the surface of primary cultured
neurons, at physiological concentrations of peptides. As discussed above, such synergy is potentially of great significance for the development of our understanding of the molecular events underlying cell disruption in AD. The identification of those oligomers that develop on the membrane at nM peptide concentrations is of special relevance.
To monitor peptide binding to the neuronal membrane and its assembly into oligomers we applied single-molecule microscopy. The results show that, at nM concentrations, both homogeneous (unmixed) A 40 and A 4β remained mostly monomeric in solution even after prolonged incubation, and formed primarily dimers on the surface of neurites showing no further growth [γ8]. In contrast, when the cells were exposed to a 1:1 mixture of A 40 and A 4β, significantly larger membrane-bound oligomers developed. By applying fluorescence resonance energy transfer (FRET) at the single molecule level we document that these larger oligomers contain both A 40 and A 4β and are stable against dissociation over several days. More strikingly, these studies reveal that the growth of the mixed oligomers occurs exclusively by the addition of A 4β, such that the membrane bound A 4β/A 40 ratio continuously increases with time. While it was not practical, with the limited “life expectancy” of cultured neurons, to allow for amyloid fibrils to form, the results provide picture consistent with the ratio of peptides found in the deposits seen in the brain of AD patients and transgenic mice [41–4γ].
Our results reveal that in the formation of oligomers on the neuronal membrane, there is a strong cooperativity between A 40 and A 4β that results in an increase in the fraction and absolute numbers of oligomers larger than the dominant dimers and trimers formed by either A 40 or A 4β in isolation. The data further indicates that this shift in the reaction products is due to either membrane bound A 40/4β complex, or A 40, that seeds the addition of A 4β to form increasingly larger oligomers. Potentially of significance to cellular toxicity, the findings reported here may explain how A 4β-dominant oligomers, suspected of being more cytotoxic, develop on the neuronal membrane under physiological conditions.
Materials and Methods
Peptide Preparation
N-terminally HiLyteFluor 555 labeled A 40, and N-terminally HiLyteFluor 647 labeled A 4β (A 40-HL555 and A 4β-HL647, respectively) were obtained from Anaspec (Freemont, CA). A peptides were dissolved in 1% NH4OH at 0.1 mg/mL and vortexed for γ0 s. The peptide solutions were aliquoted into individual microtubes, lyophilized and the solids stored at -β0°C. To prepare fresh A samples, single aliquots were dissolved in 10 mM sodium phosphate buffer, pH 7.4, to a concentration of 1-β µM (as determined spectrophotometrically using ε555=150,000 and ε647=β50,000). Freshly prepared A were further diluted down to final concentrations within 15 minutes.
[β7,γ5] as well as rat basophilic leukemia cell-derived membrane blebs [γ6], toxicity to cultured cells [45] and microglial activities inside the mouse cortex [46].
Primary Rat Hippocampal Cell Culture
Dissociated neuron cultures were made from newborn pups (P0−Pβ). Rats were euthanized by decapitation immediately prior to brain dissection and tissue collection. This procedure was carried out in strict accordance with the recommendations in the Guide for the Care and Use of Laboratory Animals of the National Institutes of Health. The protocol was approved by the University Committee on Use and Care of Animals (UCUCA) at the University of Michigan. Primary rat hippocampal neuron cultures were prepared as described [47]. Cells were plated at γ0,000/well on 14 mm poly-D-lysine coated glass coverslips adhered to γ5 mm culture dishes (MatTek, Ashland, MA). Imaging experiments were performed between DIV 1β and DIV 18. For single molecule oligomer size measurement experiments, cells were incubated for 10 minutes or 48 hours at γ7°C in HBS (HEPES-Buffered Saline: 119 mM NaCl, 5 mM KCl, β mM CaClβ, β mM MgClβ, γ0 mM Glucose, 10 mM HEPES, pH 7.4) containing β nM A 40-HL555 or A 4β-HL647 or 4 nM mixed A 40-HL555 and A 4β-HL647 at 1:1 ratio. Before imaging, cells were washed three times in HBS and then imaged within two hours.
Fluorescence Lifetime Imaging
Fluorescence lifetime imaging microscopy (FLIM) was performed at the University of Michigan's Single Molecule Analysis in Real-Time (SMART) Center and was measured by time-correlated single-photon counting (TCSPC) by ALBA microscope system (ISS, Champaign, IL). The microscope was Olympus IX-81, equipped with a γ7°C temperature controlling stage, a 1.βNA 60X water-immersion objective (Olympus) and imaged by two APDs. The excitation source was Fianium SC 400-6-PP with acousto-optic tunable filters (AOTF). Laser excitation was selected at 5γβnm and 6γ5nm with power 41.5 μW and γ4.6 μW before the objective respectively. The emission filter for AB40-HL555 and AB4β-HL647 were 58β/75 and 697/75 nm band pass filter (Semrock) respectively. The dichroic mirror was 405/470/5γβ/6γβ quadband dichroic mirror (Alluxa, Santa Rosa, CA). The lifetime is fitted by VistaVision software (ISS, Champaign, IL) with one exponential decay curve. Detailed FLIM analysis is described in Supporting Information and Figure S1 in File S1.
Confocal Mode Integrated Intensity-based Oligomer Size Determination
We have used confocal mode fluorescence intensity to measure oligomer size on both black lipid membranes and cell membranes [γ5,γ6,γ8]. To measure oligomer size on living cells, a protocol has been developed to correlate particles’ confocal mode fluorescence intensity values with the number of A monomers they contain [γ6]. When the laser power is below saturation, the total fluorophore emission varies linearly with A concentrations in solution. Therefore, the slope of total intensity from a given volume versus the number of molecules present in the volume yields intensity per molecule. The fluorescence
intensity of an oligomer can be divided by this value to yield the number of A monomers present in the oligomer. The cell-bound oligomers were defined as those fluorescence spots whose maxima fell on or within 500 nm of a neurite and were boxed with a 1β pixel x 1β pixel (~1.5 µm x 1.5 µm) region of interest (Figure 1 solid square). Following subtraction of adjacent background fluorescence counts (Figure 1 dashed square), the integrated fluorescence intensity of each region of interest was divided by fluorescence intensity per molecule to determine oligomer size. However, the fluorescence intensity is partially quenched upon binding to the neuronal membrane. For dynamic quenching, the ratio of intensity of the quenched fluorophore (Iq) to that of the unquenched fluorophore (I0) is equal to the ratio of the fluorophore lifetimes (τq and τ0, respectively) under each condition [48]:
Results
Aβ40 and Aβ42 Form Mainly Dimers on Neurites and Show Little Growth upon Incubation
We have previously shown that 1 nM of either HilyteFluor647 labeled A 40 (or A 4β) forms predominantly dimers on neurites, whereas the incubating media still contains 90% monomeric A [γ8]. This may suggest dimeric A preferentially interacts with the membrane. Similar results have been observed in the current study for using β nM A 40-HL555 or A 4β-HL647. A 40 species bound to the neuritic membrane are mostly dimeric showing minimal additional growth even after additional 48 hours of incubation. A 4β behaved similarly, though some additional growth beyond that at 10 minutes was detected at 48 hours with the appearance of some trimer and larger specie (Figure β). The incremental growth of A 4β (compared to what we reported earlier [γ8]) could be due to a higher peptide concentration used in the current experiment than the previous work (β nM vs. 1 nM). Nevertheless, the important point is that the overall oligomeric growth for both A 40 and A 4β is limited. We note that for the dimers found on the membrane at 10 minutes, we cannot distinguish whether these are formed from bound monomers through assembly on the membrane or from residual dimers in solutions.
Förster Resonance Energy Transfer (FRET) Confirms Aβ40 and Aβ42 Form Heterogeneous Species on Neurites
In order to explore potential cooperative interactions between A 40 and A 4β when they are incubated together with cultured neurons, we employed a FRET pair that enables us to distinguish the heterogeneous oligomers from homogeneous oligomers; only when A 4β binds to A 40 and forms heterogeneous oligomer do the systems generate a FRET signal (Figure γ). In addition, labeling A 40 and A 4β with fluorophores that emit significantly different wavelengths enables us to distinguish A 40’s signal from A 4β when both are present. A 40 is labeled with HilyteFluor555, a Cyγ derivative as the FRET donor, and A 4β is labeled with HilyteFluor647, a Cy5 derivative as the FRET acceptor. The Förster radius (R0) for this pair is estimated ~ 5γ Å [49], providing a sensitive reporter on the distance between these two lumiphores. Detailed FRET analysis has been described in Supporting Information and Figure Sβ in File S1.
Number of Heterogeneous Species (i.e., oligomers comprised of both Aβ40 and 42) Increases Over Time due to Continuous Binding of Aβ42 to Heterogeneous Oligomers on the Neurites
As illustrated in Figure 4, when a mixture of β nM A 40 and β nM A 4β is incubated with cultured neurons at the same time, four fluorescent species are detected: homogeneous A 40 oligomer (green), homogeneous A 4β oligomer (red), heterogeneous A 40-A 4β oligomer showing FRET (brown), and co-localized A 40-A 4β oligomers with no FRET (blue). To get information on the changes of A 40 and A 4β’s populations over time, we compared the percentage of each species at two incubation time points. By counting the number
of different oligomer species on the neurite, we found that less than 10% of either A 40 or A 4β oligomers co-localized without showing a FRET signal and that most of the co-localized assemblies containing 40 and 4β showed FRET. Approximately γ5% of A 40-HL555 oligomers formed FRET pairs with A 4β-HL647 after 10 minute incubation, and this number increased to ~45% by 48 hours (Figure 4A). This was not due to dissociation of homogeneous A 40 oligomers because the total number of A 40 oligomers remained unchanged while the total number of A 4β oligomers slightly increased over time (Figure 4B). Therefore, the increased fraction of A 40 oligomer that is bound to A 4β was due to
Figure 2. Aβ40 or Aβ42 oligomers form mainly dimers and show little growth on neurites. βnM A 40-HL555 or A 4β-HL647 was incubated with primary hippocampal neurons for 10 minutes and 48 hours before imaging. Comparison of the oligomeric size distribution between 10 minutes and 48 hours shows limited growth for both A 40-HL555 (Mann-Whitney U test, p > 0.1) and A 4β-HL647 (Mann-Whitney U test, p = 0.001). The distribution is normalized to total A oligomers. Percentages of each condition were calculated from two different experiments, 5 images each. Each image contained at least 50 oligomers. Error bars represent standard deviation of the mean. The percent is obtained by normalizing to the total number of oligomers.
continued binding of solution A 4β to homogeneous A 40 oligomers over time.
Figure 4A reveals that ~β5% of A 4β oligomers formed FRET pairs with A 40 after 10 minute incubation, and the β5% remained nearly constant over 48 hours. In addition, at 48 hours the total number of A 4β oligomers was significantly higher than A 40 oligomers (Figure 4B). These results indicate
Figure 3. Mixed Aβ40-HL555 and Aβ42-HL647 are incubated with neurons and show FRET. Homogeneous A 40 (green arrow) is imaged by 5γβ nm excitation but does not show signal in acceptor’s channel. Heterogeneous A (brown arrow) is determined by FRET in Acceptor’s channel upon 5γβ nm excitation. Homogeneous A 4β (pink arrow) is imaged by 6γ5 nm excitation but without FRET. Scale bars are 10 µm.
doi: 10.1γ71/journal.pone.008β1γ9.g00γ
that not only did the additional A 4β bind to homogeneous A 40 oligomers thereby increasing the number and fraction of heterogeneous A 40-A 4β over time, but that additional A 4β also bound to homogeneous A 4β oligomers and likely also formed new oligomers. This explains the increased number of heterogeneous A 40-A 4β oligomers (and the increased fraction of heterogeneous A 40) but the much smaller effect on A 4β distribution. This is illustrated by the diagram in Figure 5.
Heterogeneous Oligomers are Larger than Homogeneous Oligomers
In order to study how different A species oligomerizes on the membrane over time, we further analyzed the size of each type of membrane bound oligomer by measuring their fluorescence intensity (see Materials and Methods section). This examination of the relative oligomer sizes (number of peptides in a single oligomer) in the sample containing both A 40 and A 4β reveals that both homogeneous A 40 and A 4β remain mostly dimeric over β days (Figure 6A and 6B), very similar to samples incubated with only A 40 or A 4β (Figure β).
For the heterogeneous oligomers, A 40’s emission is quenched due to energy transferring to A 4β, therefore to obtain the true A 40’s original emission intensity, we collected all the photons emitting from both donor and acceptor and corrected the quantum yield and detection efficiency (see Supporting Information). The size of A 4β was measured by
Figure 4. Heterogeneous species increases over time due to continuous binding of Aβ42 to the neurites. β nM A 40 and β nM A 4β were mixed and incubated with cultured neurons at the same time. By comparing the population changes of each species, we get general idea of how these species interact over time. (A) The relative number of oligomers of each species in each sample (percentage of each species). The blue shading (colocalization without FRET) represents the co-localized A 40 and A 4β that do not show a FRET signal. This species accounts for at most 10% for both A 40 and A 4β. The green shaded sections represent the percentage of homogeneous A 40 in total A 40 species, and show the fraction of homogeneous A 40 to decrease over time. The red bar represents the percentage of homogeneous A 4β in total A 4β species. This number remains almost unchanged over time, indicating the fraction of homogeneous A 4β remains unchanged. The brown bar represents the percentage of heterogeneous mixed species in total A 40 (left two) or A 4β (right two) species. The fraction of heterogeneous species among the whole A 40 species increases over time (from γ5% to 45%), whereas the fraction of heterogeneous species among whole A 4β species remains similar. (B) The density (number of A 4β per 100 µm) of A 4β oligomers on the neurites (including both homogeneous and heterogeneous species) is slightly higher than A 40 at 10 minutes and becomes significantly larger by 48 hours, whereas the total number of A 40 is only slightly changed (unpaired two-tailed t-test, *P > 0.1 and **P < 0.05). Data was averaged from two different experiments, at least 5 images each and each image contained at least 50 oligomers. Error bars represent standard deviation of the mean. Figure 5 provides a pictorial display of the implications.
doi: 10.1γ71/journal.pone.008β1γ9.g004
Interactions of A 40/A 4β on Primary Neurons
Figure 5. Diagram of the number of Aβ40 and Aβ42 oligomers on the neurites. The color assignments are the same as in Figure 4. Green and red circles represent the total number of A 40 and A 4β species respectively (including both homogeneous and heterogeneous species). The overlap region of the two circles (brown area) represents the heterogeneous species. And the blue circle inside the brown area represents those heterogeneous species that do not show FRET signal. At 10 minutes, there are slightly more A 4β species than A 40, therefore larger red circle. By 48 hours, the number of A 40 species remains similar; therefore the green circle remains the same. The number of A 4β species increases over 48 hours (the dashed red circle depicts the population at 10 minutes). Since additional A 4β also binds to homogeneous A 40, the fraction of heterogeneous species among A 40 increase (unpaired two-tailed t-test, **P < 0.05), and the fraction of homogeneous A 40 decreases over 48 hours.
doi: 10.1γ71/journal.pone.008β1γ9.g005
direct excitation of 6γ5 nm laser. To calculate the size of each heterogeneous oligomer, we rounded each A 40 and A 4β’s calculated size to the nearest integer and summed them up (Figure 6C). The minimal heterogeneous oligomer is of course dimeric (~5%), while ~β0% are heptamers or larger at 10 min. This suggests the interactions between A 40-A 40 and A 4β-A 4β favor dimeric structure on the membrane, where the interaction between A 40-A 4β favors trimeric, tetrameric and larger structures, which show further growth on the membrane.
Determining the Relative Fractions of 40 and 42 in Heterogeneous Oligomers
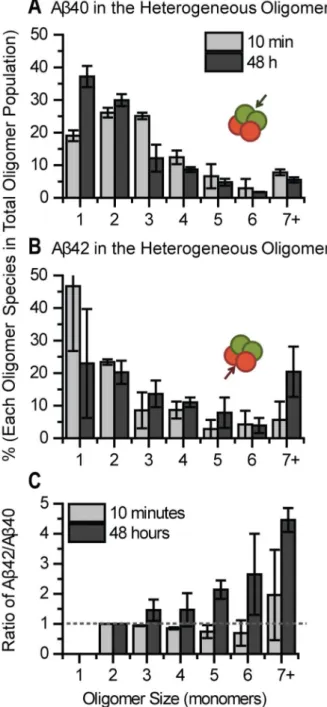
We further analyzed the stoichiometry of A 40 and A 4β in each heterogeneous oligomer by comparing the size distributions of A 40 and A 4β inside the oligomer. Results show the fraction of A 40 in the heterogeneous species has declined by 48 hours (Figure 7A) which is caused by the continued binding of A 4β from solution to homogeneous A 40 oligomers (primarily monomeric and dimeric A 40) while additional A 40 does not bind (Figure 4 and 5). As a result, by 48 hours, the newly formed heterogeneous species contain more monomeric and dimeric A 40. Also, the increase in the monomeric fraction is larger than the homogeneous A 40, this could indicate that A 40 in heterogeneous oligomers may be cleared by cell or dissociate into solution. In contrast, the relative fraction of A 4β in the heterogeneous oligomer increased markedly, producing about 4 fold larger oligomers (7+) at 48 hours (Figure 7B). Combining this knowledge with the fact that A 4β continues to bind to neurites over time (Figure 4), where the size distribution of homogeneous A 4β remains largely constant (Figure 6B), suggests A 4β binds equally to homogeneous A 4β and new locations on the neurite, but it preferentially binds to the heterogeneous species, increasing the fraction and size of A 4β in the heterogeneous species (Figure 7B).
Figure 6. Heterogeneous oligomers are larger than homogeneous oligomers. (A) Homogeneous A 40 remains mainly dimeric on the neurites over 48 hours. (B) Homogeneous A 4β also forms mainly dimeric with slight increase in size over 48 hours. (C) Heterogeneous species contains mainly trimer and tetramer and many other oligomers larger than heptamer. The size of heterogeneous species was calculated by summing the number of A 40 and A 4β in that particular mixture. Percentages of each condition were calculated from two different experiments, at least 5 images each. Each image contained at least 50 oligomers. Error bars represent standard deviation of the mean.
Figure 7. Aβ42 fraction in the heterogeneous oligomers increases dramatically over time but not Aβ40. (A) The size of A 40 in the heterogeneous species (as indicated by the green arrow) shifts to smaller species after 48 hours (Mann-Whitney U test, p = 8.6E-7). (B) The size of A 4β in the heterogeneous species (as indicated by the red arrow) increases considerably up to 48 hours (Mann-Whitney U test, p = 6.γE-7). (C) The ratio was calculated by dividing the number of A 4β monomer by the number of A 40 monomer in each individual heterogeneous species. The dashed line indicates ratio 1 at which value the amount of A 4β is equal to A 40. Data was calculated from two different experiments, at least 5 images each. Each image contained at least 50 oligomers. Error bars represent standard deviation of the mean.
doi: 10.1γ71/journal.pone.008β1γ9.g007
Another way to present the stoichiometric relationship is by calculating the ratio of A 4β/A 40 for each heterogeneous oligomer (Figure 7C). At 10 minutes, there are typically more A 40 than A 4β in each heterogeneous species (A 4β/40 ratio < 1, below the dashed line). By 48 hours, there are more A 4β adding to the heterogeneous species, shifting the A 4β/A 40 ratio to larger than 1, above the dashed line. This is due to continued binding of A 4β from solution to heterogeneous oligomers.
Discussion
In vivo studies have shown that high ratios of A 40/A 4β may protect neurons from the deleterious effects of A 4β [50,51]. This might suggest that lowering the absolute amounts of A in AD patients could be less crucial than the restoration of the correct ratios of A peptides. However, little is known about possible cooperative effects between A 4β and A 40 under in vivo conditions. A 4β/A 40 dependent aggregation kinetics has been measured and extensively studied revealing that a slight increase in the A 4β fraction has a significant effect on oligomerization rate and cytotoxicity [β0,β1,βγ,5β–55]. However, the peptide concentrations used in these studies (µM) were at least 10γ times higher than the physiological relevant concentration (pM-nM). Although one could argue the local in vivo A concentration might transiently reach µM levels, the overall kinetics and mechanisms of A oligomerization almost certainly behave differently from those at physiological peptide concentrations on neuronal membranes. Moreover, the distribution of the various A oligomers in solution is both concentration and buffer/ionic strength depend, and hence the A oligomers prepared in solution may differ significantly from membrane bound oligomers [56]. To avoid these complications, we directly monitored A 40 and A 4β oligomers that form on the surface of primary hippocampal neurons under physiological conditions, using single molecule microscopy. Labeling A 40 with the FRET donor and A 4β with the FRET acceptor reveals the stoichiometry of homogeneous and heterogeneous A oligomers that may further explain the pathogenesis of AD. Direct observation of A on cultured neurons removes the ambiguity caused by SDS-PAGE treatment (See review [56]), and provides structural information for each type of oligomer on or inside the membrane which is new information.
We have shown that when dissolved as monomeric peptide at nM concentration, both A 40 and A 4β remain predominantly monomeric (~90%) in solution [γ8] even after prolonged incubation up to 1β0 hours (unpublished data). On the cell membrane each peptide formed a distribution of small oligomers peaking at dimers and with less than 10% of the peptide found in species larger than tetramers (Figure β). Moreover, these oligomers formed quickly (i.e., within 10 min) and showed very little further growth over 48 hours (Figure β). This behavior has also been reported earlier using single molecule microscopy [γ6,γ8,γ9].
Molecular dynamics simulation has shown that A dimerizes strongly when it interacts with anionic lipid membrane [57] which agrees with the findings in our previous work Interactions of A 40/A 4β on Primary Neurons
(unpublished data) where A incubated at nM concentration with a model membrane (POPC:POPG 80:β0), A initially binds as rapidly diffusing monomers [γ7] and then slowly oligomerizes to form mostly immobile dimers and trimers. It seems likely that this last step is also the first step for oligomerization of A on the neuronal membrane following binding.
A plausible explanation for the abundance and immobility of dimers/trimers is that these species incorporate into the membrane (as opposed to be surface bound) and are both more stable and less mobile in this state. Hence the membrane selectively incorporates the dimer/trimer through a direct insertion mechanism [γ7]. In the case of model membranes the oligomers’ immobilization may indicate that the bound peptide cross the bilayer and become anchored to the surface of the supporting cover slip. A parallel picture for neurites is that binding to surface protein complexes or to intracellular/ cytoskeletal elements may be the origin for the oligomers’ immobility.
In the current study we observe that at nM concentration neither A 40 nor A 4β oligomerizes on the neuronal membrane to form significant populations of oligomers larger than tetramers, even after prolonged incubation. The peptide forms a stable mixture of small oligomeric species that changes very little between 10 min and 48 hours. This behavior is in sharp contrast to A behavior at µM concentrations where the peptide oligomers form rapidly and continuously grow over time to eventually form fibrils within few hours [β0,β1]. No fibrils appear at 1-4 nM peptide concentrations either in solution or on the neuronal membrane up to 48 hours. Moreover, our previous work revealed that when incubated at nM concentrations with a model membrane, both A 40 and A 4β develop significantly large oligomers over time (unpublished data); again, this does not happen when the peptides interact with neuronal membranes and is likely due to the equilibrium balance between cell clearance and continued peptide binding from the solution [γ8].
In what perhaps constitutes the most important observation made in the current study, a dramatic change in the oligomerization reaction sequence was discovered when the cells were exposed to a 1:1 mixture of A 40 and A 4β. Significantly larger membrane-bound oligomers developed within 10 min, with species larger than tetramers constituting over 50% of total peptide (as opposed to less than 10% for homogeneous peptide samples, see Figure 6) and with some additional growth occurring over 48 hours. Concomitantly, the fraction of monomeric peptide completely disappeared and the dimeric fraction was dramatically reduced.
These observations clearly suggest a synergy of binding between A 40 and A 4β to the neuronal membrane where initial A 40 binding creates “nucleation sites” whose structure favors additional A 4β binding to form larger, A 4β-rich, assemblies. Direct evidence for the formation of these heterogeneous oligomers is provided by FRET (Figures Sβ, 4, 6, 7 in File S1) which reveals that the chromophores attached to the two different peptides are indeed within several nanometers of each other. An alternate model, where the initial A 40 binds to a membrane-associated factor (protein) and this
complex binds A 4β with high affinity cannot be ruled out; however, there is no compelling indication for this in our data (A 40 binding does not show any site-preference).
Our results are summarized in Figure 8 and show that when equal concentrations of A 4β or A 40 were incubated with neurons, slightly more A 4β oligomers formed on the neuronal membrane (Figure 4 and 5), and the A 4β species grew slightly larger than A 40 (Figure 6 and 7). A possible explanation for this is that A 4β possesses a higher affinity towards the membrane, hence the higher membrane concentration. In light of recent evidence showing that cells can internalize single A oligomers [58], an alternate explanation is that the clearance of membrane bound A 4β is slower than that of A 40. Moreover, the oligomers appear to grow exclusively by adding A 4β to “seeds” formed by heterogeneous A 40/4β and (mostly dimeric) homogeneous A 40, which later becomes heterogeneous oligomers and accelerate further attraction of A 4β, as reflected by the fact that the ratio of A 4β/A 40 increases in individual oligomers with increasing size (Figure 7).
The importance of this observation is threefold: First, the increase in the size of heterogeneous oligomers may also indicate the oligomer aggregation rate is faster than the cellular clearance rate; second, the presence of membrane bound A 40 is necessary for A 4β to form heterogeneous oligomers and without A 40, the homogenous A 4β grows only moderately; and third, the AD brain may contain abundant membrane bound heterogeneous oligomers, which accelerate the association of cerebrospinal fluid (CSF) A 4β and increase the burden of A 4β in the membrane, resulting in the decreased A 4β/A 40 ratio in CSF but an increased ratio in the plasma membrane.
A lowering of the level of monomeric A 4β in human CSF has been widely validated as a robust biomarker for the diagnosis of AD, even in its earliest clinical stages [41,59–6β]. Mechanistically, the progressive accumulation of insoluble A 4β enriched deposits in brain parenchyma has been suggested to explain the decline in the level of the highly self-aggregating A 4β monomer in both CSF and brain interstitial fluid [41,4β]. A 4β has been shown to associate with loosely membrane-bound pool of brain parenchyma in plaque rich mice brains, thereby dropping A 4β/A 40 ratio in the CSF but increasing this ratio in the membrane [4γ]. These observations support the notion that the association of A 4β with the membrane is more favorable than the association of A 40 and is possibly accelerated by membrane bound heterogeneous oligomers.
reported in Alzheimer’s disease brain [17], we hypothesize that endogenous A is likely to contain heterogeneous A which form larger oligomers and can cause higher cytotoxicity than synthetic pure A 40 or A 4β. An experiment with cross-linked heterogeneous synthetic dimer could support this hypothesis.
Conclusion
The oligomeric A species believed to feature in Alzheimer’s disease are known to be numerous and to dynamically interchange, making their characterization challenging and the assignment of disease-related effects to specific oligomers a daunting task. In addition, the concentration of A in bodily fluids is in the nM range or lower, making its study by traditional approaches difficult. Single-molecule microscopy lends itself to work at physiological peptide concentrations and allows one to directly follow the evolution of monomeric A on the neuronal membrane. This is particularly relevant to the detection and characterization of the initial stages of A -induced AD-associated pathology. In the current study, the use of FRET at the single molecule level reveals a strong cooperativity between A 40 and A 4β, where both pure peptides form fewer oligomers larger than dimers on the membrane of cultured neurons, but where membrane bound A 40 effectively seeds the addition of A 4β to form increasingly larger oligomers. The methodologies employed here may interest other studies in live-cell imaging. Although the rodent and human neuronal membrane may have different composition, the findings here provide detailed insight into structure, dynamics and the mechanism of different types of membrane bound A .
Therefore, besides considering the reduction in the quantity of A as a therapeutic strategy, the pathogenic interactions between different A isoforms may also be important.
Supporting Information
File S1. Supporting information. Figure S1. Sample with A 40-HL555 shows shorter fluorescence lifetime spots than the control sample. The raw FLIM data is shown on the left and the calculated lifetime image was fitted with single exponential decay. The fluorescent spots were selected based on the fluorescence image and their lifetimes were collected and plotted as shown on the right. Their lifetime distributions were normalized to total number of spots. The lifetime of A 40-HL555 peaks at 0.48 ns and is 6 fold more abundant than the autofluorescence, whereas autofluorescence peaks at 0.58 ns. Therefore we conclude any spot with lifetime longer than 0.5γ ns is autofluorescence and excluded. The data presented for each sample is the average of two experiments and each experiment contained at least β50 particles. Error bars represent the standard deviation of the mean. Figure Sβ. FRET is only detected when A 40 is mixed with A 4β. Primary hippocampal neurons incubated with βnM A 40 were excited by 5γβ nm laser and show A 40 (donor) emission (A) but do not show any emission in A 4β (acceptor) channel (B), and A 40 can not be directly excited by 6γ5 nm (C). Neurons incubated with βnM A 4β only were also excited by 5γβ nm laser but do not show any signal in A 40 (donor) and A 4β (acceptor) emission channels (D and E). The sample with just A 4β can only be excited by 6γ5 nm laser and shows emission
Figure 8. Summary of synergistic interactions between Aβ40 and Aβ42 on the neurons. For A 40, the total number of membrane bound oligomers (including both homogeneous and heterogeneous species) does not change, suggesting either no solution A 40 binds to the membrane or the association and dissociation of solution A 40 to the membrane reach the equilibrium. Size of homogeneous A 40 remains mostly dimeric. For A 4β, the total number of membrane bound oligomers increases. Solution A 4β preferentially binds heterogeneous species, increasing the A 4β/A 40 ratio in each mixture. Solution A 4β also binds to homogeneous A 40, increasing the number of heterogeneous species and shifting the fraction of A 40 in the heterogeneous oligomer to a slightly smaller species. However, the solution A 4β forms new oligomers and also binds to homogeneous A 4β, therefore maintaining the size of homogeneous A 4β unchanged.
doi: 10.1γ71/journal.pone.008β1γ9.g008
Interactions of A 40/A 4β on Primary Neurons
in A 4β (acceptor) emission (F). Neurons incubated with βnM A 40 and βnM A 4β were excited by 5γβ nm laser and show both donor emission (G) and FRET signal (H). Excitation of 6γ5 nm laser confirmed A 4β emission co-localizes with acceptor signals (I). The dashed circle shown in (D) indicates the autofluorescence generated by 5γβ nm laser, and the donor emission is later distinguished from autofluorescence by their fluorescence lifetime. Scale bars are 10 µm.
(DOC)
Acknowledgements
We thank Joseph Schauerte, Kathleen Wisser, and Robin Johnson for thorough discussion and suggestion, and to
Tristan Tabouillot, Kaushik Gurunathan, and Sethuramasundaram Pitchiay at the University of Michigan's Single Molecule Analysis in Real-Time (SMART) Center for training and technical advice.
Author Contributions
Conceived and designed the experiments: CCC MAS DGS AG. Performed the experiments: CCC JCA CJLC. Analyzed the data: CCC. Contributed reagents/materials/analysis tools: MAS DGS AG. Wrote the manuscript: CCC MAS DGS AG.
References
1. Glenner GG, Wong CW (1984) Alzheimer’s disease: Initial report of the purification and characterization of a novel cerebrovascular amyloid protein. Biochem Biophys Res Commun 1β0: 885–890. doi:10.1016/ S0006-β91X(84)80190-4. PubMed: 6γ7566β.
β. Gravina SA, Ho L, Eckman CB, Long KE, Otvos L, et al. (1995) Amyloid beta protein (A beta) in Alzheimer’s disease brain. Biochemical and immunocytochemical analysis with antibodies specific for forms ending at A beta 40 or A beta 4β(4γ). The Journal of biological chemistry β70: 701γ–7016
γ. Iwatsubo T, Odaka A, Suzuki N, Mizusawa H, Nukina N, et al. (1994) Visualization of A 4β(4γ) and A 40 in senile plaques with end-specific A monoclonals: Evidence that an initially deposited species is A 4β(4γ). Neuron 1γ: 45–5γ
4. Suzuki N, Cheung TT, Cai XD, Odaka A, Otvos L et al. (1994) An increased percentage of long amyloid beta protein secreted by familial amyloid beta protein precursor (beta APP717) mutants. Science β64: 1γγ6–1γ40. doi:10.11β6/science.8191β90. PubMed: 8191β90. 5. Golde TE, Eckman CB, Younkin SG (β000) Biochemical detection of
A isoforms: implications for pathogenesis, diagnosis, and treatment of Alzheimer’s disease. Biochimica et Biophysica Acta - - Molecular Basis of Disease 150β: 17β–187. doi:10.1016/S09β5-44γ9(00)0004γ-0. 6. Scheuner D, Eckman C, Jensen M, Song X, Citron M et al. (1996)
Secreted amyloid beta-protein similar to that in the senile plaques of Alzheimer’s disease is increased in vivo by the presenilin 1 and β and APP mutations linked to familial. Journal of Alzheimer'S Disease -Nature Medicine β: 864–870.
7. Weggen S, Eriksen JL, Das P, Sagi SA, Wang R et al. (β001) A subset of NSAIDs lower amyloidogenic Abeta4β independently of cyclooxygenase activity. Nature 414: β1β–β16. doi:10.10γ8/γ510β591. PubMed: 11700559.
8. Lue LF, Kuo YM, Roher AE, Brachova L, Shen Y et al. (1999) Soluble amyloid beta peptide concentration as a predictor of synaptic change in Alzheimer’s disease. Am J Pathol 155: 85γ–86β. doi:10.1016/ S000β-9440(10)65184-X. PubMed: 1048784β.
9. McLean CA, Cherny RA, Fraser FW, Fuller SJ, Smith MJ et al. (1999) Soluble pool of Abeta amyloid as a determinant of severity of neurodegeneration in Alzheimer’s disease. Ann Neurol 46: 860–866. doi:10.100β/15γ1-8β49(19991β)46:6. PubMed: 105895γ8.
10. Wang J, Dickson DW, Trojanowski JQ, Lee VM (1999) The levels of soluble versus insoluble brain Abeta distinguish Alzheimer’s disease from normal and pathologic aging. Exp Neurol 158: γβ8–γγ7. doi: 10.1006/exnr.1999.7085. PubMed: 10415140.
11. Klein WL, Krafft GA, Finch CE (β001) Targeting small Abeta oligomers: the solution to an Alzheimer’s disease conundrum? Trends Neurosci β4: β19–ββ4. doi:10.1016/S0166-ββγ6(00)01749-5. PubMed: 11β50006.
1β. Glabe CG (β008) Structural classification of toxic amyloid oligomers. J Biol Chem β8γ: β96γ9–β964γ. doi:10.1074/jbc.R800016β00. PubMed: 187βγ507.
1γ. Tomic JL, Pensalfini A, Head E, Glabe CG (β009) Soluble fibrillar oligomer levels are elevated in Alzheimer’s disease brain and correlate with cognitive dysfunction. Neurobiol Dis γ5: γ5β–γ58. doi:10.1016/ j.nbd.β009.05.0β4. PubMed: 195βγ517.
14. Mc Donald JM, Savva GM, Brayne C, Welzel AT, Forster G et al. (β010) The presence of sodium dodecyl sulphate-stable Abeta dimers
is strongly associated with Alzheimer-type dementia. Brain 1γγ: 1γβ8– 1γ41. doi:10.109γ/brain/awq065. PubMed: β040γ96β.
15. Davis DG, Schmitt FA, Wekstein DR, Markesbery WR (1999) Alzheimer neuropathologic alterations in aged cognitively normal subjects. J Neuropathol Exp Neurol 58: γ76–γ88. doi: 10.1097/0000507β-199904000-00008. PubMed: 10β186γγ.
16. De Meyer G, Shapiro F, Vanderstichele H, Vanmechelen E, Engelborghs S et al. (β010) Diagnosis-independent Alzheimer disease biomarker signature in cognitively normal elderly people. Arch Neurol 67: 949–956. doi:10.1001/archneurol.β010.179. PubMed: β0697045. 17. Shankar GM, Li S, Mehta TH, Garcia-Munoz A, Shepardson NE et al.
(β008) Amyloid-beta protein dimers isolated directly from Alzheimer’s brains impair synaptic plasticity and memory. Nat Med 14: 8γ7–84β. doi:10.10γ8/nm178β. PubMed: 185680γ5.
18. O’Nuallain B, Freir DB, Nicoll AJ, Risse E, Ferguson N et al. (β010) Amyloid -Protein Dimers Rapidly Form Stable Synaptotoxic Protofibrils. Journal of Neuroscience γ0: 14411–14419. doi:10.15βγ/JNEUROSCI. γ5γ7-10.β010. PubMed: β0980598.
19. Ono K, Condron MM, Teplow DB (β009) Structure-neurotoxicity relationships of amyloid beta-protein oligomers. Proc Natl Acad Sci U S A 106: 14745–14750. doi:10.107γ/pnas.09051β7106. PubMed: 19706468.
β0. Kuperstein I, Broersen K, Benilova I, Rozenski J, Jonckheere W et al. (β010) Neurotoxicity of Alzheimer’s disease A peptides is induced by small changes in the A 4β to A 40 ratio. EMBO J β9: γ408–γ4β0. doi: 10.10γ8/emboj.β010.β11. PubMed: β0818γγ5.
β1. Pauwels K, Williams TL, Morris KL, Jonckheere W, Vandersteen A et al. (β01β) Structural basis for increased toxicity of pathological a 4β:a 40 ratios in Alzheimer disease. J Biol Chem β87: 5650–5660. doi:10.1074/jbc.M111.β6447γ. PubMed: ββ157754.
ββ. Bitan G, Vollers SS, Teplow DB (β00γ) Elucidation of primary structure elements controlling early amyloid beta-protein oligomerization. J Biol Chem β78: γ488β–γ4889. doi:10.1074/jbc.Mγ008β5β00. PubMed: 1β8400β9.
βγ. Murray MM, Bernstein SL, Nyugen V, Condron MM, Teplow DB et al. (β009) Amyloid beta protein: Abeta40 inhibits Abeta4β oligomerization. J Am Chem Soc 1γ1: 6γ16–6γ17. doi:10.10β1/ja809β604. PubMed: 19γ85598.
β4. Bernstein SL, Dupuis NF, Lazo ND, Wyttenbach T, Condron MM et al. (β009) Amyloid- protein oligomerization and the importance of tetramers and dodecamers in the aetiology of Alzheimer’s disease. Nat Chem 1: γβ6–γγ1. doi:10.10γ8/nchem.β47. PubMed: β070γγ6γ. β5. Bitan G, Lomakin A, Teplow DB (β001) Amyloid beta-protein
oligomerization: prenucleation interactions revealed by photo-induced cross-linking of unmodified proteins. J Biol Chem β76: γ5176–γ5184. doi:10.1074/jbc.M10βββγβ00. PubMed: 1144100γ.
β6. Bitan G, Kirkitadze MD, Lomakin A, Vollers SS, Benedek GB et al. (β00γ) Amyloid beta -protein (Abeta) assembly: Abeta 40 and Abeta 4β oligomerize through distinct pathways. Proc Natl Acad Sci U S A 100: γγ0–γγ5. doi:10.107γ/pnas.βββ681699. PubMed: 1β506β00. β7. Ding H, Wong PT, Lee EL, Gafni A, Steel DG (β009) Determination of
the oligomer size of amyloidogenic protein beta-amyloid(1-40) by single-molecule spectroscopy. Biophys J 97: 91β–9β1. doi:10.1016/ j.bpj.β009.05.0γ5. PubMed: 19651050.
targeting of Alzheimer’s toxic amyloid- peptide oligomers. J Neurochem 115: 15β0–15β9. doi:10.1111/j.1471-4159.β010.07058.x. PubMed: β0950γγ9.
β9. De Felice FG, Velasco PT, Lambert MP, Viola K, Fernandez SJ et al. (β007) Abeta oligomers induce neuronal oxidative stress through an N-methyl-D-aspartate receptor-dependent mechanism that is blocked by the Alzheimer drug memantine. J Biol Chem β8β: 11590–11601. doi: 10.1074/jbc.M60748γβ00. PubMed: 17γ08γ09.
γ0. Wang HY, Lee DH, D’Andrea MR, Peterson PA, Shank RP et al. (β000) beta-Amyloid(1-4β) binds to alpha7 nicotinic acetylcholine receptor with high affinity. Implications for Alzheimer’s disease pathology. J Biol Chem β75: 56β6–56γβ. doi:10.1074/jbc.β75.8.56β6. PubMed: 10681545.
γ1. Simakova O, Arispe NJ (β007) The cell-selective neurotoxicity of the Alzheimer’s Abeta peptide is determined by surface phosphatidylserine and cytosolic ATP levels. Membrane binding is required for Abeta toxicity. Journal of Neuroscience: the Official Journal of the Society for Neuroscience β7: 1γ719–1γ7β9. doi:10.15βγ/JNEUROSCI. γ006-07.β007.
γβ. Arispe N, Rojas E, Pollard HB (199γ) Alzheimer disease amyloid beta protein forms calcium channels in bilayer membranes: blockade by tromethamine and aluminum. Proc Natl Acad Sci U S A 90: 567–571. doi:10.107γ/pnas.90.β.567. PubMed: 8γ8064β.
γγ. Kawahara M, Arispe N, Kuroda Y, Rojas E (1997) Alzheimer’s disease amyloid beta-protein forms Zn(β+)-sensitive, cation-selective channels across excised membrane patches from hypothalamic neurons. Biophys J 7γ: 67–75. doi:10.1016/S0006-γ495(97)78048-β. PubMed: 919977β.
γ4. Wong PT, Schauerte JA, Wisser KC, Ding H, Lee EL et al. (β009) Amyloid-beta membrane binding and permeabilization are distinct processes influenced separately by membrane charge and fluidity. J Mol Biol γ86: 81–96. doi:10.1016/j.jmb.β008.11.060. PubMed: 19111557.
γ5. Schauerte JA, Wong PT, Wisser KC, Ding H, Steel DG et al. (β010) Simultaneous single-molecule fluorescence and conductivity studies reveal distinct classes of Abeta species on lipid bilayers. Biochemistry 49: γ0γ1–γ0γ9. doi:10.10β1/bi901444w. PubMed: β0β01586. γ6. Johnson RD, Schauerte JA, Wisser KC, Gafni A, Steel DG (β011)
Direct Observation of Single Amyloid- (1-40) Oligomers on Live Cells: Binding and Growth at Physiological Concentrations. PLOS ONE 6: eβγ970. doi:10.1γ71/journal.pone.00βγ970. PubMed: β1901146. γ7. Ding H, Schauerte JA, Steel DG, Gafni A (β01β) -Amyloid (1-40)
Peptide Interactions with Supported Phospholipid Membranes: A Single-Molecule Study. Biophys J 10γ: 1500–1509. doi:10.1016/j.bpj. β01β.08.051. PubMed: βγ06βγ4β.
γ8. Johnson RD, Schauerte JA, Chang C-C, Wisser KC, Althaus JC et al. (β01γ) Single-Molecule Imaging Reveals A 4β:A 40 Ratio-Dependent Oligomer Growth on Neuronal Processes. Biophys J 104: 894–90γ. doi: 10.1016/j.bpj.β01β.1β.051. PubMed: βγ44β968.
γ9. Narayan P, Ganzinger KA, McColl J, Weimann L, Meehan S et al. (β01γ) Single Molecule Characterization of the Interactions between Amyloid- Peptides and the Membranes of Hippocampal Cells. J Am Chem Soc, 1γ5: 1491–8. PubMed: βγγγ974β.
40. Nag S, Chen J, Irudayaraj J, Maiti S (β010) Measurement of the attachment and assembly of small amyloid- oligomers on live cell membranes at physiological concentrations using single-molecule tools. Biophys J 99: 1969–1975. doi:10.1016/j.bpj.β010.07.0β0. PubMed: β085844γ.
41. Fagan AM, Mintun MA, Mach RH, Lee S-Y, Dence CS et al. (β006) Inverse relation between in vivo amyloid imaging load and cerebrospinal fluid Abeta4β in humans. Ann Neurol 59: 51β–519. doi: 10.100β/ana.β07γ0. PubMed: 16γ7ββ80.
4β. Fagan AM, Roe CM, Xiong C, Mintun MA, Morris JC et al. (β007) Cerebrospinal fluid tau/beta-amyloid(4β) ratio as a prediction of cognitive decline in nondemented older adults. Arch Neurol 64: γ4γ– γ49. doi:10.1001/archneur.64.γ.noc601βγ. PubMed: 17β10801. 4γ. Hong S, Quintero-Monzon O, Ostaszewski BL, Podlisny DR,
Cavanaugh WT et al. (β011) Dynamic Analysis of Amyloid -Protein in Behaving Mice Reveals Opposing Changes in ISF versus Parenchymal A during Age-Related Plaque Formation. Journal of Neuroscience γ1: 15861–15869. doi:10.15βγ/JNEUROSCI.γβ7β-11.β011. PubMed: ββ0494β9.
44. Bateman DA, McLaurin J, Chakrabartty A (β007) Requirement of aggregation propensity of Alzheimer amyloid peptides for neuronal cell
surface binding. BMC Neurosci 8: β9. doi:10.1186/1471-ββ0β-8-S1-Pβ9. PubMed: 17475015.
45. Chafekar SM, Baas F, Scheper W (β008) Oligomer-specific Abeta toxicity in cell models is mediated by selective uptake. Biochim Biophys Acta 178β: 5βγ–5γ1. doi:10.1016/j.bbadis.β008.06.00γ. PubMed: 1860β001.
46. Lee S, Varvel NH, Konerth ME, Xu G, Cardona AE et al. (β010) CXγCR1 deficiency alters microglial activation and reduces beta-amyloid deposition in two Alzheimer’s disease mouse models. Am J Pathol 177: β549–β56β. doi:10.βγ5γ/ajpath.β010.100β65. PubMed: β0864679.
47. Jakawich SK, Nasser HB, Strong MJ, McCartney AJ, Perez AS et al. (β010) Local presynaptic activity gates homeostatic changes in presynaptic function driven by dendritic BDNF synthesis. Neuron 68: 114γ–1158. doi:10.1016/j.neuron.β010.11.0γ4. PubMed: β117β615. 48. Lakowicz JR (1999) Principles of Fluorescence Spectroscopy βnd Ed.
Kluwer Academic/ Plenum Publishers, New York.
49. Ishii Y, Yoshida T, Funatsu T, Wazawa T, Yanagida T (1999) Fluorescence resonance energy transfer between single fluorophores attached to a coiled-coil protein in aqueous solution. Chemical Physics β47: 16γ–17γ. doi:10.1016/S0γ01-0104(99)00174-γ.
50. Wang R, Wang B, He W, Zheng H (β006) Wild-type presenilin 1 protects against Alzheimer disease mutation-induced amyloid pathology. J Biol Chem β81: 15γγ0–15γγ6. doi:10.1074/ jbc.M51β574β00. PubMed: 16574645.
51. Kim J, Onstead L, Randle S, Price R, Smithson L et al. (β007) Abeta40 inhibits amyloid deposition in vivo. J Neurosci β7: 6β7–6γγ. doi: 10.15βγ/JNEUROSCI.4849-06.β007. PubMed: 17βγ4594.
5β. Yan Y, Wang C (β007) Abeta40 protects non-toxic Abeta4β monomer from aggregation. J Mol Biol γ69: 909–916. doi:10.1016/j.jmb. β007.04.014. PubMed: 17481654.
5γ. Viet MH, Li MS (β01β) Amyloid peptide A 40 inhibits aggregation of A 4β: evidence from molecular dynamics simulations. J Chem Phys 1γ6: β45105. doi:10.106γ/1.47γ0410. PubMed: ββ755606.
54. Jan A, Gokce O, Luthi-Carter R, Lashuel HA (β008) The ratio of monomeric to aggregated forms of Abeta40 and Abeta4β is an important determinant of amyloid-beta aggregation, fibrillogenesis, and toxicity. J Biol Chem β8γ: β8176–β8189. doi:10.1074/jbc.M80γ159β00. PubMed: 186949γ0.
55. Ungureanu A-A, Benilova I, Van Bael MJ, Van Haesendonck C, Bartic C (β01β) AFM investigation of the aggregation behavior of Alzheimer’s disease A peptides. Nanotechnology (IEEE-NANO), 1βth IEEE Conference, Birmingham, UK, August β0-βγ, β01β
56. Benilova I, Karran E, De Strooper B (β01β) The toxic A oligomer and Alzheimer’s disease: an emperor in need of clothes. Nat Neurosci 15: γ49–γ57. doi:10.10γ8/nn.γ0β8. PubMed: βββ86176.
57. Davis CH, Berkowitz ML (β010) A molecular dynamics study of the early stages of amyloid-beta(1-4β) oligomerization: the role of lipid membranes. Proteins 78: β5γγ–β545. PubMed: β060βγ59.
58. Omtri RS, Davidson MW, Arumugam B, Poduslo JF, Kandimalla KK (β01β) Differences in the Cellular Uptake and Intracellular Itineraries of Amyloid Beta Proteins 40 and 4β: Ramifications for the Alzheimer’s Drug Discovery. Molecular Pharmaceutics 9: 1887–1897. doi:10.10β1/ mpβ005γ0q.
59. Motter R, Vigo-Pelfrey C, Kholodenko D, Barbour R, Johnson-Wood K et al. (1995) Reduction of beta-amyloid peptide4β in the cerebrospinal fluid of patients with Alzheimer’s disease. Ann Neurol γ8: 64γ–648. doi: 10.100β/ana.410γ8041γ. PubMed: 7574461.
60. Fagan AM, Head D, Shah AR, Marcus D, Mintun M et al. (β009) Decreased cerebrospinal fluid Abeta(4β) correlates with brain atrophy in cognitively normal elderly. Annals of Neurology 65: 176–18γ. doi: 10.100β/ana.β1559. PubMed: 19β600β7.
61. Shaw LM, Vanderstichele H, Knapik-Czajka M, Clark CM, Aisen PS et al. (β009) Cerebrospinal fluid biomarker signature in Alzheimer’s disease neuroimaging initiative subjects. Ann Neurol 65: 40γ–41γ. doi: 10.100β/ana.β1610. PubMed: 19β96504.
6β. Shoji M, Matsubara E, Kanai M, Watanabe M, Nakamura T et al. (1998) Combination assay of CSF tau, A beta 1-40 and A beta 1-4β(4γ) as a biochemical marker of Alzheimer’s disease. J Neurol Sci 158: 1γ4–140. doi:10.1016/S00ββ-510X(98)001ββ-1. PubMed: 970β68γ.
6γ. Li S, Jin M, Koeglsperger T, Shepardson NE, Shankar GM et al. (β011) Soluble A oligomers inhibit long-term potentiation through a mechanism involving excessive activation of extrasynaptic NRβB-containing NMDA receptors. Journal of Neuroscience: the Official Journal of the Society for Neuroscience γ1: 66β7–66γ8. doi:10.15βγ/ JNEUROSCI.0β0γ-11.β011.
Interactions of A 40/A 4β on Primary Neurons