Culture Substrates on the Extent of Artifacts in
Single-Molecule Tracking
Laura C. Zanetti-Domingues, Marisa L. Martin-Fernandez, Sarah R. Needham, Daniel J. Rolfe, David T. Clarke*
Central Laser Facility, Science and Technology Facilities Council, Research Complex at Harwell, Rutherford Appleton Laboratory, Harwell Oxford, Didcot, United Kingdom
Abstract
Single-molecule techniques are being increasingly applied to biomedical investigation, notwithstanding the numerous challenges they pose in terms of signal-to-noise ratio issues. Non-specific binding of probes to glass substrates, in particular, can produce experimental artifacts due to spurious molecules on glass, which can be particularly deleterious in live-cell tracking experiments. In order to resolve the issue of non-specific probe binding to substrates, we performed systematic testing of a range of available surface coatings, using three different proteins, and then extended our assessment to the ability of these coatings to foster cell growth and retain non-adhesive properties. Linear PEG, a passivating agent commonly used both in immobilized-molecule single-molecule techniques and in tissue engineering, is able to both successfully repel non-specific adhesion of fluorescent probes and to foster cell growth when functionalized with appropriate adhesive peptides. Linear PEG treatment results in a significant reduction of tracking artifacts in EGFR tracking with Affibody ligands on a cell line expressing EGFR-eGFP. The findings reported herein could be beneficial to a large number of experimental situations where single-molecule or single-particle precision is required.
Citation:Zanetti-Domingues LC, Martin-Fernandez ML, Needham SR, Rolfe DJ, Clarke DT (2012) A Systematic Investigation of Differential Effects of Cell Culture Substrates on the Extent of Artifacts in Single-Molecule Tracking. PLoS ONE 7(9): e45655. doi:10.1371/journal.pone.0045655
Editor:Vladimir N. Uversky, University of South Florida College of Medicine, United States of America ReceivedJune 8, 2012;AcceptedAugust 20, 2012;PublishedSeptember 25, 2012
Copyright:ß2012 Zanetti-Domingues et al. This is an open-access article distributed under the terms of the Creative Commons Attribution License, which permits unrestricted use, distribution, and reproduction in any medium, provided the original author and source are credited.
Funding:This work was supported by Biotechnology and Biological Sciences Research Council (http://www.bbsrc.ac.uk/), Grant number BB/G006911/1. The funders had no role in study design, data collection and analysis, decision to publish, or preparation of the manuscript.
Competing Interests:The authors have declared that no competing interests exist. * E-mail: [email protected]
Introduction
Since they were first described around 20 years ago, there has been a near-exponential growth in the use of single-molecule techniques for the investigation of biological systems and processes [1]. This is expected to continue as single-molecule methods move out of specialist physics laboratories and find more applications in the biomedical sciences. Single-molecule techniques can essentially be divided into two areas: detection, manipulation, and force measurement using probe microscopy and optical tweezers [2], and techniques that use fluorescence imaging and spectroscopy [3]. Broadly speaking, fluorescence-based methods can be divided into measurements on fluorescent molecules in solution, those on immobilized fluorescent molecules, and measurements on fluorescent mole-cules in cultured cells. These measurements can be used to investigate stoichiometry, inter- and intramolecular interactions, and molecular conformation. For example, single-molecule fluorescence methods such as nanometer-localized multiple single-molecule fluorescence (NALMS) [4] and fluorescence imaging with one nanometer accuracy (FIONA) [5], are able to provide information on molecular localization and separation, whilst Fo¨rster resonance energy transfer (FRET) can be employed to determine the distance between single molecules in the 1–8 nm range [6]. The principle of single-molecule localization also lies behind sub-diffraction limit imaging
techniques such as stochastic optical reconstruction microscopy (STORM) [7] and photoactivation localization microscopy (PALM) [8].
A number of approaches have been taken to passivate the surfaces of glass coverslips for the prevention of non-specific binding. Most simply, proteins or protein-like molecules are added to the surface, so that they might bind non-specifically and block sites that might otherwise be available for non-specific binding of fluorescent protein molecules. Proteins used for this purpose include bovine serum albumin (BSA), fibronectin, laminin, collagen, Poly-L-Lysine, and fetal calf serum (FCS), which contains a mixture of proteins. An alternative approach has been to covalently bind molecules to the glass, creating a monolayer that is resistant to non-specific binding. The most commonly used molecule for this purpose is polyethylene glycol (PEG), in either a linear or branched form [6]. Cells cannot adhere to pure PEG layers, so for single-molecule experiments in cells layers must be supplemented with molecules that allow the cells to bind. RGD peptides, that mimic cell adhesion proteins [9], have been used for this purpose. Finally, a recent publication describes a hybrid approach, using PEG-BSA nanogels [10] for surface passivation. There are a number of studies in the literature that describe the use of individual coatings against non-specific binding of particular molecules [11–13] but, surprisingly, a comprehensive comparative study of the effectiveness of commonly used passivation treatments has not been published. Here we describe a comparative study of 10 glass coverslip treatments for single-molecule microscopy. For non-cell experiments we investigated the non-specific binding of three proteins: Human epidermal growth factor (EGF), anti-human epidermal growth factor receptor 2 (HER2) Affibody [14,15], and hen egg white lysozyme (HEWL), each labelled with three different fluorescent probes. For cell culture experiments, we studied the effect of surface treatments on non-specific binding of anti-human epidermal growth factor receptor (EGFR) Affibody labelled with two different fluorescent probes. We show the effects of non-specific binding on single-molecule tracking experiments, and demonstrate the relative effectiveness of the different surface treatments.
Results
Non-specific Binding of Probes to the Glass Depends Predominantly on the Dye
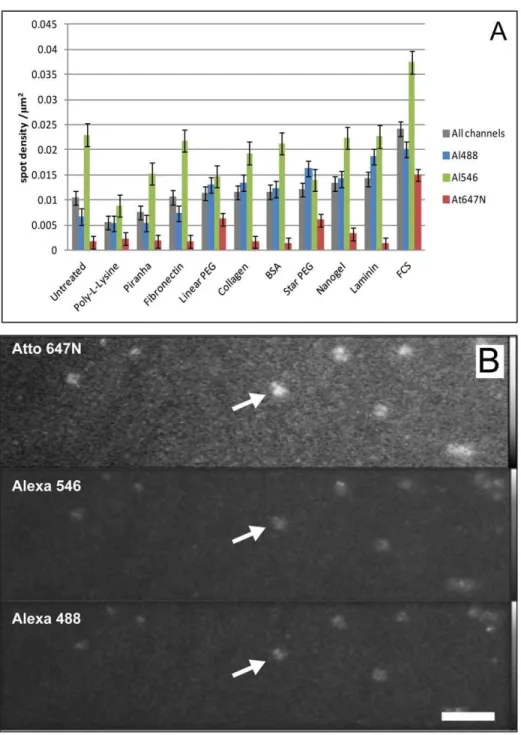
We investigated 10 commonly used surface passivation treat-ments. For single-molecule imaging it is important that surface treatments do not increase the level of background fluorescence from the substrate. Background fluorescence can take two forms; either additional single-molecule spots or diffuse background haze. Fig. 1A compares both individual and the mean spot density for all the channels observed for untreated glass with that of treated glass, before the addition of fluorescent protein. The figure shows comparable mean spot densities for all the treatments, although the density with FCS appears to be marginally higher. This would be expected given that serum contains a cocktail of molecules, some of which are expected to be fluorescent. Also, for all coatings tested, spot density levels appear higher for 488 and 546 channels compared with the far-red channel. Higher levels of background fluorescence haze were seen with both FCS and BSA. Background fluorescence was also observed for star PEG. Five out of the 9 dishes tested showed bright streaks and patches of autofluores-cence in all detection channels (example shown in Fig. 1B).
The relative efficacy of the coatings in preventing non-specific binding of proteins was determined by measuring the density of single-molecule fluorescent spots, detected using Bayesian seg-mentation [16], after exposure of the treated surfaces to fluorescently labelled proteins. Protein and coating characteristics are detailed in Table 1. Fig. 2 shows the average density of
single-molecule fluorescent spots recorded for each treatment. The totals displayed in Fig. 2a show the general trends observed. As expected, untreated glass has the highest level of non-specific binding. Vigorous cleaning with piranha solution only marginally reduces the level of binding. Moderate blocking of non-specific binding is observed for protein-based treatments, collagen being the least effective and FCS and BSA the most effective. Best blocking of non-specific binding is achieved by the PEG-based treatments, with nanogel and star-PEG [17] being slightly more effective than linear PEG.
The effectiveness of blocking of non-specific binding is also dependent on the protein in use, and on the fluorescent dye with which it is labelled. Fig. 2B and C show the average densities of fluorescent spots, grouped by dye molecule and by protein, respectively. These data show that the effect of the dye is, in most cases, significantly greater than the effect of the protein. Proteins labelled with Alexa 488 show lower levels of non-specific binding than proteins labelled with the other dyes, with most of the surface treatments showing similar levels of effectiveness. Alexa 546 and Atto 647N-labelled proteins show similar degrees of non-specific binding, although there are some differences in the effectiveness of surface treatments for the different dyes. For example, linear PEG works well with Alexa 546 and less well with Atto 647N, while the reverse is true for Nanogel. Differences in non-specific binding between different proteins are less pronounced. The better surface treatments, particularly linear PEG, appear to be marginally less effective against Affibody binding. Some specific effects can also be observed. For example, poly-L-lysine prevents binding of HEWL very effectively, but performs poorly with EGF, but the opposite is observed with BSA treatment. This would be expected given the expected net charge of the proteins and coats.
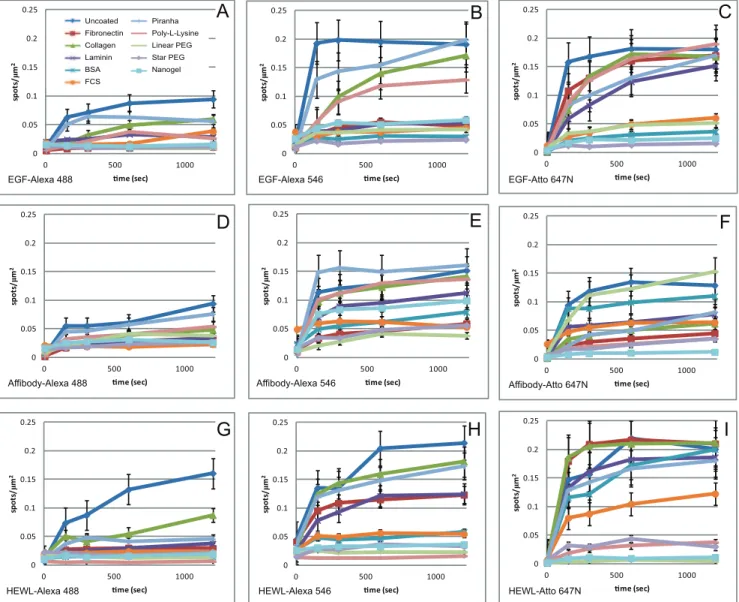
Detailed data on the levels of non-specific binding for all the protein conjugates are shown in Fig. 3. This figure also shows the effect of length of incubation on non-specific binding. As expected, levels of non-specific binding increase with longer incubation times. In general, the individual proteins follow the trends observed in the average data shown in Fig. 2. Some anomalous behaviours are observed, for example Affibody-Atto 647N shows relatively high levels of non-specific binding to linear PEG-treated glass, which is in general one of the more effective treatments. However, it is still reasonably effective with this protein if incubation times are kept short.
Non-specific Binding of Proteins to Glass can Cause Artefacts when Tracking Molecules on Cell Membranes
contributed by EGFR-eGFP molecules localised in trafficking vesicles or internal membranes is not detected as single-molecule spots, but rather as a diffuse haze. Autofluorescence of the parental cell line was assessed by imaging unlabelled cells, seeded on the same substrates used in the main experiment, using all three lasers. Fig. 4 shows that the background signal of the cells is in the same range as that of the unlabelled dishes (Fig. 1A), showing that the main contribution stems from impurities of the substrate rather than from cell autofluorescence.
The specificity of the probe and therefore the extent of non-specific binding to the cells was assessed both by confocal and single-molecule microscopy. A431 cells, which overexpress EGFR were used for confocal experiments for higher intensity and T47D cells, which express low levels of EGFR, were used in single-molecule experiments to enable detection of individual spots. As shown in Fig. 5A and 5B, competing the labelled species with 100x unlabelled Affibody reduced the labelling to background levels, which should rule out non-specific interactions with the mem-brane. The specificity of HER1 Affibody for the EGFR receptor
Figure 1. Background fluorescence of treated surfaces.A) Mean spot density/mm2histograms for each surface treatment before exposure to fluorescently-labelled protein (grey columns represent the average calculated on all three channels - each data point corresponds to mean6SEM from 135 areas, coloured columns represent the averages for each single channel – each data point corresponds to mean6SEM from 45 areas). B) TIRF fluorescence image of star PEG-treated dish, showing patches of background fluorescence in all detection channels (example arrowed) (bar 8mm).
was assessed by competing a labelled species (EGF or Affibody) with 100x concentration of the other species. Cross-competition, already demonstrated for Z:EGFR955 [19], a close sequence relative of the commercial Affibody used in our experiments, reduced the signal to background levels for both species (Fig. 5C). Assessment of non-specific binding to the substrate vs specific binding of the Affibodies to EGFR was made by monitoring the diffusion coefficients of the fluorescent spots observed in the eGFP, Alexa 546, and Atto 647N channels. In the absence of non-specific binding, all channels would be expected to show similar rates of diffusion, with similar numbers of mobile molecules. As non-specifically bound molecules should be immobile, higher levels of non-mobile molecules in the Alexa 546 and Atto 647N channels with respect to the eGFP channel would indicate the presence of non-specific binding. We investigated a number of surface treatments typically used in single-molecule cell experiments: 0.01% poly-L-lysine, 25mg/ml fibronectin, 25mg/ml laminin, collagen, 1% BSA, and linear PEG. As cells do not adhere to linear PEG, the coating was doped with GRGDS peptide [9]. In order to confirm that GRGDS peptide was incorporated into the PEG layer, we also prepared and imaged layers containing FITC-labelled GRGDS (Fig. 6, see Materials and Methods for details). We did not use star PEG or nanogel for cell experiments because of higher levels of background autofluorescence.
Cells grew well on both uncoated and linear PEG/GRGDS substrates, and typical images are shown in Fig. 7. The motion of fluorescent spots was tracked and percentages of immobile fluorescent spots are plotted in Fig. 8. In general, there was a higher level of non-specific binding for Affibody labelled with Atto 647N than with Alexa 546. Both collagen and linear PEG treatment significantly reduced binding for Atto 647N Affibody,
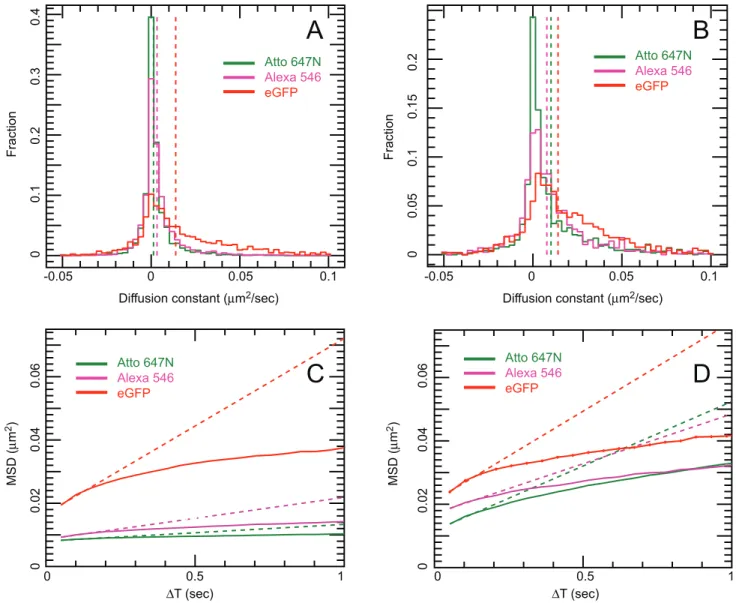
only linear PEG treatment resulted in significantly lowered binding for Alexa 546 Affibody. None of the other treatments significantly reduced non-specific binding, and poly-L-lysine treatment increased binding for Affibodies labelled with either dye. The effect of non-specific binding on tracking experiments can be seen in Fig. 9, which compares the motion of anti-EGFR Affibody labelled with Alexa 546 and Atto 647N on CHO cells cultured on untreated glass, and glass treated with linear PEG doped with GRGDS peptide. Comparison of the diffusion coefficient distribution histograms in Fig. 9 A (untreated) and B (linear PEG) reveals that the motion of Affibody in the latter experiment is closer to the motion of the reference eGFP; for uncoated glass, the distribution of Affibody mobility is skewed towards slower moving and stationary molecules. Similarly, in the mean squared displacement plots shown in Fig. 9 C (untreated) and D (linear PEG), displacements in the linear PEG experiment are much closer to the displacements in the reference channel than for untreated glass. Varying offsets at t = 0 are observed in the MSD plots. These are likely to be the result of different levels of spot localization errors, a function of the signal-to-noise of individual data sets. The MSD plots for EGFR-eGFP and for the two affibody probes in fig. 9D display a profile compatible with anomalous subdiffusion, which is expected and can be explained in the framework of the membrane-skeleton picket-fence model [20] by temporary corralling of the receptor by the membrane cytoskeleton or by other transmembrane proteins bound to the cytoskeleton. Additional compartmentalisation can be provided by EGFR association with lipid rafts [21], which have been shown to act as transient confinement zones [22].
Table 1.Characteristics of ligands, coatings, and fluorophores.
Mw (Da) pI GRAVY1 Aliphatic index2 Net charge at pH 7
Ligand
EGF 6,045 4.69 20.506 55.09 22.2
HEWL 14,313 9.32 20.472 65.12 7.7
HER2 Affibody 6,736 8.9 20.625 84.58 2
HER1 Affibody 13,860 4.65 20.507 79.68 25
Coating
Poly-L-Lysine variable (150,000–300,000) 9.6 23.9 0 poly-cation
Fibronectin 269,110 5.28 20.513 69.06 266
Laminin3
,700,000 ,5.3 ,20.5 ,70 2227
Collagen4
,300,000 ,7.8 20.261 to 0.919 ,40 to 80 35
BSA 66,433 5.6 20.475 76.14 217
FCS mixture of proteins variable variable variable variable
Linear PEG 5,000 – – – 0
Star PEG 10,000 – – – 0
Nanogel mixture of Star PEG and BSA – – – –
Fluorophore
Alexa Fluor 488 643 – – – 22
Alexa Fluor 546 1,079 – – – 22
Atto 647N 868 – – – 1
1
GRAVY is the grand average of hydropathicity; more negative values indicate greater hydrophilicity [58].
2Aliphatic index; the relative volume occupied by aliphatic side chains [59]. 3Laminin values taken as average ofa1,b1, andc1 chains.
4Collagen values representative of the range of collagen types as commercially prepared dishes do not specify type. – indicates not applicable or not known.
Discussion
The data described above confirm that non-specific binding is an important issue for single-molecule experiments. We observe significant levels of non-specific binding both in the presence and absence of cells. For non-cell experiments, it is important that only data from specifically immobilized molecules are observed, as uncontrolled binding to the substrate through non-specific in-teraction can result in denaturation of the molecules [23], and therefore non-representative results. For cell experiments, we have demonstrated that high levels of non-specific binding can significantly affect measured diffusion coefficients and mean squared displacements, important parameters for tracking experi-ments. This problem cannot be eliminated by discounting data from immobile molecules, as it has been reported that
trans-membrane receptors, and in particular EGFR, can be immobi-lized or slowed down for variable periods of time when they are actively engaged in signalling [24–27], or even in the resting state [25,28]. Immobilisation of EGFR molecules has been observed in different cell lines and with different techniques such as FRAP [28], fluorescent-molecule tracking [24,25,27] and single-particle video-rate tracking [26]. Possible mechanisms underlying the immobilisation of EGFR molecules are likely to be manifold. EGFR is known to bind to actin filaments [29] and indeed the depolymerisation of actin can alter the diffusional behaviour of the receptor [24,28,30]. EGFR is also associated with lipid rafts (reviewed in [31] and [32]), which regulate its activation and diffusion. Disruption of caveolae [25] and cholesterol depletion [24,30] are also able to alter the immobile fraction of EGFR in the each fluorophore (each data point corresponds to mean6SEM from 45 areas, 3 different proteins). c) Average spot densities/mm2for each protein,
each data point corresponds to mean6SEM from 45 areas, 3 different fluorophores). doi:10.1371/journal.pone.0045655.g002
Figure 3. Fluorescent spot density/mm2plots for treated surfaces exposed to the following labelled proteins.A) Alexa 488, B) EGF-Alexa 546, C) EGF-Atto 647N, D) anti-HER2 Affibody-EGF-Alexa 488, E) anti-HER2 Affibody -EGF-Alexa 546, F) anti-HER2 Affibody -Atto 647N, G) HEWL C-EGF-Alexa 488, H) HEWL C -Alexa 546 and I) HEWL C -Atto 647N, incubated on differently coated glass surfaces for 150, 300, 600 and 1200 seconds at room temperature. Each datapoint corresponds to mean6SEM of 15 areas acquired from 3 independent samples.
membrane, at least in some cell systems. Another candidate for receptor immobilisation is the galectin lattice that cross-links glycoproteins on the extracellular side of the membrane. The disruption of this lattice leads to inceased mobility of EGFR [28]. Finally,the immobilisation of active receptors is linked to the activity of the tyrosine kinase domain [27] The presence of an immobile fraction of EGFR is confirmed in our experiments, in which we observe a percentage (5–15%, variable but still well within observations in the literature [25,26,28]) of immobile molecules in the eGFP reference channel. This variability can be due to differential activation of adhesion receptors by the substrates: fibronectin, laminin, collagen and GRGDS peptide activate different complements of integrin subunits (reviewed in [33,34]), while Poly-L-Lysine is supposed to act by favouring electrostatic interactions with the cell membrane. The differential effect of different substrates on cell behaviour has been reported in the biomaterials field [35–40] and in this case the effect can be compounded by the fact that integrin signalling is known to interweave with EGFR signalling (reviewed in [41]). Since receptor immobilization might be a feature of signalling, it is essential to keep the levels of non-specific binding to a minimum for all single-molecule experiments.
Our systematic study of the effects of various surface treatments shows that the levels of non-specific binding are the result of the interaction of three factors; the treatment used, the protein, and the fluorescent dye with which the protein is labelled. We consistently observed lower levels of non-specific binding for protein labelled with Alexa 488, while Atto 647N-labelled proteins showed the highest levels of binding. This is probably caused by the different charge and hydrophobicity characteristics of the dyes; Alexa 488 is negatively charged and hydrophilic, whereas Atto 647N has a positive charge and is hydrophobic [42–44]. High levels of non-specific binding of Atto 647N conjugates have been reported previously [42]. Careful selection of dye is therefore an important starting point when planning single-molecule experiments. If a choice of dyes is available, it would be advisable to perform test experiments and select the dye that results in the lowest levels of non-specific binding. However, other considerations such as appropriate spectral characteristics and photostability will affect dye choice. For example, although we observe higher levels of non-specific binding with Atto 647N, this dye is particularly stable and may
still be the best choice for long-term tracking of single molecules [45].
Choice of protein is usually much more restricted than choice of fluorescent label. Obviously the protein of interest is the protein that must be used, whatever its binding characteristics, although there may sometimes be a choice available amongst, for example, different antibodies against the target protein. However, this is the exception so in most cases the experimenter must select an appropriate surface treatment for the protein in use. We selected three proteins with varying characteristics (EGF: pI 4.5, negatively charged at pH 7.4, mix of hydrophobic and hydrophilic residues; Affibody: pI 9.0, slightly positively charged at pH 7.4, hydropho-bic and hydrophilic regions; and HEWL pI 11.3, strongly positively charged at pH 7.4, mainly hydrophilic) and tested them against a range of substrates with different surface change and hydropathy profiles: For a summary of protein and coating characteristics, see Table 1. In general, the relative efficacy of the surface treatments was similar for all proteins, with the PEG-based treatments (linear PEG, star PEG, and nanogel) being the most effective in preventing non-specific binding. However, in some cases the combination of a different coating with a specific protein was particularly effective. For example, poly-L-lysine treatment resulted in very low levels of non-specific binding of HEWL. This is not unexpected, given that both coating and protein are strongly positively charged at the pH used in the experiments, so electrostatic repulsion would be expected to inhibit binding. Conversely, the effectiveness of BSA was limited to EGF. These data show that in some cases careful choice of surface treatment to match the protein in use can be an effective approach.
When the experiment involves measurements in cells, the choice of surface treatment is more complex. The major problem is that coatings which prevent non-specific binding of proteins tend to hinder the interactions that allow cells to adhere to surfaces. Also, adsorption of proteins from the cell culture medium, extracellular proteases and extracellular matrix (ECM) deposition by cells can modify the culture substrate [34]. Modification of substrates by cells, such as matrix degradation by extracellular matrix metalloproteases, may make the sub-trates more susceptible to adsorption of spurious proteins, which might explain why coatings such as poly-L-lysine, fibronectin, collagen and laminin, which were moderately effective in preventing non-specific binding in the absence of cells, were ineffective when cells were present. The most effective treatments for non-cell measurements were those based on PEG, and our results with linear PEG confirm this to be the case for cell experiments as well. Growing cells on synthetic biomaterial substrates, such as PEG, is a staple technique of tissue engineering and regenerative medicine. PEG is employed due to its ability to repel non-specific protein adhesion ([46] and reviewed in [47–49]). PEG is an uncharged, hydrophilic polymer which displays low toxicity to cells. It is able to undergo extensive hydration in aqueous mediums, by virtue of displaying two hydrogen-bond acceptor groups. This, along with its conformational flexibility, causes a volume restriction effect that hinders protein deposition on PEG layers [50]. The compression of the polymer layer by incoming proteins is unfavorable from a thermodynamic standpoint [51].While these properties and the fact that the polymer is not biodegradable [48], make PEG an ideal and stable reagent for passivation, they also make cell adhesion problematic and anchorage-dependent cell viability low, therefore PEG surfaces and other biomaterials are routinely doped with adhesion peptides and biomolecules derived from ECM proteins and proteoglycans to encourage cells to grow, divide and differentiate [33]. Various
Figure 4. Mean spot density/mm2 histograms of background fluorescence of wt Cho cells seeded on different substrates (each data point corresponds to mean6SEM from at least 15 areas).
adhesion peptides are available, GRGDS being one of the most widely used [34]. In our hands, CHO-EGFR-eGFP were able to grow on Linear PEG functionalized with as little as 0.2mM GRGDS peptide (data not shown), albeit at the expense of faster apoptosis under serum deprivation conditions during experimental time. Using GRGDS peptide at a concentration of 0.4 mM resulted in a surface that was able to sustain the growth of CHO-EGFR-eGFP, yielding confluent monolayers of cells with a normal morphology (flat, polygonal, and elongated, compared with a rounded appearance and ruffled membrane for unhealthy cells) and EGFR-eGFP expression level. GRGDS peptide is known to bind to avb3, a5b1 and avb5 integrins [9,34]. Different peptides, such as laminin-derived YIGRS and IKVAV [34,52,53] could be better suited to cell lines expressing a different complement of adhesion receptors.
Conclusions
Single-molecule techniques are increasingly popular in the biomedical field and are being used to investigate a wealth of biological questions. Non-specific binding of fluorescent single molecules is a major problem for single-molecule experiments. Our systematic investigation of surface passivation treatments demonstrates that non-specific binding can be minimized by careful selection of fluorescent labels, and by tailoring the surface treatment to suit the type of molecule being investigated. Treatments based upon PEG appear to give the best results overall, although care must be taken to use high purity materials to minimize background fluorescence.
Linear PEG seems a good option for functionalizing glass surfaces for single-molecule experiments in cells, as it can repel different proteins characterized by different MW and pI and retains its properties even after cells are grown on it and despite their modifying effect, whereas other biological substrates of comparable efficacy in cell-free settings might be affected by ECM degradation/deposition processes, as evidenced by our live-cell
tracking experiments. A wealth of adhesive peptides can be combined with linear PEG in order to facilitate adhesion of different cell strains and, while 0.4 mM GRGDS was a good solution for our cell model, it is probable that case-by-case optimization of adhesive cocktails will be needed.
Materials and Methods
Surface Passivation
Glass-bottom cell culture dishes (MatTek Corporation) were used for all surface treatments. Details of surface passivation treatments were as follows:
‘‘Piranha’’ cleaned dishes. 150ml of concentrated sulphu-ric acid were mixed with 50ml of 30% w/v hydrogen peroxidein situon the cover slip. The solution was left for 15 minutes at room
temperature and the dishes then rinsed with copious amounts of deioinsed water. Dishes were allowed to dry and stored at room temperature in sealed plastic sleeves.
Polyethylene glycol. Dishes were first cleaned with piranha solution as described above. Dishes were then treated with 4-aminopropyl triethoxysilane (APTES; Sigma Aldrich), as follows. A 2% v/v solution of APTES in water was made up immediately prior to treatment. The APTES solution was added to the dishes, completely covering the glass, and dishes were incubated for 15 minutes at room temperature. Dishes were then rinsed extensively with deionized water and allowed to dry. Dishes were left overnight at room temperature before the next stage. PEG solutions were prepared immediately before use. Either 8-arm PEG-vinyl sulfone, MW 10K ‘‘star-PEG’’ (Creative PEGWorks), or PEG-succinimidyl valerate, MW 5K ‘‘linear PEG’’ (Laysan Bio), were dissolved at a concentration of 200 mg/ml in filtered sodium bicarbonate buffer, pH 8.5. The solution was added to the dishes, and incubated for 3 hours at room temperature. Dishes were then rinsed thoroughly with deionized water, allowed to dry, and stored at 2–8uC for use within 2–4 weeks. In dishes to be used for cell culture, GRGDS peptide (Anaspec) was added to the PEG
Figure 5. Determination of level of non-specific binding of labelled proteins to cells.A) Spot density/mm2plot for HER1 Affibody Alexa488
on T47D cells in presence (red) or absence (blue) of 100x excess unlabelled HER1 Affibody as determined by fluorescent single-molecule detection. B) Average intensity histogram of HER1 Affibody Alexa488 on A431 cells in presence (red) or absence (blue) of 100x excess unlabelled HER1 Affibody as determined by confocal imaging. C) Average intensity histogram of HER1 Affibody Alexa488 (blue) and EGF Atto 647N (red) on A431 cells in presence or absence of 100x excess unlabelled competitor.
doi:10.1371/journal.pone.0045655.g005
Figure 6. TIRF image of PEG-treated glass doped with fluorescent GRGDS peptide and T47D cells treated with DiD membrane probe to highlight membrane protrusions and membrane-glass contact areas (bar 8mm).
solution at concentrations of 0.2mM or 0.4 mM. FITC-labelled GRGDSP peptide (Anaspec) was used at concentrations of 0.2– 200mM. Dishes were stored in sealed plastic sleeves at 2–8uC and used within six weeks of coating.
PEG-BSA nanogels. PEG-BSA nanogels were prepared
using 8-arm PEG-vinyl sulfone and BSA, as described by Tessler
et al. [10]. Dishes were first cleaned with piranha solution and
treated with APTES as described above. 10% w/v nanogel in PBS was added to the dishes, and they were incubated for 1 hour at 37uC. The dishes were then washed in PBS and incubated for 1 hour at 37uC with 50 mg/ml BSA in PBS. The dishes were exposed to 1 M Tris, pH 8.0 for 15 minutes at room temperature
to quench unreacted vinyl sulfone groups. Finally, dishes were washed with PBS. Dishes were filled with PBS to prevent layer desiccation and stored at 2–8uC for use within 2–4 weeks.
Poly-L-lysine. Dishes were first cleaned with piranha solu-tion, as described above. 0.01% w/v poly-L-lysine in deionized water was added to dishes, covering the surface of the glass. Dishes were incubated for 3 hours at room temperature, and the poly-L-lysine solution was then aspirated off, and the dishes stored at room temperature for use within 2–4 weeks.
Bovine serum albumin. A solution of 1% w/v of Bovine
Serum Albumin (Sigma) in PGBS was prepared and sterile filtered. Enough solution to cover the glass was added to the dishes and incubated at room temperature for 1 hour. BSA solution was then aspirated off and dishes were stored at 4uC for use within 2–4 weeks.
Fetal calf serum. Pure Fetal Calf Serum (Gibco) was added to the glass coverslips and incubated at room temperature for 1 hour. FCS was then aspirated off and dishes were stored at 4uC for use within 2–4 weeks.
Laminin. 25mg/ml laminin (Sigma) in PBS was added to
dishes, covering the surface of the glass. Dishes were incubated for 2 hours at room temperature, and the laminin solution was then aspirated off, and the dishes stored at 2–8uC for use within 2–4 weeks. For cell culture experiments, dishes were rinsed with culture medium before plating cells.
Fibronectin. 25mg/ml fibronectin (Sigma) in PBS was added to dishes, covering the surface of the glass. Dishes were incubated for 45 minutes at room temperature, and the fibronectin solution was then aspirated off, and the dishes stored at 2–8uC for use within 2–4 weeks. For cell culture experiments, dishes were rinsed with culture medium before plating cells.
Collagen. Commercially available collagen-coated glass-bot-tomed dishes were used (MatTek Corporation).
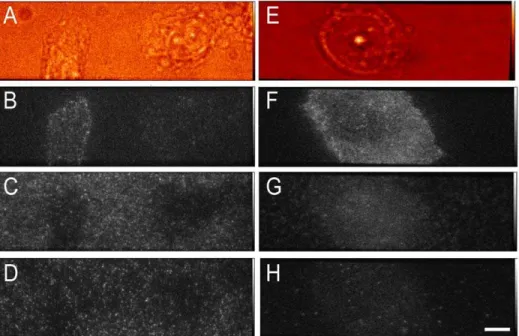
Figure 7. Representative images of cells exposed to labelled proteins.Panel A–D: representative images of CHO-EGFR-eGFP cells grown on uncoated glass. Whitelight (A), anti-EGFR Affibody Atto 647N (B), anti-EGFR Affibody Alexa 546 (C), and EGFR-eGFP (D). Panels E–H: representative images of CHO-EGFR-eGFP cells grown on linear-PEG+0.4 mM GRGDS peptide-coated glass. Whitelight (E), Anti-EGFR Affibody Atto 647N (F), anti-EGFR Affibody Alexa 546 (G), and anti-EGFR-eGFP (H) (bar 8mm).
doi:10.1371/journal.pone.0045655.g007
Figure 8. Histogram showing percentage of tracks with diffusion coefficient falling in the D = 0 bin of the D distribu-tion histogram in the three acquisidistribu-tion channels on CHO-EGFR-eGFP cells grown on differently coated glass surfaces and labelled with anti-EGFR Affibody Alexa 546 and Atto 647N for 15 minutes at 37uC.Each datapoint corresponds to mean6SEM of 15 areas acquired from 3 independent samples.
Assessment of GRGDS Incorporation into PEG Layers
Incorporation of GRGDS peptide into the PEG coating was measured by imaging coatings doped with different concentrations of FITC-labelled GRGDSP peptide. T47D cells (ECACC) were cultured in RPMI 1640 medium and supplemented with 10% FCS, 2 mM L-Glutamine and 1% penicillin/streptomycin (all Invitrogen). Cells were seeded on PEG-coated dishes doped with FITC-RGD, at a density of 36105cells/dish, cultured until 70% confluence was reached, then deprived of serum for 2 h and labelled with 5mM DiD membrane probe (Invitrogen) to assess cell spreading and surface contact. Cells were imaged live on a TIRF microscope. The image in Fig. 6 shows significant levels of FITC fluorescence, demonstrating the presence of the fluorescent peptide in the PEG layer and acceptable cell morphology, with presence of filopodia, protrusions and focal adhesions, which indicate that the cells are able to bind to the peptide embedded in the PEG layer. Reduction of fluorescence in the FITC channel in
correspondence with adhesion points might be due to energy transfer between FITC and DiD or to peptide uptake by cells.
Cell culture
CHO-EGFR-eGFP cells (kind gift of Dr. Donna Arndt-Jovin [54]) were cultured in DMEM without phenol red and supplemented with 10% FCS, 2 mM L-Glutamine, 1% penicil-lin/streptomycin and 2 ml/l Geneticin (all Invitrogen). Wt Cho and A431 cells were cultured in DMEM without phenol red and supplemented with 10% FCS, 2 mM L-Glutamine and 1% penicillin/streptomycin (all Invitrogen). Cells were plated on uncoated, poly-L-lysine-coated, collagen-coated, fibronectin-coat-ed, laminin-coated or linear PEG/GRGDS-coated glass-bottomed dishes at a density of 105cells/dish.Cells were rinsed twice with serum-free medium and starved for 2 hours upon reaching 80% confluence to remove serum-derived growth factors which can interfere with probe binding.
Figure 9. Side-by-side comparison of mean squared displacement (MSD) curves and diffusion coefficient (D) histograms from CHO-EGFR-eGFP cells grown on uncoated glass vs. linear-PEG+0.4 mM GRGDS-coated glass.Data were plotted from at least 15 areas acquired from 3 independent samples. Each MSD value comes from at least 6500 (ranging up to 300,000) individual separations, resulting in very small standard error in the MSD. Error bars are plotted but too small to be visible. Panels A (uncoated) and B (linear PEG+GRGDS): diffusion coefficient histogram of tracked spots. EGFR-eGFP (red), anti-EGFR Affibody Alexa 546 (magenta), anti-EGFR Affibody Atto 647N (green). Dotted lines show the mean D coefficient extrapolation. Panels C (uncoated) and D (linear PEG+GRGDS): Mean Square displacement plot. EGFR-eGFP (red), anti-EGFR Affibody Alexa 546 (magenta), anti-EGFR Affibody Atto 647N (green). Dotted lines show the mean D coefficient extrapolation.
Fluorescent Labelling of Proteins
Alexa 488, Alexa 546 (both Sigma) and Atto 647N (Atto Tec) NHS-ester were conjugated to the N-terminus of murine epidermal growth factor (EGF) in a 1:1 stoichiometry by Cambridge Research Biochemicals. Anti-EGFR Affibody and anti-HER2 Affibody (both Abcam) were labelled at single cysteine residues in a 1:1 stoichiometry with Alexa 488, Alexa 546 and Atto 647N maleimide, following the manufacturer’s instructions. Alexa 488, Alexa 546 and Atto 647N NHS-ester were conjugated to the N-terminus of Hen Egg White Lysozyme (Sigma) in a ,1:1
stoichiometry as per dye manufacturer’s instructions.
Cell-free Assessment of Non-specific Protein Binding
Glass-bottomed dishes were imaged (see below) firstly upon addition of PBS solution, in order to ascertain the presence and amount of impurities, taking single-frame images of 5 non-overlapping areas, then PBS was aspirated off and glass dishes were treated with a solution of triply labelled protein (10 nM of each labelled species for EGF and HEWL, 11 nM of each labelled species for anti-HER2 Affibody). Single-frame images of 5 non-overlapping areas were taken at 150 s, 300 s, 600 s, and 1200 s. Experiments were performed in triplicate and spot density/mm2 was calculated for each imaged area and logged in GraphPad Prism 5 (GraphPad Software, Inc.). Mean6SEM of 15 areas was plotted for each data point.
Cell Labelling
Starved cells were rinsed twice with PBS pH 7.4 pre-heated at 37uC and labelled with 2 nM each anti-EGF Affibody Alexa 546 and Atto 647N for 15 minutes at 37uC. Cells were rinsed twice with PBS pH 7.4 pre-heated at 37uC and promptly imaged as described below. For probe specificity assessment, starved cells were rinsed twice with chilled PBS pH 7.4 and labeled with the appropriate amount of HER1 Affibody or EGF with or without 100x excess unlabelled HER1 affibody or EGF. Cells were rinsed twice with chilled PBS pH 7.4 and fixed in 3% paraformaldehyde (Electron Microscopy Sciences), 0.5% glutaraldehyde (Sigma) for 30 minutes prior to imaging.
Confocal Data Acquisition and Analysis
Confocal images used to assess HER1 Affibody specificity were acquired using a Nikon, Eclipse Ti microscope equipped with a, Nikon, D-Eclipse C1 scanning unit and a PMC100-1 photo-multiplier (Becker & Hickl GmbH). The output from the AOTF of a supercontinuum laser source (Fianium, SC450-4, 40 MHz repetition rate) at wavelength bands 491 nm and 635 nm was used as an illumination source. Average intensity from confocal images was calculated with ImageJ software (NIH) [55] by thresholding the image and converting it into a binary mask, then substracting it from the original image and obtaining the list of pixel intensity frequencies through the Pixelhoover v1 plugin (for 16-bit images) or through the Analyze.Histogram command. Pixel intensity frequencies for different areas of the same sample
were imported in Excel spreadsheets, added up and multiplied by their intensity values (1–255), then averaged. Intensity data from at least 30 cells were used for each treatment.
Single-molecule Data Acquisition
Single- molecule images were acquired using a Zeiss Axiovert TIRF-setup with excitation wavelengths l= 491 nm (100 mW, Cobolt Calypso), 561 nm (100 mW, Oxxius SLIM), 639 nm (30 mW, PTI IQIC30), as described previously [56]. Field of view of each channel for single-molecule imaging was 80630mm. Tracking data of triply labelled cells was acquired at 20 Hz for 30 seconds. At least 15 areas were acquired over three independent replicates for each experimental condition. For probe specificity assessment, data were acquired at 10 Hz for 1 minute. At least 10 areas were acquired for each experimental condition. Images were saved in HDF5 format for subsequent processing using custom-designed software [16].
Analysis of Tracking Data
All single-molecule time series data were analysed using the multidimensional analysis software described in [16]. Registration transformations were determined but feature detection and tracking was performed independently in each channel. For each time series, cell areas were outlined manually using new functionality in the software in [16]. Single-molecule tracks whose mean positions were in the outlined cell areas were pooled together for cells imaged under the same conditions and their Mean Square Displacement (MSD) curve calculated. MSD was calculated as MSD(DT) =,|ri(T +D-DT) =,|ri(T+DT)2ri(T)|2. where |ri(T+DT)2ri(T)| is the
dis-placement between position of trackiat timeTand timeT+DTand
the average value is over all pairs of points separated byDTin each
track. Histograms of instantaneous diffusion coefficients (D) were
calculated by calculating an MSD curve separately for each track, fitting a straight line to the first 3 points of that MSD curve then calculatingDdirectly from the gradientmof the fit,D=m/4 (see e.g.
[57]). Histograms were then produced using theDvalues for the
pooled tracks from the selected cell areas.
Acknowledgments
The authors acknowledge and thank Dr. Sarah Cartmell (Manchester X-Ray Imaging Facility) and Dr. Paul Roach (Institute for Science and Technology in Medicine, Keele University) for useful advice about biomaterials, Dr. Donna Arndt-Jovin (Max Planck Institute for Biophysical Chemistry) for the kind gift of CHO-EGFR-eGFP cells and Dr. Christopher J Tynan for critical reading of the manuscript and helpful suggestions. The authors gratefully acknowledge funding from the UK Biotechnology and Biological Sciences Research Council (BB/G006911/ 1).
Author Contributions
Conceived and designed the experiments: LZ MM SN DC. Performed the experiments: LZ SN. Analyzed the data: DR LZ SN. Contributed reagents/materials/analysis tools: DC. Wrote the paper: DC LZ.
References
1. Selvin PR, Ha T (2007) Single-Molecule Techniques: A Laboratory Manual: Cold Spring Harbor Laboratory Press. 507 p.
2. Neuman KC, Nagy A (2008) Single-molecule force spectroscopy: optical tweezers, magnetic tweezers and atomic force microscopy. Nature methods 5: 491–505.
3. Joo C, Balci H, Ishitsuka Y, Buranachai C, Ha T (2008) Advances in single-molecule fluorescence methods for molecular biology. Annual review of biochemistry 77: 51–76.
4. Qu X, Wu D, Mets L, Scherer NF (2004) Nanometer-localized multiple single-molecule fluorescence microscopy. Proceedings of the National Academy of Sciences of the United States of America 101: 11298–11303.
5. Yildiz A, Selvin PR (2005) Fluorescence imaging with one nanometer accuracy: application to molecular motors. Accounts of chemical research 38: 574–582. 6. Roy R, Hohng S, Ha T (2008) A practical guide to single-molecule FRET.
Nature methods 5: 507–516.
8. Zhong H (2010) Photoactivated localization microscopy (PALM): an optical technique for achieving,10-nm resolution. Cold Spring Harbor protocols 2010: pdb top91.
9. Ruoslahti E (1996) RGD and other recognition sequences for integrins. Annual review of cell and developmental biology 12: 697–715.
10. Tessler LA, Donahoe CD, Garcia DJ, Jun YS, Elbert DL, et al. (2011) Nanogel surface coatings for improved single-molecule imaging substrates. Journal of the Royal Society, Interface/the Royal Society 8: 1400–1408.
11. Tessler LA, Reifenberger JG, Mitra RD (2009) Protein quantification in complex mixtures by solid phase single-molecule counting. Analytical chemistry 81: 7141–7148.
12. Fordyce PM, Valentine MT, Block SM (2008) Advances in surface-based assays for single molecules. In: Selvin PR, Ha T, editors. Single Molecule Techniques: A Laboratory Manual: Cold Spring Harbor Laboratory Press. 431–460. 13. Heyes CD, Kobitski AY, Amirgoulova EV, Nienhaus GU (2004) Biocompatible
surfaces for specific tethering of individual protein molecules. Journal of Physical Chemistry B 108: 13387–13394.
14. Wikman M, Steffen AC, Gunneriusson E, Tolmachev V, Adams GP, et al. (2004) Selection and characterization of HER2/neu-binding affibody ligands. Protein engineering, design & selection : PEDS 17: 455–462.
15. Orlova A, Magnusson M, Eriksson TL, Nilsson M, Larsson B, et al. (2006) Tumor imaging using a picomolar affinity HER2 binding affibody molecule. Cancer research 66: 4339–4348.
16. Rolfe DJ, McLachlan CI, Hirsch M, Needham SR, Tynan CJ, et al. (2011) Automated multidimensional single molecule fluorescence microscopy feature detection and tracking. European biophysics journal : EBJ 40: 1167–1186. 17. Groll J, Fiedler J, Engelhard E, Ameringer T, Tugulu S, et al. (2005) A novel star
PEG-derived surface coating for specific cell adhesion. Journal of biomedical materials research Part A 74: 607–617.
18. Friedman M, Nordberg E, Hoiden-Guthenberg I, Brismar H, Adams GP, et al. (2007) Phage display selection of Affibody molecules with specific binding to the extracellular domain of the epidermal growth factor receptor. Protein engineering, design & selection : PEDS 20: 189–199.
19. Nordberg E, Friedman M, Go¨string L, Adams GP, Brismar H, et al. (2007) Cellular studies of binding, internalization and retention of a radiolabeled EGFR-binding affibody molecule. Nucl Med Biol 34: 609–618.
20. Kusumi A, Nakada C, Ritchie K, Murase K, Suzuki K, et al. (2005) Paradigm shift of the plasma membrane concept from the two-dimensional continuum fluid to the partitioned fluid: high-speed single-molecule tracking of membrane molecules. Annual review of biophysics and biomolecular structure 34: 351–378. 21. Hofman EG, Ruonala MO, Bader AN, van den Heuvel D, Voortman J, et al. (2008) EGF induces coalescence of different lipid rafts. Journal of cell science 121: 2519–2528.
22. Dietrich C, Yang B, Fujiwara T, Kusumi A, Jacobson K (2002) Relationship of lipid rafts to transient confinement zones detected by single particle tracking. Biophysical journal 82: 274–284.
23. Qin M, Hou S, Wang L, Feng X, Wang R, et al. (2007) Two methods for glass surface modification and their application in protein immobilization. Colloids and surfaces B, Biointerfaces 60: 243–249.
24. Low-Nam ST, Lidke KA, Cutler PJ, Roovers RC, van Bergen en Henegouwen PM, et al. (2011) ErbB1 dimerization is promoted by domain co-confinement and stabilized by ligand binding. Nature structural & molecular biology 18: 1244–1249.
25. Xiao Z, Zhang W, Yang Y, Xu L, Fang X (2008) Single-molecule diffusion study of activated EGFR implicates its endocytic pathway. Biochemical and biophysical research communications 369: 730–734.
26. Kusumi A, Sako Y, Yamamoto M (1993) Confined lateral diffusion of membrane receptors as studied by single particle tracking (nanovid microscopy). Effects of calcium-induced differentiation in cultured epithelial cells. Biophysical journal 65: 2021–2040.
27. Chung I, Akita R, Vandlen R, Toomre D, Schlessinger J, et al. (2010) Spatial control of EGF receptor activation by reversible dimerization on living cells. Nature 464: 783–787.
28. Lajoie P, Partridge EA, Guay G, Goetz JG, Pawling J, et al. (2007) Plasma membrane domain organization regulates EGFR signaling in tumor cells. The Journal of cell biology 179: 341–356.
29. den Hartigh JC, van Bergen en Henegouwen PM, Verkleij AJ, Boonstra J (1992) The EGF receptor is an actin-binding protein. J Cell Biol 119: 349–355. 30. Orr G, Hu D, Ozc¸elik S, Opresko LK, Wiley HS, et al. (2005) Cholesterol
dictates the freedom of EGF receptors and HER2 in the plane of the membrane. Biophysical journal 89: 1362–1373.
31. Balbis A, Posner BI (2010) Compartmentalization of EGFR in cellular membranes: role of membrane rafts. Journal of cellular biochemistry 109: 1103–1108.
32. Pike LJ (2005) Growth factor receptors, lipid rafts and caveolae: an evolving story. Biochimica et biophysica acta 1746: 260–273.
33. Garcia AJ (2005) Get a grip: integrins in cell-biomaterial interactions. Biomaterials 26: 7525–7529.
34. Shekaran A, Garcia AJ (2011) Nanoscale engineering of extracellular matrix-mimetic bioadhesive surfaces and implants for tissue engineering. Biochimica et biophysica acta 1810: 350–360.
35. Brodbeck WG, Shive MS, Colton E, Nakayama Y, Matsuda T, et al. (2001) Influence of biomaterial surface chemistry on the apoptosis of adherent cells. J Biomed Mater Res 55: 661–668.
36. Brodbeck WG, Patel J, Voskerician G, Christenson E, Shive MS, et al. (2002) Biomaterial adherent macrophage apoptosis is increased by hydrophilic and anionic substrates in vivo. Proc Natl Acad Sci U S A 99: 10287–10292. 37. Garcı´a AJ, Vega MD, Boettiger D (1999) Modulation of cell proliferation and
differentiation through substrate-dependent changes in fibronectin conforma-tion. Mol Biol Cell 10: 785–798.
38. Shen M, Horbett TA (2001) The effects of surface chemistry and adsorbed proteins on monocyte/macrophage adhesion to chemically modified polystyrene surfaces. J Biomed Mater Res 57: 336–345.
39. McClary KB, Ugarova T, Grainger DW (2000) Modulating fibroblast adhesion, spreading, and proliferation using self-assembled monolayer films of alkylthio-lates on gold. J Biomed Mater Res 50: 428–439.
40. Keselowsky BG, Collard DM, Garcı´a AJ (2005) Integrin binding specificity regulates biomaterial surface chemistry effects on cell differentiation. Proceed-ings of the National Academy of Sciences of the United States of America 102: 5953–5957.
41. Soung YH, Clifford JL, Chung J (2010) Crosstalk between integrin and receptor tyrosine kinase signaling in breast carcinoma progression. BMB Rep 43: 311– 318.
42. Yao JZ, Uttamapinant C, Poloukhtine A, Baskin JM, Codelli JA, et al. (2012) Fluorophore targeting to cellular proteins via enzyme-mediated azide ligation and strain-promoted cycloaddition. Journal of the American Chemical Society 134: 3720–3728.
43. ATTO-TEC GmbH (2011) Product Information: ATTO 647N. Available: http://www.atto-tec.com/fileadmin/user_upload/Katalog_Flyer_Support/ ATTO_647N.pdf. Accessed 2012 Aug 31.
44. Panchuk-Voloshina N, Haugland RP, Bishop-Stewart J, Bhalgat MK, Millard PJ, et al. (1999) Alexa dyes, a series of new fluorescent dyes that yield exceptionally bright, photostable conjugates. The journal of histochemistry and cytochemistry : official journal of the Histochemistry Society 47: 1179–1188. 45. Hovius R, Guignet E, Segura J-M, Piguet J, Vogel H, Ba¨umle M (2006) Single
Molecule Detection with Atto 647N NTA. BioFiles: Sigma Aldrich. Available: http://www.sigmaaldrich.com/technical-documents/articles/biofiles/single-molecule-detection.html. Accessed 2012 Aug 31.
46. Sofia SJ, Premnath VV, Merrill EW (1998) Poly(ethylene oxide) Grafted to Silicon Surfaces: Grafting Density and Protein Adsorption. Macromolecules 31: 5059–5070.
47. Harris JM, Zalipsky S (1997) Poly(ethylene glycol): Chemistry and Biological Applications. ACS Symposium Series 680.
48. Zhu J (2010) Bioactive modification of poly(ethylene glycol) hydrogels for tissue engineering. Biomaterials 31: 4639–4656.
49. Wattendorf U, Merkle HP (2008) PEGylation as a tool for the biomedical engineering of surface modified microparticles. Journal of pharmaceutical sciences 97: 4655–4669.
50. Nakao A, Nagaoka S, Mori Y (1987) Hemocompatibility of hydrogel with polyethyleneoxide chains. J Biomater Appl 2: 219–234.
51. Tessmar JK, Go¨pferich AM (2007) Customized PEG-derived copolymers for tissue-engineering applications. Macromol Biosci 7: 23–39.
52. Graf J, Ogle RC, Robey FA, Sasaki M, Martin GR, et al. (1987) A pentapeptide from the laminin B1 chain mediates cell adhesion and binds the 67,000 laminin receptor. Biochemistry 26: 6896–6900.
53. Taite LJ, Yang P, Jun HW, West JL (2008) Nitric oxide-releasing polyurethane-PEG copolymer containing the YIGSR peptide promotes endothelialization with decreased platelet adhesion. Journal of biomedical materials research Part B, Applied biomaterials 84: 108–116.
54. Lidke DS, Nagy P, Heintzmann R, Arndt-Jovin DJ, Post JN, et al. (2004) Quantum dot ligands provide new insights into erbB/HER receptor-mediated signal transduction. Nature biotechnology 22: 198–203.
55. Schneider CA, Rasband WS, Eliceiri KW (2012) NIH Image to ImageJ: 25 years of image analysis. Nature Methods 9: 671–675.
56. Clarke DT, Botchway SW, Coles BC, Needham SR, Roberts SK, et al. (2011) Optics clustered to output unique solutions: a multi-laser facility for combined single molecule and ensemble microscopy. The Review of scientific instruments 82: 093705.
57. Holtzer L, Schmidt T (2009) The Tracking of Individual Molecules in Cells and Tissues. In: Brauchle C, Carrol Lamb D, Michaelis J, editors. Single Particle Tracking and Single Molecule Energy Transfer: Wiley. 25–42.
58. Kyte J, Doolittle RF (1982) A simple method for displaying the hydropathic character of a protein. J Mol Biol 157: 105–132.