EVIDENCE ON THE NEXUS BETWEEN ELECTRICITY
CONSUMPTION AND ECONOMIC GROWTH
THROUGH EMPIRICAL INVESTIGATION OF UGANDA
Lira PETER SEKANTSI*, Mamofokeng MOTLOKOA**
Abstract This paper empirically examines the electricity consumption
-economic growth nexus in Uganda for the period 1982 to 2013, with a view to contributing to the body of literature on this topic and informing energy policy design in Uganda. Using capital stock as an intermittent variable in the causality framework, the paper employs Johansen-Juselius (1988, 1995) multivariate cointegration and VECM based Granger causality tests and finds a bidirectional causality between electricity consumption and economic growth in the long-term and distinct causal flow from economic growth to electricity consumption in the short-run, and short-term and long-term Granger causality from capital stock to economic growth, with short-run feedback in the opposite direction. Therefore, it implies that firstly, the Government of Uganda (GoU) can implement conservation policies only through reducing energy intensity and promoting efficient energy use to avoid decline in output and secondly, that the GoUshould intensify its efforts towards capital accumulation in order to realize sustainable economic growth. Lastly, the empirical evidence that electricity consumption influences some short-term capital accumulation supports the GoU’s efforts to allow private sector investment in the electricity sector in an effort to increase electricity supply.
Keywords: Electricity Consumption, Economic Growth, Multivariate
Cointegration and Granger Causality
JEL Classification Codes: C22, Q43, Q48
1
I
NTRODUCTIONElectricity as a form of energy is considered to be one of the essential driving forces of economic growth in all economies, which directly and indirectly
*
Lira SEKANTSIAND, Economist, Research Department, Central Bank of Lesotho, P.O.Box1184, Maseru 100, Lesotho, Email:skantsy@hotmail.co.uk
**
complements labour and capital as inputs in the production process (see Pokharel, 2006 and Mulugeta, etal, 2010). It contributes to economic growth through employment generation, and leads directly to value addition associated with extraction and transformation of inputs, technology transfers, marketing and distribution of goods and services. It also reinforces modernization of traditional economic sectors and assists in continuous expansion of secondary and tertiary sectors of the economy, in addition to improving the quality of life of individuals, particularly through heat, light and use of electrical appliances. However, in recent years many countries, particularly in Africa, have been facing serious energy (or electricity) deficiency and have been unable to meet the increasing demand for electricity. In addition to reducing the extent to which countries benefit from the above positive effectsthe shortage in electricity supply consequently raises input prices and prices of other commodities. This in turn contributes to higher overall inflation and dampens aggregate demand and economic growth (Abosedra at al, 2015 and Ouèdraogo, 2010).
The issue of the relationship (and hence direction of causality) between electricity consumption (sometimes used as a proxy for energy more broadly) and economic growth has been a subject of inquiry in economic literature. This is on account of the important policy implications that can be derived from this relationship regarding the course of action that can be done to accelerate economic growth. In spite of a wide discussion in the literature, the issue of the direction of causality between electricity consumption and economic growth still remains ambiguous. This ambiguity is attributed to the use of different data sets, different methods of analysis and different country characteristics (Adom, 2011). In addition, some studies have over-relied on a bivariate causality framework, which may suffer from the omission of variable bias. This is because incorporating the third variable that affects both electricity consumption and economic growth may change not only the direction of causality between the two variables but also the magnitude of the estimates.
agro-processing and telecommunication) and commercial sector2, as well as residential
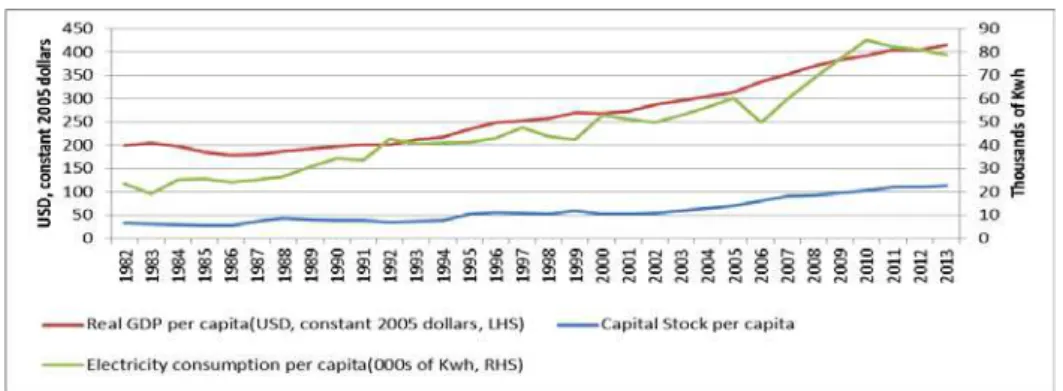
sector (see Shelagh and Tumushabe, 2014).Historical data is shown in Figure 1 in the appendices for the electricity consumption (measured in thousands kWh per capita), economic growth (measured by real GDP per capita) and capital stock per capita (measured by gross fixed capital formation per capita) in Uganda, which all trend upwards over the period 1982 to 20133. In addition, these three variables are
highly and positively correlated (see Table 1 in the appendices) suggesting the existence of causality between them.
To investigate the Granger-causality relationship, the authors follow the techniques employed by Odhiambo (2010) who analyzes the direction of causality between the two variables using a trivariate model. In this paper, the authors use capital stock as the third variable that relates to both electricity consumption and economic growth in the same way as Shahbaz et al(2012). This is plausible since capital stock includes electricity infrastructure which affects overall electricity consumption4.
The rest of the paper is organized as follows: Section 2 provides a brief overview of the electricity sector in Uganda, section 3 briefly reviews the literature; section 4 describes the data and presents the analytical framework; section 5 discusses the empirical results and section 6 concludes.
2
A
NO
VERVIEW OF THEE
LECTRICITYS
ECTOR INU
GANDAUganda is landlocked and resource-rich, yet remains one of the poorest countries globally (in terms GDP per capita) and ranks very low in terms of the Human Development Index (KPMG East Africa Limited, 2013). It has recorded robust economic growth over the last decade. However, in the past two years growth has slowed due to increased financing needs, corruption and inability to address major constraints to economic growth, especially in relation to affordable and reliable energy sources (Shelagh and Tumushabe, 2014). It is endowed with a wide range of natural energy resources such as biomass (fuel wood and charcoal), water and peat, as well as favourable conditions for solar, wind and geothermal power generation. In spite of this, the country’s energy sector remains underdeveloped and characterized by low access and coverage by international and
2Note that these sectors are also capital intensive.
3However, capital stock trends at relatively lower rate than the rest of the series.
4There might be other variables in the same boat as capital stock; in particular labour or employment
regional standards. For example, approximately 85-90 percent of the country’s population lacks access to electricity, and over 90 percent of the rural population depends on biomass for energy. In terms of consumption levels, the bulk of electricity in the economy is used by industrial and commercial sectors while only 30 percent is used by residential sector (Sustainable Energy for ALL, 2012).
The electricity sector in Uganda has been characterized by chronic supply shortages and persistent as well as unpredictable load shedding (rolling blackouts) due to insufficient power generation and underinvestment in energy infrastructure. Moreover, the government’s energy policy hasfocused more on the development of large hydropower schemes (which can take many years to commission), which has resulted in partial neglect of the potential of the country’s extensive small-scale hydro and biomass energy sources for power generation.Climate change impacts such as droughts and erratic rainfalls have undermined hydropower generation, contributing to supply shortages. Furthermore, theformerstate-owned Uganda Electricity Board (UEB) has suffered from low revenue collection and poor operational and financial performance due to inefficient tariff structures and subsidies, which to a certain extent encouraged wasteful use of electricity by consumers, therebyaggravating supply insufficiency (Shelagh and Tumushabe, 2014).
electricity generation and distribution. The Government of Uganda (GoU) has also established the Rural Electricity Agency (REA) to promote grid and off-grid private sector-led rural electrification. It has also collaborated with the East African Community (EAC) on regional power interconnection. These reforms have so far improved power systems planning, professionalism and financial transparency as well as mobilizing substantial private resources for investment in the sector so that private operators are now dominant in electricity generation and distribution. Nonetheless, this may change after 2018, when a number of large hydro projects undertaken by Chinese state-owned enterprises are scheduled for completion.(See Shelagh and Tumushabe, 2014 and Tumwesigye et al, 2011).
3
L
ITERATURER
EVIEWFollowing the seminal work of Kraft and Kraft (1978), numerous studies in the literature have widely examined the direction of the causal relationship between electricity (sometimes used as a proxy for energy more broadly) consumption and economic growth, and its policy implications based on four main hypotheses, namely; growth, conservation, feedback and neutrality hypotheses. The growth hypothesis states that the economy depends on energy consumption for economic growth so that the more energy the economy consumes, the more the economy will grow. Hence energy consumption drives economic growth. In this case, any energy shortage or supply interruption will have a negative effect on economic growth. Under this hypothesis, electricity (or energy) conservation measures aimed at reducing energy consumption may negatively affect economic growth. This hypothesis is supported by studies that find unidirectional causal flow from energy consumption (or electricity consumption) to economic growth (see Odhiambo, 2009a; Narayan and Singh, 2007; Narayan and Smyth, 2008; Narayan and Prasad, 2008; Altinay and Karagol, 2005and Wolde-Rufael, 2004).
consumption. These studies include Kwakwa (2012), Narayan and Smyth (2005), Adom (2011), Mozumder and Marathe (2007) among others.
The feedback hypothesis postulates that energy consumption and economic growth are interrelated and may complement each other. In this case, efficient energy use and energy development policies geared toward increasing electricity generation can impact positively on economic growth. This hypothesis is supported by empirical studies that find bidirectional causality between energy (or electricity) consumption and economic growth. These studies include Aslan(2014), Odhiambo (2009b), Tang (2008), and Masih and Masih (1997).
Finally, the neutrality hypothesis states that there is no causal relationship between energy consumption and economic growth. This hypothesis would imply that neither conservative nor expansive policies in relation to energy consumption have any effect on economic growth. This hypothesis was empirically supported by the works of Payne (2009), Akarca and Long (1980), Yu and Hwang (1984) and Cheng (1995), among other studies.
4
D
ATA ANDA
NALYTICALT
ECHNIQUES4.1 Data Types and Sources
This paper uses annual time series data for Uganda covering the period from 1982 to 2013. The data used as a proxy for economic growth is real GDP per capita (US$, 2005 constant prices). Capital stock is proxied by gross fixed capital formation (US$ 2005 constant prices). Data for these two series was obtained from the World Bank Economic Indicators (WEI) database. Lastly, data on electricity consumption per capita (measured in thousands of kWh per capita) was obtained from Uganda Bureau of Statistics (UBOS). For analysis, the data series are transformed into natural logarithms5 and denoted by the variable names 𝐿𝑅𝐺𝐷𝑃,𝐿𝐾 and 𝐿𝐸𝐶, respectively.
4.2 Cointegration
This paper employs the Johansen-Juselius (1988, 1995) multivariate cointegration procedure to test for long-run relationships between electricity consumption, capital stock and economic growth in Uganda. This technique requires variables to be integrated to the same order, therefore, prior to testing for cointegration between the variables; the paper investigates the presence of unit roots among the variables using Augmented Dickey-Fuller (ADF) and
Perron (PP) unit root tests. If the variables are found to be integrated to the same order, the maximum likelihood estimation of the unrestricted vector autoregression (VAR) model is estimated to determine the existence of cointegration between the variables. The lag length is chosen on the basis of Schwarz-Bayesian information criterion (BIC) and Akaike information criterion (AIC) while the cointegrating rank is determined by means of the trace and maximum eigen value likelihood ratio test statistics.
4.3 Granger Causality Test
According to Granger (1969 and 1988) the existence of cointegration between the variables may imply the existence of causality between the variables at least in one direction. Therefore, the paper employs the Granger causality test based on the vector error correction model (VECM) framework to determine the short-run and long-run causal effects between electricity consumption and economic growth6. However, in an attempt to avoid unreliable results on account of
omission of variable bias inherent in the bivariate causality framework (see Odhiambo, 2010 and Shahbaz et al,2012), this paper adopts a trivariate causality framework, which includes capital stock as an additional intermittent variable7.In
this regard, the trivariate vector error correction model within which Granger causality is examined is specified, as follows.
∆𝐿𝐸𝐶=𝛼0+� 𝛼1𝑖
𝑛
𝑖=1
∆𝐿𝐸𝐶𝑡−𝑖+� 𝛼2𝑖 𝑛
𝑖=0
∆𝐿𝐾𝑡−𝑖
+� 𝛼3𝑖∆𝐿𝑅𝐺𝐷𝑃𝑡−𝑖+
𝑛
𝑖=0
𝛼4𝐸𝐶𝑇𝑡−1+𝜀𝑡
(1)
∆𝐿𝐾 =𝜑0+� 𝜑1𝑖
𝑛
𝑖=1
∆𝐿𝐾𝑡−𝑖+� 𝜑2𝑖 𝑛
𝑖=0
∆𝐿𝐸𝐶𝑡−𝑖+� 𝜑3𝑖 𝑛
𝑖=0
∆𝐿𝑅𝐺𝐷𝑃𝑡−𝑖
+𝜑4𝐸𝐶𝑇𝑡−1+𝑣𝑡
(2)
6Granger causality is preferred over other methods owing to its favorable response in both large and
small samples.
7According to Odhiambo (2010), the addition of this variable may not only affect the magnitude of
∆𝐿𝑅𝐺𝐷𝑃=𝛽0+� 𝛽1𝑖∆𝐿𝑅𝐺𝐷𝑃𝑡−𝑖
𝑛
𝑖=1
+� 𝛽2𝑖
𝑛
𝑖=0
∆𝐿𝐾𝑡−𝑖+� 𝛽3𝑖∆𝐿𝐸𝐶𝑡−𝑖 𝑛
𝑖=0
+𝛽4𝐸𝐶𝑇𝑡−1+𝑢𝑡
(3)
where 𝐸𝐶𝑇𝑡−1is the lagged error correction term derived from the long-run cointegrating relationship 𝜀𝑡, 𝑣𝑡and 𝑢𝑡 are mutually uncorrelated white noise residuals, and the𝛼′𝑠, 𝜑′𝑠and 𝛽′𝑠are corresponding adjustment coefficients. In this test, the short-run causality is captured by the significance of the 𝐹 –statistics and𝑡 −statistics on the explanatory variables. On other hand, the long-run causality is captured by the significance of the 𝑡 −statistic on the coefficient of the lagged error correction term. Nevertheless, if there is no cointegration between the variables, equations (1), (2) and (3)are estimated without the error correction term and only short-run causality direction can be determined through F-test of significance of the explanatory variables.
5
E
MPIRICALA
NALYSIS5.1 Unit root test
In the first stage, the order of integration of the variables is investigated by employing the standard ADF and PP unit root tests. Table 2 presents the results of ADF and PP unit root tests.vAlthough not presented here, unit root test results on levels of the variables show that electricity consumption, capital stock and economic growth are non-stationary. However, when first differences of the variables are taken, the ADF and PP unit root reject the null hypothesis of non-stationarity for the three variables at the 10 per cent level of significance8. Therefore, the paper concludes that
electricity consumption, capital stock and economic growth are integrated of order one,𝐼(1),vand hence might be cointegrated.
Table2: ADF and PP Unit Root Test Results (at first differences)
Variable ADF Statistic PP Statistic
∆LEC −8.0156(0.000)∗∗∗ −11.5301(0.000)∗∗∗
∆LK −4.2758(0.0105)∗∗ −6.4230(0.0001)∗∗∗
∆LRGDP −2.9447(0.052)∗ −3.3363(0.079)∗
Note: Values in parenthesis are p-values while ***, **and * indicate significance at 1 percent, 5 percent and 10 percent, respectively.
5.2 Cointegration test
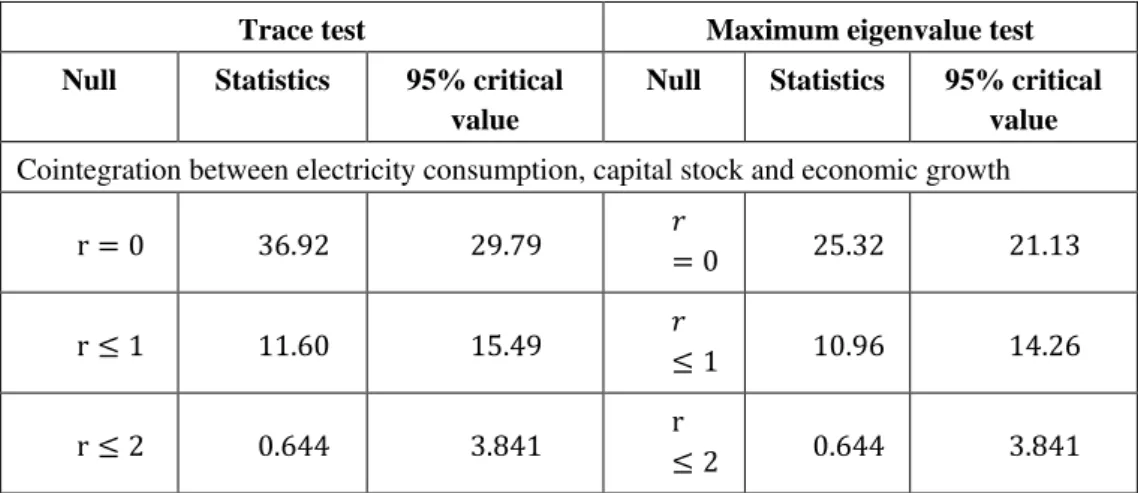
Given that all the variables included in the analysis are𝐼 (1), the next stage is to use the Johansen-Juselius (1988, 1995) multivariate cointegration to test for the existence of long-run relationship between them. However, the results of this cointegration procedure depend on the number of lags included in the VAR model, which must therefore be determined beforehand. The number of lags used must seek to ensure that the errors are approximately white noise, while maintaining enough degrees of freedom for estimation. This paper does so by using BIC and AIC criteria, and finds that the appropriate lag length is one. Table 3 reports the trace and maximum eigen value tests for cointegration among electricity consumption, capital stock and economic growth.
Table3: Results ofJohansen Trace and Maximum Eigenvalue tests for cointegration
Trace test Maximum eigenvalue test
Null Statistics 95% critical value
Null Statistics 95% critical value
Cointegration between electricity consumption, capital stock and economic growth
r = 0 36.92 29.79 𝑟
= 0 25.32 21.13
r≤1 11.60 15.49 𝑟≤
1 10.96 14.26
r≤2 0.644 3.841 r
≤2 0.644 3.841
Note:1) r stands for the number of cointegrating vectors
These tests show that the null hypothesis of no cointegration against the alternative hypothesis of at most one cointegrating vector is rejected at 5 percent level of significance. Therefore, there exists one cointegrating vector relating electricity consumption, capital stock and economic growth.
5.3 Analysis of Granger Causality Test
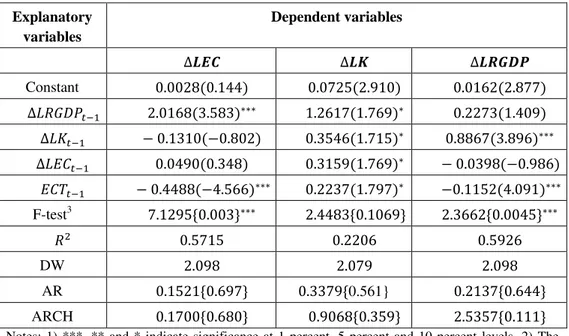
growth in the context of a VECM framework. Table 4 reports the results of Granger causality test based on the estimated VECM.
Table4: Results of VECM Granger Causality Test
Explanatory variables
Dependent variables
∆𝑳𝑬𝑪 ∆𝑳𝑲 ∆𝑳𝑹𝑮𝑫𝑷
Constant 0.0028(0.144) 0.0725(2.910) 0.0162(2.877)
∆𝐿𝑅𝐺𝐷𝑃𝑡−1 2.0168(3.583)∗∗∗ 1.2617(1.769)∗ 0.2273(1.409)
∆𝐿𝐾𝑡−1 − 0.1310(−0.802) 0.3546(1.715)∗ 0.8867(3.896)∗∗∗
∆𝐿𝐸𝐶𝑡−1 0.0490(0.348) 0.3159(1.769)∗ − 0.0398(−0.986)
𝐸𝐶𝑇𝑡−1 − 0.4488(−4.566)∗∗∗ 0.2237(1.797)∗ −0.1152(4.091)∗∗∗
F-test3 7.1295{0.003}∗∗∗ 2.4483{0.1069} 2.3662{0.0045}∗∗∗
𝑅2 0.5715 0.2206 0.5926
DW 2.098 2.079 2.098
AR 0.1521{0.697} 0.3379{0.561} 0.2137{0.644}
ARCH 0.1700{0.680} 0.9068{0.359} 2.5357{0.111}
Notes: 1) ***, ** and * indicate significance at 1 percent, 5 percent and 10 percent levels. 2) The numbers in parentheses ( ) are 𝑡-statistics and numbers in parentheses { } are probability values.3) The F-test measures the joint significance of the independent differenced variables;
for example in the case of the equation for ΔLEC the explanatory variables are ΔLRGDPt-1, ΔLKt-1and ΔLECt-1
consistent with Sekantsi (2014) for the case of Uganda9, Aslan(2014) for the case
Turkey, Odhiambo (2009b)for the case of South Africa, and Raza et al (2015) for the case of Pakistan.
This finding is pertinent given that the industrial and commercial sectors, which consume much electricity ,also contribute significantly to economic growth because electricity availability to those sectors might influence their production levels and consequently increase output in the economy. The industrial sector (especially manufacturing, agro-processing and telecommunication) and commercial sector in Uganda currently consume about 70 percent of electricity, and during the period 2008-2012 manufacturing and agro-processing industries contributed 47.0 percent on average to Uganda’s GDP, while the manufacturing sector and telecommunication industry collectively contributed on average 27.2 percent in the same period (UBOS, 2013). Thus, one can infer that electricity consumption plays an important role in determining the level economic activity.
In terms of causality running in the opposite direction, Uganda experienced robust economic growth over the last decade due to increased economic activities in financial services, manufacturing and telecommunication, construction, transportation and energy infrastructure. This growth, and associated increased investment, has led to expansion in industrial (especially manufacturing, agro-processing and telecommunication) and commercial sectors, whose demand for electricity has been increasing gradually (Shelagh and Tumushabe, 2014). In addition, in recent years the advancement of the Ugandan economy due to economic growth has witnessed inter-fuel substitution from conventional sources of fuel such as biomass, paraffin and oil to electricity in different sectors of the economy. In particular, higher
disposable incomes received by households,
particularly in urban areas, have increased their demand for electrical
appliances for heating, cooking, lighting, recreation and comfort
(Shelagh and Tumushabe, 2014).Given these circumstances, it is also reasonable to expect economic growth to stimulate electricity consumption in the economy gradually. However, the existence of no short-run causal flow from electricity consumption to economic growth might be due to the fact that the low electricity access and persistent load shedding as a result of small electricity sector in Uganda often cause major disruptions to households, businesses and industry (Keibbiehl and Miltner, 2013) and hinder broader investment as well as negatively affecting the country’s
9 The main difference between this paper and Sekantsi (2014) is that this paper includes capital stock
competitiveness and thereby inhibiting economic growth (see Sustainable Energy for ALL, 2012 and Shelagh and Tumushabe, 2014).
From a policy perspective, the verification of bidirectional causality between electricity consumption and economic growth in Uganda has important policy implications for the GoU. They imply that electricity conservation policies have the potential toretard economic growth. Therefore, the GoU should develop energy or environmental policies aimed to reduce energy consumption only through reducing energy intensity and promoting efficient energy use to avoid decline in output. More specifically, the GoU should consider a variety of policies, such as the rationalization of tariff structures and subsidies, efficiency improvement measures, as well as demand management policies aimed at reducing wasteful use of electricity by consumers. These policies offer certain advantages; not only are they cheaper than production but they also avoid the environmental costs associated with additional electricity generation (see Gosh, 2002). In addition, the GoU should also be expanding energy infrastructure to address increased electricity demand to support economic growth.
The empirical results also indicate short-run and long-run causal flow from capital stock to economic growth, which may feed back into capital stock in the short-run. The short-run and long-run causality from capital stock to economic growth are supported by the statistically significant coefficient of capital stock (and F-test) and the statistically significant coefficient of the lagged error correction term at 1 percent level of significance10 in the economic growth function,
respectively. This finding is consistent with Misztal (2010), who finds that fixed capital formation highly explains GDP variances both in the short- and long-run in Romania, and provides evidence of investment-led growth. This suggests that capital accumulation drives at least some of the short-term and long term economic growth in Uganda. This empirical evidence supports the Harrod-Domarmodels and new growth theories, which reconfirm the view that investment is an engine of long-run economic growth (see Barro, 1990; Lucas, 1988 and Romer, 1986). This is because capital accumulation creates production facilities and stimulates economic activities, reduces transaction and trade costs and thereby improving the country’s competitiveness as well as providing employment opportunities to the poor (see Sahoo et al, 2010). Hence policymakers in Uganda should formulate macroeconomic policies aimed at enhancing capital investment in order to achieve higher and sustainable economic growth. The finding of short-run feedback causality between capital stock and economic growth is consistent with Shahbaz,et
al(2012) and Ouédraogo(2010) but contrasts with that of Blomström et al(1996) who argue that causality between the two variables could come from either economic growth or capital investment. It implies that in the short-run economic growth and capital accumulation mutually influence each other, which suggests that high levels of capital accumulation lead to high levels of economic growth and vice versa. This may occur due to the fact that higher levels of economic growth can support more capital accumulation.
Lastly, the existence of short-run causal flow from electricity consumption to capital stock is implied by the significance of the coefficient of electricity consumption in the capital stock function. This weak causality suggests that increased demand for electricity influences some short-term capital investment, particularly investment in electricity infrastructure which affects overall electricity consumption. This result is consistent with Masuduzzaman (2012). This is relevant given that due to increased demand for electricity by different sectors in the economy, the GoU has undertaken measures to increase electricity generation and distribution through private sector investment in the electricity sector. Therefore, this finding implies that policymakers in Uganda should continue to encourage private sector investment in the electricity sector. This policy measure will not only provide much needed private capital in the electricity sector but also foster competition in the sector, providing increased scope for consumer choice (see Shelagh and Tumushabe, 2014).
6
C
ONCLUSIONof industrial and commercial sectors, whose demand for electricity has been increasing gradually. This has important consequences for electricity conservation policies as GoU has embarked on an extensive power-sector reform programme aimed at narrowing the electricity demand-supply gap in the country. The results suggest that the GoU can implement conservation policies only through reducing energy intensity and promoting efficient energy use to contain growth of demand for electricity in order to avoid decline in output. Such measures are not only cheaper than production but also avoid the environmental costs associated with additional electricity generation.
In addition, the findings of short-run and long-run causal flow from capital accumulation to economic growth support investment-led growth, which suggests that capital investment drives at least some level of short-term and long term economic growth. This may be due to the ability of capital investment to create production facilities and stimulate economic activity, as well as providing employment opportunities to the poor in Uganda. Therefore, the GoU should intensify its efforts towards capital accumulation in order to realize sustainable economic growth. The analysis also shows short-run bidirectional causality between capital stock and economic growth, implying that in the short-run economic growth and capital accumulation mutually influence each other. Lastly, the finding of short-run causal flow from electricity consumption to capital stock supports the GoU’s efforts to increase private sector participation in electricity generation and distribution with ultimate intention to increase electricity supply.
A
CKNOWLEDEGEMENTSThe authors wish to express their deepest appreciation to Mr. Michael Wulfsohn, Overseas Development Institute (ODI) fellow engaged as an Economist at the Central Bank of Lesotho, for his useful comments in writing this paper.
R
EFERENCES1. Abosedra,S., Shahbaz,M. and Sbia,R. (2015). The Link between Energy Consumption, Financial Development and Economic Growth in Lebanon: Evidence from Cointegration with Unknown Structural Breaks. Journal of Energy, 1-15.
2. Adom, P.K. (2011) . Electricity Consumption-Growth Nexus: The Ghanaian Case. International Journal of Energy Economics and Policy.1 (1): 18-31.
3. Akarca, A.T., Long, T.V.(1980). On the Relationship between Energy and GNP: a Reexamination. Journal of Energy Development, 5:326–331.
5. Aslan, A. (2014). Causality between Electricity Consumption and Economic Growth in Turkey: An ARDL Bounds Testing Approach. Energy Sources, Part B: Economics, Planning, and Policy, 9(1):25-31.
6. Barro, R.J. (1990). Government Spending in a Simple Model of Endogenous Growth. Journal of Political Economy 98:S103-S125
7. Bloström, M., Lipsey, R.E. and Zejan, M.(1996) . Is Fixed Investment key to Economic Growth? Quartely Journal of Economics, 111(1): 269-276.
8. Cheng, B.S. (1995). An Investigation of Cointegration and Causality between Energy Consumption and Economic Growth. Journal of Energy and Development,21: 73–84. 9. Fatai,K., Oxley,L., and Scrimgeour,F.(2001). Modeling the Causal Relationship
between Energy Consumption and GDP in New Zealand, Australia, India, Indonesia, The Philippines and Thailand. MODSIM 2001, Australia National University,Canberra. 10. Gosh,S. (2002). Electricity Consumption and Economic Growth. Energy Policy,30:125-129. 11. Granger, C.W.J. (1988). Causality, Cointegration, and Control.Journal of Economic
Dynamics and Control, 12:551-559.
12. Granger, C.W.J. (1969) . Investigating Causal Relations by Econometric Models and Cross-spectral Methods. Econometrica, 37(3): 424-438.
13. Johansen, S. (1988) . Statistical Analysis of Cointegration Vectors. Journal of Economic Dynamic and Control,12: 231-254.
14. Johansen, S. (1995) . Likelihood-Based Inference in Cointegrated Vector Autoregressive Models.Oxford: Oxford University Press.
15. Keibbiehl,S. and Miltner, S.(2013).GET FIT in Uganda: Observations and Open Issues from a Financial Perspective. Frankfurt: Deutsche Bank.
16. KPMG East Africa Limited. (2013). Uganda’s Snapshot 2013 Q2. Kampala: KPMG. 17. Kraft, J. and Kraft, A. (1978). On the Relationship between Energy and GNP. Journal
of Energy Development, 3:401-403.
18. Kwaka,P.A.(2012) . Disaggregated Energy Consumption and Economic Growth in Ghana. International Journal of Energy Economics and Policy,2( 1): 34-40.
19. Lucas. (1988). On the Mechanics of Economic Development. Journal of Monetary Economics,22: 2-42
20. Misztal, P. (2010). Foreign Direct Investment as a Factor for Economic Growth in Romania. Review of Economic and Business Studies, 3(1): 39-53.
21. Mulugeta, S.K., Nondo, C., Schaeffer, P.V., and Gebremedhin, T.G. (2010). Does Level of Income atter in the Energy Consumption and GDP Nexus?:Evidence from Sub-saharan African Countries.Research Paper,No 3, Research Institute:West Virginia University.
22. Masih, A.M.M. and Masih, R. (1997).On the Temporal Causal Relationship between Energy Consumption, Real Income, and Prices: Some new Evidence from Asian-energy Dependent NICs based on a Multivariate Cointegration/Vector Error-correction Approach. Journal of Policy Modeling, 19: 417-440.
23. Masuduzzaman,M.(2012). Electricity Consumption and Economic Growth in Bangladesh: Cointegration and Causality Analysis. Global Journal of Management and Business Research,12(11):46-56.
25. Narayan, P.K. and Prasad, A. (2008).Electricity Consumption-Real GDP Causality Nexus: Evidence from a Bootstrapped Causality Test for 30 OECD Countries. Energy Policy, 36:910-918.
26. Narayan, P.K. and Singh, B. (2007).The Electricity Consumption and GDP Nexus for the Fiji Islands. Energy Economics, 29: 1141-1150.
27. Narayan, P.K. and Smyth, R. (2005).Electricity Consumption, Employment and Real Income in Australia:Evidence from Multivariate Granger Causality tests. Energy Policy, 33: 1109-1116.
28. Odhiambo, N.M. (2009a) .Energy Consumption and Economic Growth nexus in Tanzania: An ARDL Bounds Testing Approach. Energy Policy, 37, 617-622.
29. Odhiambo, N.M. (2009b). Electricity Consumption and Economic Growth in South Africa: A trivariate Causality test. Energy Economics, 31: 635-640.
30. Odhiambo,N. M.(2010).Electricity Consumption, LabourForce Participation rate and Economic Growth in Kenya: an Empirical Investigation. Problems and Perspectives in Management,8(1):31-38.
31. OuédraogoI,M.(2010). Electricity Consumption and Economic Growth in Burkina Faso: A Cointegration Analysis. Energy Economics,32:524-531.
32. Payne, J.E. (2009) .On the Dynamics of Energy Consumption and Output in the US. Applied Energy, 86: 575-577.
33. Pokharel,S.H.(2006). An Econometrics Analysis of Energy Consumption in Nepal. Energy Policy,1-12.
34. Romer, P.M. (1986). Increasing Returns and Long-run Growth. Journal of Political Economy,94:1002-37.
35.Sahoo,P., Dash,R.K. and Nataraj,G.(2010). Infrastructure Development and Economic Growth in China. Institute of Developing Economies Discussion Paper,No.261.
36. Sekantsi,L. and Okot,N.(2014). Electricity Consumption-Economic Growth Nexus in Uganda. Energy Sources, Part B Economics, Planning and Policy(Forthcoming). 37. Shahbaz, M., Mutascu,M. and Tiwari, A.K.(2012).Revisiting the Relationship between
Electricity Consumption, Capital and Economic Growth: Cointegration and Causality Analysis in Romania . Romanian Journal of Economic Forecasting, 3:97-120.
38. Shelagh W., and Tumushabe G. (2014). Mapping Current Incentives and Investment in Uganda's Energy Sector: Lessons for Private Climate Finance. Acode Uganda, Working Paper, No 04/04/14.
39. Sustainable Energy for ALL.( 2012). Energy Rapid Assessment and Gap Analysis -Uganda Final Draft. Kampala: Minitry of Environment and Mineral Development. 40. Raza, S.A., Shahbaz,M. and Nguyen,D.K.(2015). Energy Conservation Policies,
Growth and Trade Performance: Evidence of Feedback Hypothesis in Pakistan. Energy Policy, 80, 1-10.
41. Tang, C.F. (2008).A Re-examination of the Relationship between Electricity Consumption and Economic Growth in Malaysia. Energy Policy, 36:3077-3085.
42. Tumwesigye, R., Twebaze,P., Makuregye,N. and Muyambi,E.(2011). Key Issues in Uganda’s Energy Sector. London: Interenational Institute for Environment and Development.
43. Uganda Bureau of Statistics.2013. Statistical Abstract.Published on the web at:
44. Wolde-Rufael, Y., 2004. Disaggregated Energy Consumption and GDP: the Experience of Shanghai, 1952–99. Energy Economics. 26:69–75.
45. Yu, E.S.H. and Hwang, B.K.(1984). The Relationship between Energy and GNP: Further results. Energy Economics,6:186–1990.
A
PPENDIXFigure 1: Trend in Annual ElectricityConsumption per-capita, Capital Stock per capita and RealGDP per-capita in Uganda during the period 1982 – 2013. Source: World Economic Indicators& Uganda Bureau of Statistics
Table 1 The Correlation Matrix for Electricity Consumption per Capita, Capital Stock per Capita and Real GDP per Capita.
Variable Electricity
Consumption
Capital Stock Economic growth
Electricity Consumption 1
Capital Stock 0.9444 1
Economic growth 0.9577 0.9809 1