Working
Paper
352
Evidence of eligibility manipulation for
conditional cash transfer programs
Sergio Firpo
Renan Pieri
Euclides Pedroso Jr.
André Portela Fernandes
CMICRO - Nº 26
Working Paper Series
WORKING PAPER 352 –CMICRO Nº 26• DEZEMBRO DE 2013 • 1
Os artigos dos Textos para Discussão da Escola de Economia de São Paulo da Fundação Getulio
Vargas são de inteira responsabilidade dos autores e não refletem necessariamente a opinião da FGV-EESP. É permitida a reprodução total ou parcial dos artigos, desde que creditada a fonte.
Escola de Economia de São Paulo da Fundação Getulio Vargas FGV-EESP
Evidence of eligibility manipulation for
conditional cash transfer programs
Sergio Firpo
C-Micro - FGV, Escola de Economia de São Paulo (EESP) - FGV, Brazil and IZA
Renan Pieri
C-Micro - FGV, Escola de Economia de São Paulo (EESP) - FGV, Brazil
Euclides Pedroso Jr.
Escola de Economia de São Paulo (EESP) - FGV, Brazil
André Portela Souza*
C-Micro - FGV, Escola de Economia de São Paulo (EESP) - FGV, Brazil
October 2013
Abstract
This paper assesses whether eligibility for conditional cash transfer programs have been manipulated, as well as the impact of this phenomenon on time allocation within households. To perform this analysis, we use data from the 2006 PNAD (Brazilian national household survey) and investigate the eligibility manipulation for the Bolsa Família (Family Stipend) program during this time period. The program assists families
with a monthly per capita income of around R$120.00 (US$60.00). By applying the tests developed by McCrary (2008), we find suggestive evidence that individuals manipulate their income by voluntarily reducing their labor supply in order to become eligible to the program. Moreover, the reduction in labor supply is greater among women, especially single or divorced mothers. This evidence raises some concern about the unintended consequences related to the eligibility criteria utilized by Bolsa Família,
as well as the program’s impact on individuals living in extreme poverty.
KEYWORDS: Conditional Cash Transfers; Brazilian Bolsa Família; Regression
Discontinuity; Eligibility Manipulation JEL CODES: I38; O15
* Corresponding author: Sao Paulo School of Economics, Getulio Vargas Foundation, Rua Itapeva 474, 12 andar, sala
1. Introduction
Brazil is a country known to have a high level of income inequality with a Gini coefficient of per capita household income of approximately 0.54 (IPEADATA, 2013). Aside from this factor, Brazil also has significant levels of both poverty and extreme poverty. In 2009, about 21.4% and 7.3% of the population was poor and extremely poor, respectively (IPEADATA, 2013).
In order to help combat this poverty, a conditional cash transfer program–the
Bolsa Família Program (PBF)1–was created in 2004. The goal of the program was to
increase the income level of economically underprivileged subpopulations, as well as generate direct incentives for children to improve their education and health outcomes. By 2013, there were around 14 million families participating in the program, encompassing more than 50 million individuals. The total value of the cash transfers reached more than 0.5% of the Brazilian Gross Domestic Product (GDP).
According to Barros et al. (2006c), public transfers have accounted for the major
source of non-work related income in the past few years. Some studies, such as those by Barros et al. (2006c), Soares et al. (2006), and Cury et al. (2009), find that the PBF has
had a positive impact PBF on the reduction of income inequality and poverty in Brazil. Ferro and Kassouf (2003), Cardoso and Souza (2004), Bourguignon et al. (2004), and
Glewwe and Kassouf (2012) note the positive effect that conditional cash transfer programs have on increasing the school attendance of children whose families are beneficiaries.
However, since per capita household income is one of the eligibility criteria for the PBF, the program may have adverse effects on agents’ labor supply. For example, individuals with incomes slightly higher than the maximum level for participation in the program would be encouraged to reduce their labor supply in order to meet the eligibility criteria.
Manipulation of income may shift the focus away from the subpopulation of interest, for which the benefit is badly needed. Data for 2012 show that there were 16.2 million people in Brazil with a monthly income per capita less than R$70.00, which is the of extreme poverty line (World Bank, 2013). Hence, if non-eligible individuals
1 Throughout the paper we use the Portuguese version of the acronym (
1
benefit from the program, those most in need are likely to be excluded from the PBF as the budget becomes larger than expected.
The aim of this paper is to ascertain possible manipulations in the eligibility status for the PBF and establish their effects on time allocation within the households. This manipulation is assessed by the test developed by McCrary (2008), which determines the presence of discontinuity in the density estimated by local linear regressions around the cutoff that defines the eligibility for the program, which was R$120.00 (US$60.00) in terms of monthly per capita household income in 2006. We use a fuzzy regression discontinuity design in order to evaluate the impact on time allocation.
Including this introduction, the paper is organized into six sections. Section 2 describes the main characteristics of the PBF and the incentives associated with participation. The construction of the database and the sample selected are noted in Section 3. Section 4 describes the methodology. Results are presented in Section 5, while Section 6 offers our conclusions.
2. The
Bolsa Família
Program
The PBF is a conditional cash transfer program officially launched by the Brazilian federal government in 2004. It consisted of a merger of several existing social programs, such as the cooking gas subsidy, the National School Allowance Program, the Food Card Program, the Food Allowance Program, and the Child Labor Eradication Program.2 In this section, the description of the PBF relates to 2006 because the data used in this study were obtained from the 2006 PNAD (Brazilian national household survey). In that year, the supplement of the survey collected information about the conditional cash transfer programs.3
In 2006, a household needed to have a monthly per capita household income equal or below to R$120.00 to qualify for the PBF. “Poor” families, defined as those with a monthly per capita household income between R$60.00 and R$120.00, were
2The program is pursuant to law 10.836, as of January 9, 2004, and is currently managed by the Brazilian Ministry of
Social Development and Hunger Eradication.
2
eligible if they had children younger than 15 years of age, or if family members included pregnant women or breastfeeding mothers. If these factors existed, the family would receive a variable transfer of R$15.00 for each child (or pregnant woman or breastfeeding mother), restricted to a maximum of three transfers per household. For cases in which the monthly household income was lower than R$60.00, the families were classified as “extremely poor” and received a basic transfer of R$50.00, even if there were no children, pregnant women or breastfeeding mothers in the household. In addition, these families could receive a variable transfer of R$15.00 per beneficiary (not to exceed three beneficiaries).
In order to qualify for the R$15.00 variable cash transfer, households needed to meet the following requirements:
• Children aged six to 15 years old had to be enrolled in school and have a school attendance rate of at least 85%;
• Pregnant women and breastfeeding mothers were required to attend prenatal and postnatal visits, according to the timetable established by the Brazilian Ministry of Health;
• Children up to seven years of age had to be up-to-date with the recommended vaccine schedule;
Families failing to meet these requirements were subject to gradual penalties, including notification, cancellation of the cash transfer, and exclusion from the program. Nevertheless, no severe penalties exist for manipulating income information. Income verification for participation in the program depends on the institutional framework of each region, and this data is seriously compromised by the fact that a large number of beneficiaries hold informal job contracts.
With these imposed requirements, it is reasonable to assume that violations linked to mandatory school attendance are the most likely to incur severe penalties. In addition, the Ministry of Social Development (MDS), which manages the PBF, relies on the state and municipal public education systems to check whether the requirements are properly satisfied.
3
There are a sizeable number of empirical studies focusing on disincentives to labor force participation due to conditional cash transfer programs adopted by developing countries. However, the findings are not conclusive. For instance, Parker and Skoufias (2000) and Skoufias and Di Maro (2006) investigated the Mexican program Oportunidades and did not find disincentives to contributing to the labor
supply among adult workers. Likewise, Edmonds and Schady (2008) also suggest that Ecuador’s Bono de Desarrollo Humano (BDH) program did not produce effects on the
rate of participation of adult individuals in the labor market. On the other side of the spectrum, Maluccio and Flores (2005) showed that Nicaragua’s Red de Protección
Social (RPS) program significantly reduced hours worked among adult male workers,
but not among adult female workers.
Recently, several studies have sought to determine the effects of the PBF and other conditional cash transfer programs on adult labor supply in Brazil (e.g., Soares et
al., 2007; Ferro and Nicollela, 2007; Tavares, 2008; Teixeira, 2008; Covre et al., 2008;
4
3. Dataset and Sample Selection
The data used in the present study were obtained from the Brazilian national household survey (PNAD) conducted in 2006. The Brazilian Institute of Geography and Statistics (IBGE) conducts the PNAD on an annual basis. The survey covers all regions of Brazil (except for some rural areas). Around 75,000 households (300,000 individuals) are interviewed. The PNAD general questionnaire collects information about social, demographic, and economic characteristics of the individuals and households.
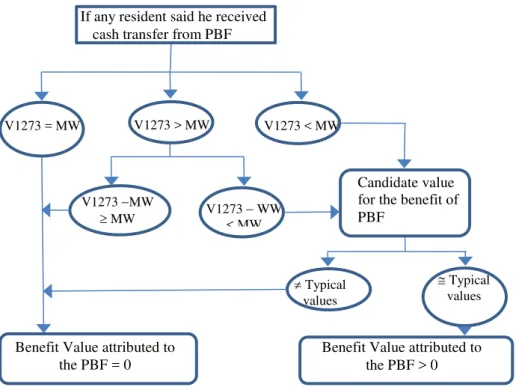
Notes: MW ⇒ Minimum wage in September 2006 used as reference (R$260.00). Values equal to, or a multiple of, constant MW in the V1273 variable are attributed to cash transfer from the Continuous Cash Benefit (BPC) program, as is explained in Barros et al. (2006c);
Typical Values = Typical values of PBF and correlates, as well as their combinations, as illustrated in Table 6 in Barros et al.
(2006c). Values close to “Typical Values” (± R$5.00) were considered in order to make up for possible incorrect information provided by the respondent.
Figure 1 – Filtering procedure for calculation of the PBF value
If any resident said he received cash transfer from PBF
Benefit Value attributed to the PBF = 0
V1273 − WW < MW
≅ Typical values V1273 −MW
≥ MW
Benefit Value attributed to the PBF > 0 ≠ Typical
values V1273 = MW
Candidate value for the benefit of PBF
5
For each year, there is a specific questionnaire, aside from the general one, that gathers information about a specific topic or issue. The 2006 PNAD is especially useful in identifying which households had at least one PBF beneficiary. However, the PNAD does not have a specific variable to assess the cash transfers an individual receives from social programs. Cash transfers from these programs are included in the V1273 variable, along with the interest generated from savings accounts and other financial applications, dividends, and other revenues.
In order to obtain the value exclusively comprised of PBF transfers, based on the V1273 variable, we use the filtering procedure shown in Figure 1. This model closely follows the procedure used by Barros et al. (2006c).
With this procedure we are able to construct the value of the PBF cash transfer by household. Following this, we construct the variable monthly net household income per capita of the PBF cash transfer.
We use different samples of individuals and classify them into two groups to check for heterogeneities in the income manipulation tests:4
• Family group “1”: members of households made up of couples with at least one child younger than 15 years of age;
• Family group “2”: members of households consisting of mother as household head, with at least one child younger than 15 years of age. Based on the household profile, in order to capture the possible heterogeneous effects of the PBF on labor supply, the subsamples were stratified into another two groups:
• Demographic group “A1”: men (household heads) belonging to family group “1”;
• Demographic group “B1”: women (mothers) belonging to family group “1”;
• Demographic group “B2”: women (mothers) belonging to family group “2”.
We perform our empirical analysis separately for each demographic group. The descriptive statistics of the samples are presented below in Table 1.
4 The selection of households with at least one child younger than 15 years of age is justified by the criterion that
6
7
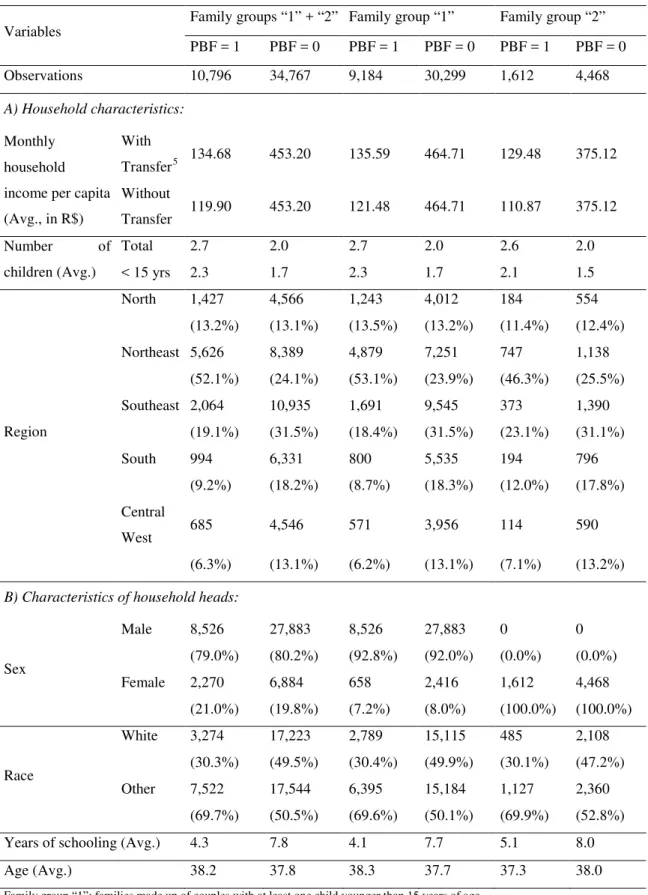
Table 1 – Descriptive statistics of family groups
Variables Family groups “1” + “2” Family group “1” Family group “2” PBF = 1 PBF = 0 PBF = 1 PBF = 0 PBF = 1 PBF = 0
Observations 10,796 34,767 9,184 30,299 1,612 4,468
A) Household characteristics:
Monthly household income per capita (Avg., in R$)
With
Transfer5 134.68 453.20 135.59 464.71 129.48 375.12
Without
Transfer 119.90 453.20 121.48 464.71 110.87 375.12 Number of
children (Avg.)
Total 2.7 2.0 2.7 2.0 2.6 2.0 < 15 yrs 2.3 1.7 2.3 1.7 2.1 1.5
Region
North 1,427 4,566 1,243 4,012 184 554 (13.2%) (13.1%) (13.5%) (13.2%) (11.4%) (12.4%) Northeast 5,626 8,389 4,879 7,251 747 1,138
(52.1%) (24.1%) (53.1%) (23.9%) (46.3%) (25.5%) Southeast 2,064 10,935 1,691 9,545 373 1,390
(19.1%) (31.5%) (18.4%) (31.5%) (23.1%) (31.1%) South 994 6,331 800 5,535 194 796
(9.2%) (18.2%) (8.7%) (18.3%) (12.0%) (17.8%) Central
West 685 4,546 571 3,956 114 590 (6.3%) (13.1%) (6.2%) (13.1%) (7.1%) (13.2%)
B) Characteristics of household heads:
Sex
Male 8,526 27,883 8,526 27,883 0 0 (79.0%) (80.2%) (92.8%) (92.0%) (0.0%) (0.0%) Female 2,270 6,884 658 2,416 1,612 4,468 (21.0%) (19.8%) (7.2%) (8.0%) (100.0%) (100.0%)
Race
White 3,274 17,223 2,789 15,115 485 2,108 (30.3%) (49.5%) (30.4%) (49.9%) (30.1%) (47.2%) Other 7,522 17,544 6,395 15,184 1,127 2,360 (69.7%) (50.5%) (69.6%) (50.1%) (69.9%) (52.8%) Years of schooling (Avg.) 4.3 7.8 4.1 7.7 5.1 8.0 Age (Avg.) 38.2 37.8 38.3 37.7 37.3 38.0
Family group “1”: families made up of couples with at least one child younger than 15 years of age.
Family group “2”: families made up of mother (household head) with at least one child younger than 15 years of age. Source: PNAD/IBGE, 2006.
5 “With Transfer” designates families that received the extra payment because of the number of children eligible for
8
It is important to note that the average number of children is larger for PBF beneficiaries and that the geographical distribution between the two groups is different, since approximately 50% of beneficiaries live in the northeast, in contrast to non-beneficiaries. Non-white individuals are the overwhelming majority among beneficiaries.
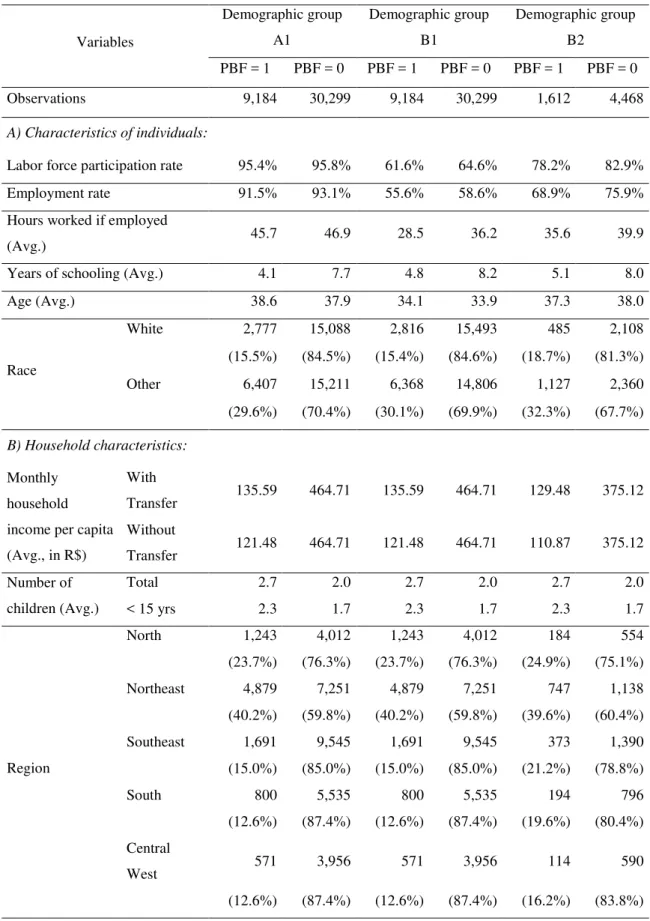
Table 2 describes the characteristics of the household members in each group. Employment rates and the average number of weekly hours worked among PBF beneficiaries are higher for group A1 (men) and lower for group B1 (married women). On the other hand, the participation rate is very similar between married male beneficiaries and non-beneficiaries. The beneficiaries belonging to the group of married mothers are the youngest. Single or independent mothers, however, have higher average schooling levels.
9
Table 2 – Descriptive statistics of family group members
Variables Demographic group A1 Demographic group B1 Demographic group B2
PBF = 1 PBF = 0 PBF = 1 PBF = 0 PBF = 1 PBF = 0
Observations 9,184 30,299 9,184 30,299 1,612 4,468
A) Characteristics of individuals:
Labor force participation rate 95.4% 95.8% 61.6% 64.6% 78.2% 82.9% Employment rate 91.5% 93.1% 55.6% 58.6% 68.9% 75.9% Hours worked if employed
(Avg.) 45.7 46.9 28.5 36.2 35.6 39.9 Years of schooling (Avg.) 4.1 7.7 4.8 8.2 5.1 8.0 Age (Avg.) 38.6 37.9 34.1 33.9 37.3 38.0
Race
White 2,777 15,088 2,816 15,493 485 2,108 (15.5%) (84.5%) (15.4%) (84.6%) (18.7%) (81.3%) Other 6,407 15,211 6,368 14,806 1,127 2,360 (29.6%) (70.4%) (30.1%) (69.9%) (32.3%) (67.7%)
B) Household characteristics:
Monthly household income per capita (Avg., in R$)
With
Transfer 135.59 464.71 135.59 464.71 129.48 375.12 Without
Transfer 121.48 464.71 121.48 464.71 110.87 375.12 Number of
children (Avg.)
Total 2.7 2.0 2.7 2.0 2.7 2.0 < 15 yrs 2.3 1.7 2.3 1.7 2.3 1.7
Region
North 1,243 4,012 1,243 4,012 184 554 (23.7%) (76.3%) (23.7%) (76.3%) (24.9%) (75.1%) Northeast 4,879 7,251 4,879 7,251 747 1,138 (40.2%) (59.8%) (40.2%) (59.8%) (39.6%) (60.4%) Southeast 1,691 9,545 1,691 9,545 373 1,390 (15.0%) (85.0%) (15.0%) (85.0%) (21.2%) (78.8%) South 800 5,535 800 5,535 194 796 (12.6%) (87.4%) (12.6%) (87.4%) (19.6%) (80.4%) Central
West 571 3,956 571 3,956 114 590 (12.6%) (87.4%) (12.6%) (87.4%) (16.2%) (83.8%)
10
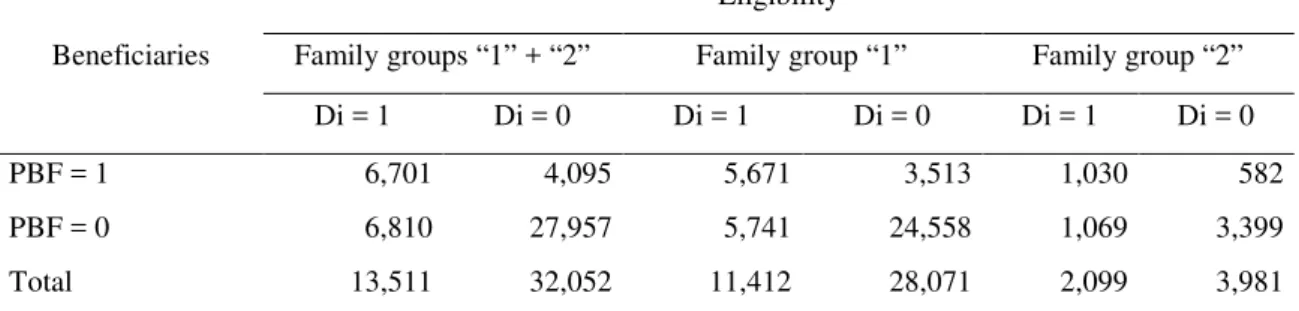
Table 3 – Frequency of PBF beneficiaries and non-beneficiaries according to the eligibility criterion (cutoff = R$120.00).
Beneficiaries
Eligibility
Family groups “1” + “2” Family group “1” Family group “2”
Di = 1 Di = 0 Di = 1 Di = 0 Di = 1 Di = 0
PBF = 1 6,701 4,095 5,671 3,513 1,030 582 PBF = 0 6,810 27,957 5,741 24,558 1,069 3,399 Total 13,511 32,052 11,412 28,071 2,099 3,981
Eligible if monthly household income per capita is less than or equal to R$120.00. Ineligible, otherwise. Family group “1”: families made up of couples with at least one child younger than 15 years of age.
Family group “2”: families made up of mother (household head) with at least one child younger than 15 years of age. Source: PNAD/IBGE, 2006
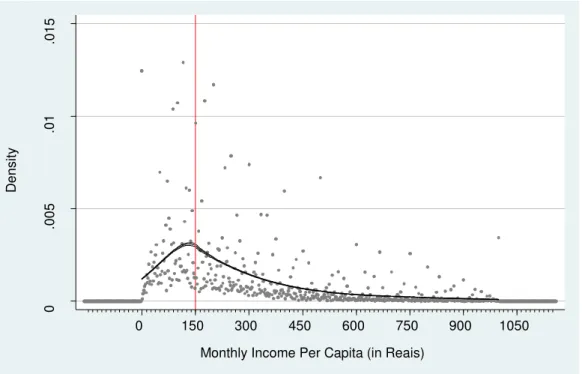
Figure 2 shows the kernel density functions for the monthly net household income per capita of the PBF transfers in 2006. First, the average income of recipients is below the income cutoff for eligibility (R$120.00). Another important characteristic of recipient households is the existence of a larger concentration of observations below the cutoff value, compared to the distribution of non-recipients. Despite the greater proportion of beneficiaries among poor families, there are a non-negligible number of PBF participants whose monthly per capita household income is higher than the cutoff value. These characteristics raise two possibilities:
a) The focus of the program was appropriate as the mean of the average per capita household income, discounted from the cash transfers, is much lower than the eligibility cutoff;
b) The household income criterion encourages people to behave
11
Figure 2 - Kernel density of monthly household income per capita, 2006
4. Methodology
4.1. McCrary’s test
McCrary (2008) suggests that if there is a discontinuity in the density of the running variable at the program’s eligibility threshold, this may imply that some agents were able to perfectly manipulate their treatment status. In our case, this phenomenon means that the allocation of the household from one side of the cutoff point to the other is manipulated. This is done by participants either altering their household income or by omitting information about it to the policy maker.
We use the density test proposed by McCrary (2008) to check whether there is evidence of discontinuity in the density of the monthly per capita household income at the cutoff value for the eligibility criterion. This procedure is a local linear density estimator performed in two stages: the first step estimates a per capita household income histogram, while the second phase smoothens the histogram on each side of the
0
.002
.004
.006
D
ens
it
y
0 60 120 180 240 300 360 420
Monthly Income Per Capita (in Reais)
12
cutoff point using a local linear regression. After this computation, a Wald estimator is used to test the null hypothesis of whether discontinuity is equal to zero around the cutoff.
4.2. Fuzzy regression discontinuity design
In order to further investigate whether individuals manipulate their eligibility status by changing their income through labor supply decisions, we evaluate the effect of being qualified for the PBF on a series of individual outcomes. We estimate the following type of regression:
�� =�+���+�(��)+���+�� ,
�= 1,⋯,� (1)
where �(��) =ψ00+∑��=1ψ1�(��− ��)�+∑��=1��(�� − ��)��� .
Equation (1) specifies the relationship of an outcome variable �� and the indicator variable �� = 1[�� ≤ ��] of program eligibility, �(��) and additional controls ��. The outcomes of interest are: an indicator variable, of PBF participation; an indicator variable of labor market participation; an indicator variable, if the individual is working in the labor market; and the number of weekly hours worked in the labor market. The indicator variable �� assumes a value equals one if the individual ex-ante income �� is equal or below the threshold value �� of the eligibility
criterion for participation in the PBF. The function �(��) is a polynomial based on the individual ex-ante income centered at the cutoff given by the eligibility criterion. �� is
a vector of additional controls and includes region dummies, sector of activity, race, age, age squared, years of schooling, and a dummy variable indicating whether an individual holds a formal job.
13
5.
Results
5.1. Manipulation tests
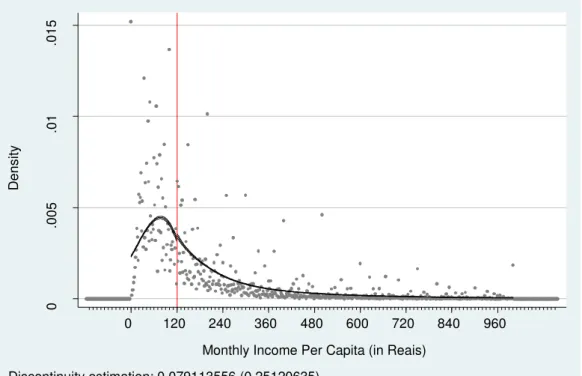
Figures 3 through 5 show the density of monthly net household income per capita of the transfer values received by beneficiaries. Figure 3 represents the density for family groups “1” and “2” jointly, and Figures 4 and 5 illustrate the individual densities for family groups “1” and “2” respectively. All of the figures have significant discontinuity around the eligibility criterion of R$120.00. It is important to note that the density of the sample is increasing from having zero income to R$120.00. The density is also decreasing to the right from the cutoff of R$120.00.
Additionally, we perform the McCrary density tests for different cutoff values. The results are presented in the Figures 6 and 7. We estimated household income density functions with cutoff points of R$150.00 and R$140.00 for family groups “1” and “2” respectively. These two figures indicate that the densities on the right and left sides of the cutoff points are similar.
14
Figure 3 –Normalized density of the PBF eligibility variable – cutoff = R$120.00
(family groups “1” and “2”)
Figure 4 – Normalized density of the PBF eligibility variable – cutoff = R$120.00
(family group “1”)
0
.005
.0
1
.015
D
ens
it
y
0 120 240 360 480 600 720 840 960
Monthly Income Per Capita (in Reais)
0
.005
.0
1
.015
D
ens
it
y
0 120 240 360 480 600 720 840 960
15
Figure 5 – Normalized density of the PBF eligibility variable – cutoff = R$120.00
(family group “2”)
Figure 6 – Normalized density of the PBF eligibility variable – cutoff = R$150.00
(family group “1”)
0
.002
.004
.006
.008
.0
1
D
ens
it
y
0 120 240 360 480 600 720 840 960
Monthly Income Per Capita (in Reais)
0
.005
.0
1
.015
D
ens
it
y
0 150 300 450 600 750 900 1050
16
Figure 7 – Normalized density of the PBF eligibility variable – cutoff = R$140.00
(family group “2”)
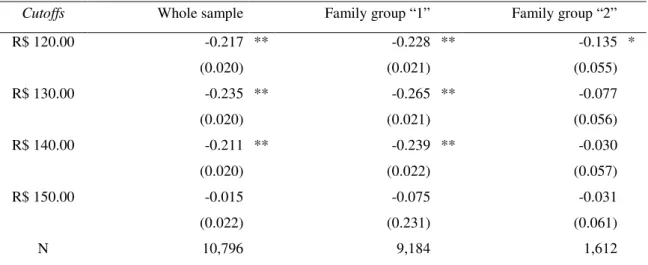
Table 4 – Discontinuity estimators (in log) for several cutoff points
Cutoffs Whole sample Family group “1” Family group “2”
R$ 120.00 -0.217 ** -0.228 ** -0.135 * (0.020) (0.021) (0.055) R$ 130.00 -0.235 ** -0.265 ** -0.077 (0.020) (0.021) (0.056) R$ 140.00 -0.211 ** -0.239 ** -0.030 (0.020) (0.022) (0.057)
R$ 150.00 -0.015 -0.075 -0.031
(0.022) (0.231) (0.061)
N 10,796 9,184 1,612
Standard errors in parentheses. * p-value < 0.05; ** p-value < 0.01. Values calculated based on the local discontinuity estimator (McCrary, 2008).
0
.002
.004
.006
.008
.0
1
D
ens
it
y
17
We also perform the McCrary test for different cutoff points. The value of these cutoff points include R$130.00, R$140.00, and R$150.00. We find some discontinuities for these threshold values as well. They are significantly different from zero for the R$130.00 and R$140.00 cutoffs for family group “1” and the whole sample. However, the discontinuity is no longer significantly different from zero at the cutoff value of R$150.00.Discontinuities at other cutoff values may be due to the fact that our measure of income is imperfect. The actual threshold used by the policy maker is more likely to be around our R$120.00 value.
Finally, Figures 8 and 9 show robustness checks that were carried out. These tests determine whether this discontinuity is due to the incentives provided by the program, or whether it is a systematic characteristic of the Brazilian income distribution that exists independently from the PBF. The distribution of household income was plotted for 1998 and 1999, years during which the PBF did not exist. Since no discontinuity is observed in these years, it is likely that the jumps observed in 2006 are related to the PBF.
Figure 8 – Normalized density of household income per capita (PNAD 1998)
0
.005
.0
1
.015
D
ens
it
y
0 120 240 360 480 600 720 840 960
Monthly Income Per Capita (in Reais)
18
Figure 9 – Normalized density of household income per capita (PNAD 1999)
Overall, these results suggest that agents deliberately reduce their incomes, or report them incorrectly to the policy maker in order to be eligible for the program.
5.2. Eligibility Criterion and Program Participation
We next check to determine if individuals that are eligible for the PBF, based on the guidelines we defined previously, are in fact more likely to participate in the program. Table 5 presents the results for the estimations of equation (1), where �(��) is specified in quadratic form. The regressions are estimated separately for family groups “1” and “2.” We test the R$120.00, R$140.00, and R$150.00 cutoff values.
The results of Table 5 show that individuals immediately below the threshold are more likely to participate in the PBF. There is discontinuity in the probability of participating in the PBF around the threshold of R$120.00 for individuals belonging to both family groups “1” and “2.” Results indicate that individuals in family group “1” and “2” who are directly below the cutoff are, respectively, 11.82 and 12.41 percentage points more likely to participate in the PBF compared to individuals immediately above
0
.005
.0
1
.015
D
ens
it
y
0 120 240 360 480 600 720 840 960 Monthly Income Per Capita (in Reais)
19
this value. We do not find discontinuities for other cutoff values, except for family group “1” individuals around the cutoff value of R$140.00.
Table 5 – RD estimates: probability of a household participating in the PBF
Coefficient
s Description
Family group “1” Family group “2”
Cutoff =
R$ 120.00
Cutoff =
R$ 140.00
Cutoff =
R$ 150.00
Cutoff =
R$ 120.00
Cutoff =
R$ 140.00
Cutoff =
R$ 150.00
β Eligibility (D) 0.1181*** 0.1066*** 0.0717 0.1241*** 0.0692 0.0572 (0.0133) (0.0140) (0.0428) (0.0316) (0.0362) (0.0303) N 39483 39483 39483 6080 6080 6080 R2 0.2508 0.2544 0.2559 0.2105 0.2116 0.2126
F test for β= 0 79.13 68.98 3.05 15.47 3.66 3.57 Family group “1”: families made up of couples with at least one child younger than 15 years of age.
Family group “2”: families made up of mother (household head) with at least one child younger than 15 years of age. Standard errors corrected for heteroskedasticity shown in parentheses.
* p-value < 0.1; ** p-value < 0.05; *** p-value < 0.01.
5.3. Eligibility Criterion and Labor Supply
Thus far, we have found that (i) there is greater density of individuals immediately below the threshold level of the eligibility criterion for the PBF along the
ex-ante family income per capita distribution; and (ii) the individuals immediately
below the threshold level of the eligibility criterion PBFare more likely to participate in the program. In this section, we further investigate whether there are suggestive evidences indicating that individuals manipulate their participation eligibility by changing their labor supply decisions.
20
worked. We used three different specifications for the �(��) function: linear, quadratic, and cubic. The results for the β coefficients for each regression are presented in Table 6.
Table 6 – RD estimates: Effects on labor supply
Demographic Groups
Cutoff = R$120.00
Linear Quadratic Cubic
A) Labor Force Participation
GDA1 -0.0299*** -0.0286*** -0.0269*** (0.0025) (0.0025) (0.0026) GDB1 -0.1346*** -0.1311*** -0.1261***
(0.0053) (0.0054) (0.0055) GDB2 -0.1233*** -0.1228*** -0.1176***
(0.0108) (0.0110) (0.0115) B) Employed
GDA1 -0.1207*** -0.1175*** -0.1117*** (0.0032) (0.0032) (0.0033) GDB1 -0.2024*** -0.1955*** -0.1841***
(0.0061) (0.0062) (0.0063) GDB2 -0.2580*** -0.2539*** -0.2398***
(0.0127) (0.0129) (0.0135) C) Weekly Hours Worked
GDA1 -2.4554*** -2.3309*** -2.2518*** (0.1723) (0.1740) (0.1782) GDB1 -4.6125*** -4.4899*** -4.3133***
(0.2882) (0.2901) (0.2948) GDB2 -4.9221*** -4.6078*** -4.2982***
(0.5605) (0.5660) (0.5826)
1) GDA1: men (married fathers) belonging to family group “1”; GDB1: women (married mothers) belonging to family group “1”; GDB2: women (single or divorced mothers) belonging to family group “2.”
2) Standard errors in parentheses. * p-value < 0.1; ** p-value < 0.05; *** p-value < 0.01.
3) Besides the variables specified in Equations 1 and 2, the following covariates were used: region, sector of activity, race, age, age squared, schooling, and dummy variable indicating if individuals hold a formal job.
21
men. In fact, the point estimates for GDA1 are always below the point estimates for GDB1 and GDB2.
The second exercise classifies the individuals into two occupational groups according to their degree of labor market attachment. Group ocupi06 = 1 designates
individuals employed for less than five months in 2006, or those who were unemployed in the survey week of reference, but employed in that year; group ocupi06 = 0 designates
individuals who were continuously employed throughout the year. The idea being examined is that individuals in group ocupi06 = 1 are less attached to the labor market,
and; therefore, more prone to manipulating their income by changing their labor supply in order to qualify for the PBF. We perform the McCrary test on the distribution of the logarithm of income using the local linear estimator separately for each group. We use different cutoff values and the results are presented in Table 7.
Table 7 shows that discontinuities only remain for the group less attached to the labor market, especially around the cutoff of R$120.00. The density is lower directly after this threshold and the difference is statistically significant.
Table 7 – McCrary Discontinuity estimators (in log) by to occupational status
Cutoffs
Family group “1” Family group “2”
ocupi06 =
1
ocupi06 =
0
ocupi06 =
1
ocupi06 =
0
R$ 120.00 -0.347 ** -0.022 -0.287 * -0.208 (0.083) (0.046) (0.120) (0.121) R$ 130.00 -0.157 -0.064 -0.191 -0.061 (0.089) (0.045) (0.127) (0.103) R$ 140.00 -0.314 ** -0.071 -0.073 -0.099 (0.088) (0.045) (0.133) (0.099) R$ 150.00 -0.143 -0.063 -0.048 -0.063 (0.103) (0.048) (0.159) (0.113) N 4,262 35,221 1,790 4,290
Standard errors in parentheses. * p-value < 0.05; ** p-value < 0.01.
Values calculated based on the local discontinuity estimator (McCrary, 2008).
Family group “1”: families made up of couples with at least one child younger than 15 years of age.
22
The results of Table 7 are additional suggestive string evidence that individuals manipulate their eligibility status by changing their labor supply decisions since the discontinuity is observed only among those that are weaker attached to the labor market.
6. Conclusions
In this paper, we assessed the existence of eligibility status manipulation by individuals for participation in the PBF. Our goal was to investigate a possible channel for this type of manipulation through changes in the time allocation decisions of individuals. The PBF eligibility criterion establishes that families with a monthly family income per capita equal to or below R$120.00 are eligible for the program. Evidence of manipulation was obtained through the formal test proposed by McCrary (2008). We found that (i) there is a greater density of individuals immediately below the threshold level of the eligibility criterion for the PBF along the ex-ante family income per capita
distribution; (ii) individuals immediately below the threshold level of the eligibility criterion PBF are more likely to participate in the program; and (iii) individuals immediately below the threshold level of the eligibility criterion PBF are less likely to participate in the labor market, less likely to be employed, and work fewer hours in the labor market. Moreover, individuals who are less attached to the labor market are the ones associated with the manipulation of their eligibility status. Finally, most of the results are robust for different periods or at different cutoff points.
23
7. References
BARROS, R. P. de; HENRIQUES, R.; MENDONÇA, R. (2001): A estabilidade inaceitável: desigualdade e pobreza no Brasil. Texto para Discussão, nº. 800, IPEA, Rio
de Janeiro.
BARROS, R. P. de; CARVALHO, M.; FRANCO, S.; MENDONÇA, R. (2006a): A Queda Recente da Desigualdade de Renda no Brasil. In: BARROS, R. P. de; FOGUEL,
M. N.; ULYSSEA, G. Desigualdade de Renda no Brasil: Uma Análise da Queda
Recente - Vol. 1. Brasília: IPEA.
BARROS, R. P. de; CARVALHO, M.; FRANCO, S.; MENDONÇA, R. (2006b): A Importância da Queda Recente da Desigualdade Para a Pobreza. In: BARROS, R. P. de;
FOGUEL, M. N.; ULYSSEA, G. Desigualdade de Renda no Brasil: Uma Análise da
Queda Recente - Vol. 1. Brasília: IPEA.
BARROS, R. P. de; CARVALHO, M.; FRANCO, S. (2006c): O Papel das Transferências Públicas na Queda Recente da Desigualdade de Renda Brasileira. In:
BARROS, R. P. de; FOGUEL, M. N.; ULYSSEA, G. Desigualdade de Renda no
Brasil: Uma Análise da Queda Recente - Vol. 2. Brasília: IPEA.
BLUNDELL, R.; MACURDY, T. (1999): Labor Supply: A Review of Alternative Approaches. In ASHENFELTER, O.; CARD, D. (eds.): Handbook of Labor Economics,
vol. 3A, Amsterdam: North Holland, Cap. 27.
BOURGUIGNON, F.; ROBILLIARD, A.S.; ROBINSON, S. (2003): Representative versus Real Households in the Macroeconomic Modeling of Inequality. Working Paper,
nº.2003-05, DELTA/ENS, Paris.
BOURGUIGNON, F.; FERREIRA, F. G. H.; LEITE, P. G. (2004): Ex ante Evaluation of Conditional Cash Transfer Programs: The Case of Bolsa Escola. In: WORLD
BANK: Inequality and Economic Development in Brazil. Washington, D.C.: World
Bank.
CARDOSO, E.; SOUZA, A. P. (2004): The Impact of Cash Transfers on Child Labor and School Attendance in Brazil. Working Paper Nº.04-W0. Department of Economics, Vanderbilt University Nashville, TN 37235.
CEDEPLAR - CENTRO DE DESENVOLVIMENTO E PLANEJAMENTO
24
COVRE, S.; MARQUES, F.; MATTOS, E. (2008): Oferta de trabalho e transferências: Evidências dos efeitos das condições impostas pelo programa Bolsa-Família. ANPEC.
Disponível em http://www.anpec.org.br/encontro2008/artigos/200807141223420-.pdf. CURY, S.; PEDROZO, E.; COELHO, A. M.; CALLEGARI, I. (2009): The Impacts of Income Transfer Programs on Income Distribution and Poverty in Brazil: An Integrated Microsimulation and Computable General Equilibrium Analysis. Final Research Report
- MPIA nº.11086, MPIA/PEP, Quebec.
EISSA, N.; KLEVEN, H. J.; KREINER, C. T. (2006): Welfare Effects of Tax Reform and Labor Supply at the Intensive and Extensive Margins. In AGELL, J.; SORENSEN,
P. B. (eds.): Tax Policy and Labor Market Performance, Cambridge: The MIT Press.
FERRO, A. R.; KASSOUF, A. N. (2003): Avaliação do Impacto dos Programas de Bolsa Escola na Incidência de Trabalho Infantil no Brasil. ANPEC. Disponível em http://www.anpec.org.br/encontro2003/artigos/F32.pdf.
FERRO, A. R.; NICOLLELA, A. C. (2007): The impact of conditional cash transfer programs on Household work decisions in Brazil. In: Population Association of
America 2007 Annual Meeting. Available at
em http://paa2007.princeton.edu/download.aspx?submissionId=71442.
FOGUEL, M. N.; BARROS, R. P. de (2008): The Effects of Conditional Cash Transfer Programmes on Adult Labour Supply: An Empirical Analysis Using a Time-Series-Cross-Section Sample of Brazilian Municipalities. ANPEC. Disponível
em http://www.anpec.org.br/encontro2008/artigos/200807211655420-.pdf.
GLEWWE, P ; KASSOUF, A. L. . The Impact of the Bolsa Escola/Família Conditional Cash Transfer Program on Enrollment, Drop Out Rates and Grade Promotion in Brazil. Journal of Development Economics , v. 97, p. 505-517, 2012
HOFFMANN, R. (2006): Brasil, 2004: Menos pobres e menos ricos. In: Parcerias
Estratégicas - Edição especial: Análise sobre a Pesquisa Nacional por Amostra de Domicílios (PNAD 2004). Brasília: Centro de Gestão e Estudos Estratégicos, nº. 22, p.
77-88.
IPEADATA (2013).Disponível em: http://www.ipeadata.gov.br/. Acesso em: fev. 2013. MALUCCIO, J. A.; FLORES, R. (2005): Impact Evaluation of a Conditional Cash Transfer Program: The Nicaraguan Red de Protección Social. Research Report,nº.141,
25
MCCRARY, J. (2008): Manipulation of the running variable in the regression discontinuity design: A density test. Journal of Econometrics, 142(2): 698-714.
MOFFITT, R. A. (1992): Incentive effects of the U.S. welfare system: A review.
Journal of Economic Literature, vol. 30(1): 1-61.
PARKER, S. W.; SKOUFIAS, E. (2000): The Impact of PROGRESA on Work, Leisure, and Allocation. Final Report, International Food Policy Research Institute,
Washington, DC.
SKOUFIAS, E.; di MARO, V. (2006): Conditional Cash Transfers, Work Incentives, and Poverty. Policy Research Working Paper, nº.3973, World Bank, Washington, DC.
SOARES, F. V.; RIBAS, R. P.; OSÓRIO, R. G. (2007): Avaliando o Impacto do Programa Bolsa Família: uma Comparação com Programas de Transferência
Condicionada de Renda de Outros Países. IPC Evaluation Note, nº. 1. Brasília: IPC.
TAVARES, P. A. (2008): Efeito do Programa Bolsa Família sobre a Oferta de Trabalho das Mães. ANPEC. Disponível em http://www.anpec.org.br/encontro2008/artigos/
200807211028050-.pdf.
TEIXEIRA, C. G. (2008): Análise do Impacto do Programa Bolsa Família na Oferta de Trabalho dos Homens e Mulheres. UNDP/IPC. Disponível em
http://www.ipc-undp.org/publications/mds/27P.pdf.
World Bank (2013). Report No. 63731. Disponível