CONGESTION MANAGEMENT IN
DEREGULATED POWER SYSTEM
USING REAL CODED GENETIC
ALGORITHM
SUJATHA BALARAMAN*
Assistant Professor, Electrical & Electronics Engineering Department, Government College of Engineering, Tirunelveli, Tamilnadu, India
N.KAMARAJ
Professor & Head, Electrical & Electronics Engineering Department, Thiagarajar College of Engineering, Madurai, Tamilnadu, India
Abstract :
In this paper, an efficient method has been proposed for transmission line over load alleviation in deregulated power system using real coded genetic algorithm (RCGA). For secure operation of power system, the network loading has to be maintained within specified limits. Transmission line congestion initiates the cascading outages which forces the system to collapse. Accurate prediction and alleviation of line overloads is the suitable corrective action to avoid network collapse. In this paper an attempt is made to explore the use of real coded genetic algorithm to find the optimal generation rescheduling for relieving congestion. The effectiveness of the proposed algorithm has been analyzed on IEEE 30 bus test system. The results obtained by the proposed method are found to be quite encouraging when compared with Simulated Annealing (SA) and hence it will be useful in electrical restructuring.
Keywords: Deregulation; congestion; optimal power flow; N-1 contingency analysis; optimization techniques; real coded genetic algorithm.
1. Introduction
Congestion management is one of the most challenging operational problems in deregulated power systems. Transmission networks are one of the main sources of difficulties on fair implementation of electricity restructuring. With open access transmission in deregulated environment, poorly scheduled generation patterns and load patterns from competitive bidding, will be seen more and more often which results transmission line overloads. Transmission congestion may be defined as the condition where more power is scheduled or flows across transmission lines and transformers than the physical limits of those lines. Transmission line overload may prevent the existence of new contracts, lead to additional outages, increase the electricity prices in some regions of the electricity markets, and can threaten system security and reliability. Hence an effective control action strategy is necessary to reduce the line overloads to the security limits in the minimum time.
hybrid market is proposed in [Xiao et al. (2009)]. Congestion management using FACTS devices is proposed in [Farahani et al. (2006)].
Since the proposed problem is formulated as a non convex optimization problem with more number of equality and in equality constraints, it can not be directly solved by mathematical methods. Conventional optimization methods suffer from the local optimality problem and some of them usually require the function to have good characteristics, such as continuity, differentiability etc., this restricts the application of these traditional methods to a small range of real word problems. Recently, stochastic optimization techniques, such as the simulated annealing, the genetic algorithm (GA), and the evolutionary algorithm (EA), have drawn many researchers’ attention due to their capability of finding the near global optimal solutions without putting restrictions on the characteristics of the target functions. A great amount of efforts have been devoted in improving these methods and some of the improved methods have been successfully used in variety of real world problems.
GA was initially introduced by John Holland in seventies as a special technique for function optimization. In RCGA, a solution is directly represented as a vector of real parameter decision variables, representation of the solutions very close to the natural formulation of many problems. RCGA is rigorous, precise, and efficient because the floating point representation isconceptually close to the real design space. Ability to exploit the graduality of the functions with continuous variables is another advantage. GA has been applied successfully for many optimization problems [Zhang et al. (2006); Devaraj and Yegnanarayana (2006); Devaraj et al. (2006); Magid and Abido (2003); Ioannis et al. (2005)].
This paper presents an efficient and simplified approach for alleviation of network over loads in deregulated environment using RCGA as an optimization tool. The control used for over load alleviation is real power generation rescheduling. The proposed method is tested with IEEE 30 bus system and the simulation results are compared with SA. The solutions obtained are found to be quite encouraging.
2. Real Coded Genetic Algorithm
GA is essentially a population based search algorithm. The power of this algorithm comes from its ability to exploit historical information structures from previous solution guesses in an attempt to increase performance of future solution structures. The use of floating-point numbers in the GA representation has a number of advantages over binary encoding. The efficiency of the GA gets increased as there is no need to convert the solution variables to the binary type. Moreover, less memory is required and there is no loss in precision by discretisation to binary or other values. Furthermore, there is greater freedom to use different genetic operators. The A typical GA has three phases, i.e., initialization, evaluation and genetic operations, which are consisted of reproduction, recombination or crossover and mutation.
2.1. Cross over
The cross over operator is the main search operator in the GA. Several cross over methods are available in the literature. A Simulated binary crossover (SBX) operator has been applied in this paper which is as follows. The procedure of computing the children solutions from parent solutions is described as follows. First a random number u is generated between 0 and 1. Using a specified probability distribution function, the ordinate βq is found so that the area under the probability curve from 0 to βq is equal to the chosen random number u. The probability distribution used to create a child solution is derived to have a similar search power as that in a single-point crossover in binary-coded GAs and is given as follows:
otherwise
if P
2
1
) 1 ( 5 . 0
1 )
1 ( 5 . 0 ) (
(1)
otherwise u u if u q 1 1 ) 1 ( 2 1 5 . 0 1 1 ) 2 ( (2)
where is the distribution index. It is any nonnegative real number. A large value of allows a large probability for creating near parent solutions and a small value of allows distant points to be created as children solutions. After getting βqfrom Eq. (2) the children solutions are calculated as follows:
] ) , 2 ( ) 1 ( ) , 1 ( ) 1 [( 5 . 0 ) 1 , 1 ( t i x q t i x q t i
x (3)
] ) , 2 ( ) 1 ( ) , 1 ( ) 1 [( 5 . 0 ) 1 , 2 ( t i x q t i x q t i
x (4) where t represents generation number.
2.2. Mutation
The role of mutation in GA is to restore lost or unexpected genetic material into a population to prevent the premature convergence of GA to sub-optimal solutions; it ensures that the probability of reaching any point in the search space is never zero. Some of the commonly used mutation operators are non-uniform mutation, normally distributed mutation, polynomial mutation and so on. In this paper polynomial mutation is adopted and they are described as follows:
In this operator, the new value of the yi (t+1)
of xi (t+1)
after mutation at generation t+1 is given as
i L i x u i x t i x t i
y(1,1) (1,1)( ) (5)
Where u and L represent upper and lower bound and r is a random number between 0 and 1.δi given in Eq.(4) is expressed as follows.
5 . 0 ) 1 ( 1 )) 1 ( 2 ( 1 5 . 0 ; 1 ) 1 ( 1 ) 2 ( i r if m i r i r if m i r i (6)
2.3. Selection Strategy
The selection of parents to produce successive generations plays an important role in the GA. There are a number of selection methods proposed in the literature [Goldberg (1989)] fitness proportionate selection, ranking and tournament selection. Best fitness selection is used in this work i.e. the best Np individuals are selected from the combined population of parent and child population of size 2.Np based on fitness values The steps involved in GA are represented in block diagram as shown in Fig.1.
.
Fig.1. Block diagram of the proposed RCGA
Np individuals Offspring Creation Np parents Np offspring
Initialization Vector representation of the decision variables
3. Proposed congestion management The detailed problem formulation is as follows:
The objective of congestion management is to take actions or control measures in terms of generation re dispatch in minimal amount from initial market clearing values so as to eliminate the system overload. Hence the objective function of the proposed problem is defined as
Minimize hr P d Gk d k C P u Gk u k C Ng k
F ( . . ) $/
(7) Where
F total cost incurred for congestion management
∆PGku active power increment of generator k due to congestion management
∆PGkd active power decrement of generator k due to congestion management Ck
u
price bids submitted by generator k to increase its pool power for congestion management Ckd price bids submitted by generator k to decrease its pool power for congestion management
Equality constraints:
The minimization problem is subjected to the set of constraints as follows. Equality constraints:
These constraints represent power flow equation such as
NB i ij Sin ij B ij Cos ij G i N j j V i V Di P Gi
P ( ) 1,2,...,
(8) NB i ij Cos ij B ij Sin ij G i N j j V i V Di Q Gi
Q ( ) 1,2,...,
(9) g 1,2,..., k ; ΔP d Gk ΔP u Gk C Gk P Gk
P
(10) Nd 1,2,..., j ; C Dj P Dj
P
(11) Where
g number of participating generators Ng number of generators
NB number of buses
PGkC active power produced by generator k as determined by the market clearing PDjC active power consumed by demand j as determined by the market clearing PGk final real power generation of generator k
PDj final real power consumption of demand j Vj & Vk Voltage magnitude of bus j and k
δj &δk Voltage angle of bus j and k
kj admittance angle of line between buses k and j
Constraints (8) and (9) represent real and reactive power balances in each node. Constraints (10) and (11) express final powers as a function of market clearing values.
Inequality constraints Ng k , max Gk P Gk P min Gk
P
(12) Ng k , max Gk Q Gk Q min Gk
Q
(13) max Gk P Gk P min Gk
P
(14)
Where
PGkmin, QGkmin minimum limit of kth generator real and reactive power PGk
max , QGk
max
maximum limit of kth generator real and reactive power
Constraints (12) and (13) provide upper and lower limits for real and reactive power of generators. Constraint (14) provides upper and lower bound for real power adjustment of the participating generators. Constraint (15) ensures that incremental and decremented values of change in real power output of generator as positive.
Security constraints
max ij P ij
P
(16)
NL i , max i V i V min i
V
(17) where
Pij real power flow in line i-j Pijmax maximum flow limit of line i-j NL number of loads
Constraint (16) ensures that the line loading should not exceed its maximum limit. Constraint (17) provides lower and upper bound for load bus voltages.
Severity Index (SI)
The severity of a contingency related to line overload may be expressed in terms of the following severity index, which expresses the stress on the power system in the post contingency period [11].
Lok max
k P
k P
m
SI
1
2
(18)
3.1. Constraint handling mechanism
The GA is unconstrained optimization techniques, however, a large number of practical problem are all constrained optimization problems.When dealing with constrained optimization problems, penalty functions are often used. In this proposed method the equality constraints are effectively handled by running Newton-Raphson power flow (NR) algorithm. Whereas the active power inequality constraints are handled during GA iteration after generation of new individual. These constraints are handled as follows:
if ΔPGk < ΔPGk min
; ΔPGk = ΔPGk min
;
ΔPGk > ΔPGkmax ; ΔPGk = ΔPGkmax ; (19)
Reactive power inequality constraints are handled during load flow solution. If reactive power generation of any PV bus gets violated, then PV bus is treated as PQ bus by fixing reactive power generation at the threshold values. The constraints on other state variables such as load bus voltages and line flows and slack bus power are taken into account by means of quadratic penalty factors.
3.2.Fitness function
Fitness function adopted for evaluating the fitness of each individual in the population is expressed as.
P F
Z (20)
Where F is the objective function and P is the penalty function.
Usually, the penalty function is based on the distance of a solution from the feasible region or on the effort to repair the solution.
) , 0 ( 3 )
1 1
, 0 ( 2 ) , 0 (
1 pf max PS
Nl
i
Nd
j max PV pf
Pl max pf
P
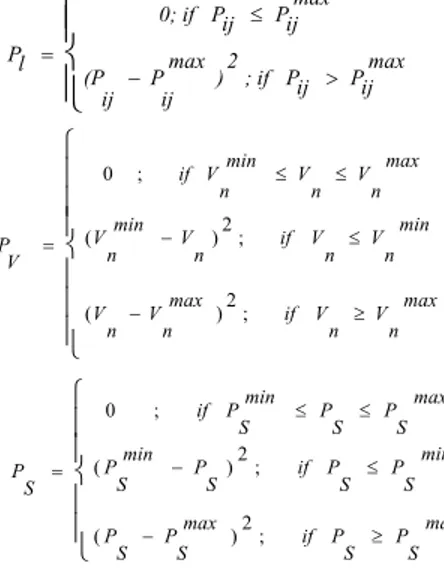
Where pf1, pf2 and pf3 are the user defined weights, prescribing how severely constraint violations are weighted. Pl, PV and PS are expressed as
max ij P ij P if ; 2 ) max ij P ij (P max ij P ij P if 0; l P (22) max n V n V if max n V n V min n V n V if n V min n V max n V n V min n V if V P ; 2 ) ( ; 2 ) ( ; 0 (23) max S P S P if max S P S P min S P S P if S P min S P max S P S P min S P if S P ; 2 ) ( ; 2 ) ( ; 0 (24) In this study the value of pf1, pf2and pf3 are taken as 10000.3.3. Application of RCGA to the proposed problem
The procedural steps involved in the proposed problem are given below. Algorithm
Step 1 Initialize the parameters of GA and set generation k=1. Step 2: Randomly generate the control variables X(k) (i.e. ∆PGk
u
and ∆PGk d
) within the limit.
Step 3: Run power flow for the parent population generated in Step 2 and compute bus voltages and line flows. Evaluate the fitness values for the parent population using Eq.(20).
Step 4: Select parents for recombination.
Step 5: Create new particles using SBX crossover and polynomial mutation operation.
Step 6: Evaluate the fitness values for the new solution vectors using N-R power flow. Combine parent (Np) and child solutions (NP). Among 2Np individuals, best Np individuals are selected based on their fitness values.
Step 7: Check for stopping criteria. If maximum generation is reached then go the next step. Else go to step 4. Step 8: Print the solution which yield minimum fitness value.
4.0. RESULTS AND DISCUSSIONS
The effectiveness of the proposed approach is tested on an IEEE 30 Bus system. It consists of 6 generators, 21 loads and 41 lines. System data are taken from [Alsac and Stott (1974)]. The total real and reactive power of load is 283.4 MW and 126.2 MVAR. The upper and lower limits for reactive power of generation are taken as 100 MVAR and -30 MVAR. Price bids submitted by Generation companies (GENCOs) for congestion management are given in Table 1. The load bus voltages are maintained between 0.9 and 1.1p.u.
Table 1. Generator Price bids
Gen. no.
Gen. Bus no.
Generator Price Bids ($/MWhr) P G min (MW) PG max (MW) Cku Ckd
1 1 22 18 0 360.2
2 2 21 19 20 140
3 5 42 38 15 100
Parameter setup:
RCGA: SA:
Cross over probability= 0.8 Max. Temperature: 1000 Mutation probability= 0.05 Min.tempearture:10
ηm=20; η =5; Population size=20 Total generations=300
Initially N-1 contingency analysis is carried out to find the critical line outage cases. From the analysis it is found that outage of lines such as 1–2, 1–3, 3–4 and 2–5 have resulted in overload on other lines. Furthermore the outage of line 1-2 is found to be the most severe one since it yield high severity index of 2.371. In this study all the above said line outage cases are considered.
Four test cases are considered for simulation as follows.
Case A: outage of line 2-5 and increase of load at buses 2, 3 ,4 and 5 by 35% i.e. Load factor ‘LF’= 1.35 Case B: unavailability of line between bus 1 and 3 and increase of load at bus 19 by 130% , LF = 2.3 Case C: outage of line 3-4 and increase of load at bus 2 by 250%, LF= 3.5
Case D: outage of line 1-2 and load at all bus raised by 30%, LF=1.3
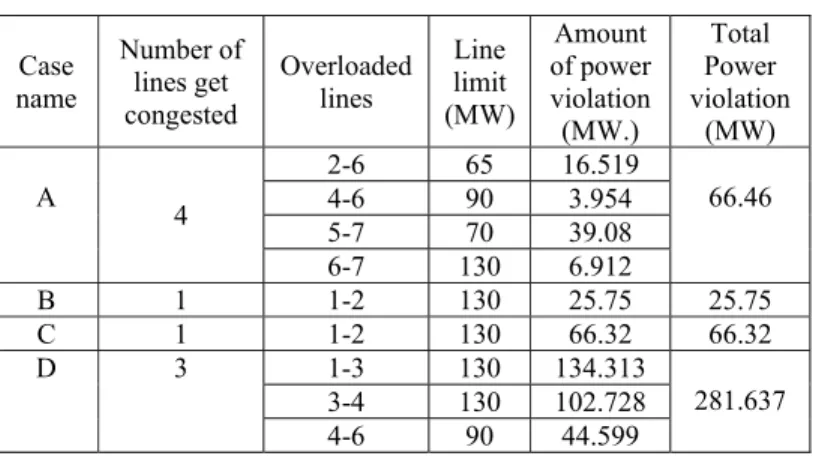
For each simulation cases N-R power has been run and the status of the overloaded lines are shown in Table 2.
Table 2. Power flow results for the test cases
In case A, four lines get overloaded such as 2-6,4-6,5-7 and 6-7 due to unavailability of line 2-5 and raise in load at buses 2,3,4 and 5 by 30%. The net amount of power violation is found to be 66.46 MW. For this case, the proposed problem formulated in section 3 is solved using RCGA and SA techniques. The incremental and decremented change in generator real power for alleviating line overloads is given in Table 3 for case A.
Table 3. Control variable setting for corrective action – Case A
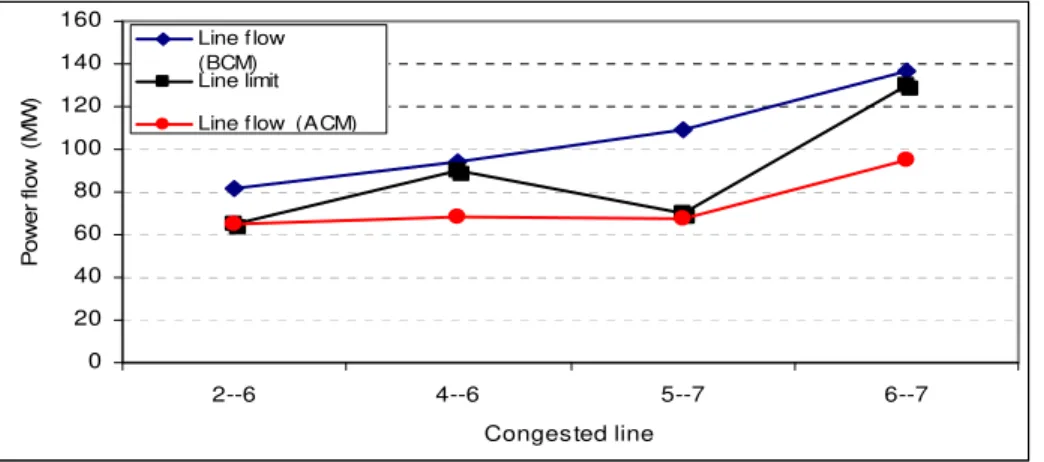
In case A, both RCGA and SA yield solutions which alleviate overloads completely with out any load shed. However the proposed method yields economical solutions with congestion cost of 1837.8 $/hr than its counter part. Fig.2. shows the power flow in the congested lines before congestion management (BCM) and after congestion management (ACM) for Case A with maximum flow limit of lines.
Case name
Number of lines get congested
Overloaded lines
Line limit (MW)
Amount of power violation (MW.)
Total Power violation
(MW) A
4
2-6 65 16.519
66.46
4-6 90 3.954
5-7 70 39.08
6-7 130 6.912
B 1 1-2 130 25.75 25.75
C 1 1-2 130 66.32 66.32
D 3 1-3 130 134.313
281.637
3-4 130 102.728
4-6 90 44.599
Method Generator MW adjustment for congestion management
∆PG1 ∆PG2 ∆PG3 ∆PG4 ∆PG5 ∆PG6
SA +5.287 +4.149 +36.476 +2.903 0 +1.375
Fig.2. Power flow status of overloaded lines -Case A
Fig.3. shows the convergence characteristics of fitness values for RCGA and SA method. From this figure it is revealed that RCGA seeks optimal solution in the earlier iteration.
Fig.3. Plot of fitness value Verses generations -Case A
In Case B and Case C, line 1-2 gets overloaded by 19.81% and 51% respectively. The actual flow in this line is 155.75 MW and 196.32 MW. The amount of generation rescheduling required for relieving overload completely is shown in Fig. 4b and 4c.
In Case D, lines 1-3, 3-4 and 4-6 get overloaded by 103.32%, 79.02% and 49.55% due to additional load of 368.42+j164.06 MVA and unavailability of severe line 1-2. The net power violation is 281.637 MW. In this case also the overload is relieved completely by generation rescheduling alone which is shown in Fig.4d. The power flow in the congested lines after congestion management is shown in Figure 5.
Table 4. Performance comparisons of RCGA and SA
Case Net adjustment of generator for congestion management (MW) Total Cost ($/hr)
SA RCGA SA RCGA
A 50.2505 50.5984 1918.8 1837.8
B 32.5969 33.0372 892.117 671.614
C 68.6301 70.4161 2076.5 1721.9
D 112.737 110.9573 3672.7 2737.2
The net value of generation adjustment required for relieving congestion and the total cost incurred for congestion management are summarized in Table 4. For each Case the proposed congestion management problem is solved over 20 independent trials and the best solutions are reported in Table 4.In all cases, the overloads are relieved completely by means of generation rescheduling alone without having any load curtailment. From the case studies carried out, it is apparent that the proposed RCGA method results economical solution than SA.
0 20 40 60 80 100 120 140 160
2--6 4--6 5--7 6--7
Congested line
P
o
w
e
r f
lo
w
(M
W
)
Line f low (BCM)
Line limit Line f low (ACM)
0 100 200 300
0 2 4 6 8x 10
5
no. of generations
F
it
n
e
ss va
lu
e
SA
0 100 200 300
1800 2000 2200 2400 2600
no. of generations
F
it
n
e
ss va
lu
e
Fig.4a. Case A Fig. 4b. Case B
Fig. 4c. Case C Fig. 4d. Case D Fig.4. Amount of generation adjustment for congestion management
Fig.5. power flow status of congested lines-Case D
0 5 10 15 20 25 30 35 40
1 2 3 4 5 6
Generator No.
Δ
PG
k (M
W
)
RCGA SA
-15 -10 -5 0 5 10 15 20 25 30
1 2 3 4 5 6
Generator No.
Δ
PG
k (
M
W
)
RCGA SA
-20 -10 0 10 20 30 40 50 60 70
1 2 3 4 5 6
Generator No.
Δ
PG
k (
M
W
)
RCGA SA
-20 0 20 40 60 80 100
1 2 3 4 5 6
Generator No.
Δ
PG
k
(
MW
)
RCGA
SA
0 50 100 150 200 250 300
1--3 3--4 4--6
Congested line
P
o
w
er flo
w
(M
W
)
Line flow (BCM )
Line limit
5.0. Conclusion
In this paper an attempt is made to explore the use of real coded genetic algorithm to find the optimal generation rescheduling for congestion management in deregulated environment. Congestion may occur in power system due to transmission line outages, generator outages, changes in energy demand and uncoordinated transactions. In this work, N-1 contingency analysis is carried out to identify the most severe lines and those lines are considered for analysis. The proposed problem is formulated as an optimization problem having large number of constraints. RCGA is used as optimization tool since it is an efficient heuristic algorithm for search and optimization. It operates on floating point representation of variables to be optimized. The method has been tested on IEEE 30 bus system successfully. In order to prove the effectiveness of the algorithm it is compared with SA. The simulation results proved that the RCGA yield economical solution than SA for all the test cases thereby enhances system security. Further more the line overloads are relieved completely by generation rescheduling alone without any load curtailment.
References
[1] Alomoush. M. I.; Shahidehpur S. M. (2000): Contingency-constrained congestion management with a minimum number of adjustments in preferred schedules, Int. J. Elect. Power Energy Syst, 22(.4), pp. 277–290.
[2] Alsac. O.; Stott. B. (1974): Optimal load flow with steady-state security, IEEE Trans. Power App. Syst. 93, pp.745-751. [3] Conejo. A. J.; Milano. F.; Bertrand. R. G. (2006): Congestion management ensuring voltage stability, IEEE Trans. Power Syst..
21 (1), pp. 357–364.
[4] Devaraj. D.; Durairaj .S.; Kannan .P.S.(2008): Real parameter Genetic Algorithm to multi-objective reactive power dispatch, International Journal of Power and Energy Systems., 28 (1).
[5] Devaraj. D.; Yegnanarayana. B. (2006): Genetic algorithm based optimal power flow for security Enhancement, IEEE Proc.-Gener. Transm. Distrib. 152, pp. 899-905.
[6] Dutta.S.; Singh S.P. (2008):Optimal Rescheduling of Generators for Congestion Management based on Particle Swarm Optimization,IEEE Trans. on Power System, 23,pp.1560–1569.
[7] Farahani V. Z.; Kazemi .A.; Majd. A.B. (2006): Congestion Management in Bilateral Based Power Market by FACTS Devices and Load Curtailments, IEEE Power India Conference.
[8] Goldberg .D (1989):Genetic algorithms in search, optimization and machine learning ,Addison-Wesley
[9] Hazra .J .; Sinha K.A. (2007): Congestion Management using multi objective Particle Swarm Optimization, IEEE Trans. on Power Syst,.22(4), pp 1726–1734.
[10] Ioannis G.D.; Anastasios G.B.;Petros S. D. (2005): Network-Constrained Economic Dispatch Using Real-Coded Genetic Algorithm, IEEE Trans. on Power systems, 18( 1).
[11] Kumar. A.; Srivastava. S. C.; Singh. S. N. (2005): Congestion management in competitive power market: A Bibliographical survey,
Elect. Power Syst. Res., 76, pp. 153–164.
[12] Magid .Y. L.A.; Abido .M. A. (2003): Optimal Multi objective Design of Robust Power System Stabilizers Using Genetic Algorithms, IEEE Trans. on Power systems, 18(3), pp. 1125-1132.
[13] Talukdar. B. K.; Sinha .A. K.; Mukhopadhyay .S.; Bose. A. (2005): A computationally simple method for cost- efficient generation rescheduling and load shedding for congestion management, Int. J. Elect. Power Energy Syst., 27 (5), pp. 379–388.
[14] Xiao. Y., Peng Wang..; Goel L. (2009): Congestion management in hybrid power markets, Electrical Power Systems research, 79, pp. 1416-1423.
[15] Yesuratnam. G.; Thukaram .D. (2007): Congestion management in open access based on relative electrical distances using voltage stability criteria, Elect. Power Syst. Res., 77, pp. 1608–1618.