Optimum Multilevel Image Thresholding Based on Tsallis
Entropy Method with Bacterial Foraging Algorithm
P.D. Sathya1 and R. Kayalvizhi2 1
Research Scholar, Department of Electrical Engineering, Annamalai University Chidambaram – 608 002, Tamilnadu, INDIA
2
Professor, Department of Instrumentation Engineering, Annamalai University Chidambaram – 608 002, Tamilnadu, INDIA
Abstract
Multilevel image thresholding is an important operation in many analyses which is used in many applications. Selecting correct thresholds is a critical issue. In this paper, Bacterial Foraging (BF) algorithm based on Tsallis objective function is presented for multilevel thresholding in image segmentation. Experiments to verify the efficiency of the proposed method and comparison to Genetic Algorithm (GA) is presented. The experiment results show that the proposed method gives the best performance in multilevel thresholding. The method is also computationally efficient, more stable and can be applied to a wide class of computer vision applications, such as character recognition, watermarking technique and segmentation of wide variety of medical images.
Keywords: Multilevel thresholding, Bacterial foraging algorithm, Tsallis objective function, image segmentation.
1. Introduction
Image segmentation is a process of dividing an image into different regions such that each region is nearly homogeneous, where the union of any two regions is not. It serves as a key in image analysis and pattern recognition and is a fundamental step toward low-level vision, which is significant for object recognition and tracking, image retrieval, face detection, and other computer-vision-related applications [1]. Many segmentation techniques have been proposed in the literature. Among all the existing techniques, thresholding technique is one of the most popular one due to its simplicity, robustness and accuracy [1-3].
Otsu and Kapur methods were proved to be two best thresholding methods for the uniformity and shape measures [4, 5]. However, it is required to determine threshold levels depending on the scene to obtain consistent segmentation results in many cases. Multilevel thresholding techniques were therefore developed. Most
bi-level thresholding methods can easily evolve into multilevel thresholdig methods directly [6]. But, the computational complexity would grow exponentially as the threshold number increases due to their exhaustive searching approach [7, 8], which would limit the multilevel thresholding applications.
Yen et al used a maximum correlation criterion to multilevel thresholding, where the segmentation results are satisfactory and the threshold determination process could be accelerated [7]. Yin proposed algorithm that can determine the number of thresholds automatically as well as save a significant amount of computing time [8]. It appears that approximately all the methods suffered the computational complexity and the segmentation performance instability as the threshold number increases.
To eliminate such problems, evolutionary techniques have been applied in solving multilevel thresholding problem [9, 10]. Peng-Yeng developed a fast scheme multilevel thresholding using genetic algorithms for image segmentation [9]. Shu-Kai et al presented a hybrid optimal estimation algorithm for solving multi-level thresholding problems in image segmentation. The distribution of image intensity is modeled as a random variable, which is approximated by a mixture Gaussian model [10]. However, the method still fails to deal with the common drawback of GAs, the decreasing optimal stability as the convergent speed increases.
function. Then, a particle swarm optimization (PSO) algorithm is
proposed for searching the near-optimal MCET thresholds. However, Ratnaweera et al. state that the lack of population diversity in PSO algorithm is understood to be a factor in their convergence to local optima, which means that it cannot guarantee that the global optima in the search space will be found [12].
This paper proposes the development of a novel optimal multilevel thresholding algorithm, especially suitable for multimodal image histograms, for segmentation of ten benchmarked images, employing bacterial foraging (BF) technique. Bacterial foraging is comparatively a very recent technique that is being used for solving multidimensional global optimization problems [13].
In foraging theory, it is assumed that the objective of the animals is to search for and obtain nutrients in such a fashion that the energy intake per unit time is maximized [13]. This foraging strategy has been formulated as an optimization problem by employing optimal foraging theory. The foraging behavior of E. Coli bacteria includes the methods of locating, handling and ingesting food, has been successfully mimicked to propose a new evolutionary optimization algorithm.
The proposed BF method is used to maximize Tsallis objective function. The method has been compared with particle swarm optimization (PSO) and genetic algorithm (GA) algorithms. The results show that the proposed algorithm can outperform the other two methods both from the point of view of maximizing the objective function as well as maximizing the Peak signal to Noise Ratio (PSNR) value.
2.
The proposed Tsallis multilevel
thresholding method
In this section, a new thresholding method is proposed based on the entropy concept. This method is similar to the maximum entropy sum method of Kapur et al [3]; however the Tsallis non-extensive entropy concept is used for customizing information theory.
Let there be L gray levels in a given image and these gray levels are in the range {0, 1, 2,………,(L-1)}. Then one can define Pi = h(i)/N, (0 ≤ i ≤ (L-1)) where h(i) denotes number of pixels for the corresponding gray-level L and N denotes total number of pixels in the image which is equal
to iL01h(i).
Tsallis bi-level thresholding can be described as
(t)] B q (t).S A q q).S (1 (t) B q S (t) A q argmax[S
f(t)
(1) where
q is an entropic index
q 1 q 1 t 0 i PA)
Pi ( 1 (t) A q S
,
t 10 i Pi A
P
q 1 q 1 Li PB) Pi ( 1 (t) B q S
t ,
L 1t i Pi B
P
.The information measures between the two classes (object and background) are maximized. When SqA(t) is
maximized, the luminance level t is considered to be the optimum threshold value. This can be achieved by a cheap computational effort.
This Tsallis entropy criterion method can also be extended to multilevel thresholding and it is described as follows:
(2) (t)] m q (t)....S C q (t).S B q (t).S A q q).S (1 (t) m q S ... (t) C q S (t) B q S (t) A q argmax[S f(t)
where
q 1 q 1 1 t 0 i PA)Pi ( 1 (t) A q S , 1 1 t 0 i Pi A P q 1 q 1 2 t 1 t i PB)
Pi ( 1 (t) B q S , 1 2 t 1 t i Pi B P q 1 q 1 3 t 2 t i PC)
Pi ( 1 (t) C q S , 1 3 t 2 t i Pi C P .... q 1 q 1 L m t
i Pm) Pi ( 1 (t) m q S , L 1
m t i Pi m
The aim of this proposed PSO algorithm is to maximize the Tsallis objective function using equation (2).
3. Bacterial Foraging Algorithm
3.1 A Brief Overview
It is the law of nature that species with good foraging strategies survive while those with poor searching ability are either eliminated or shaped into good ones. This is because the former is more likely to enjoy reproductive success by producing better species in future generations. This activity of foraging led the researchers to use it as an optimization process. The foraging behavior of E. Coli
(bacteria present in intestines) can be explained by four processes namely, chemotaxix, swarming, reproduction, elimination and dispersal which are described below.
a) Chemotaxis: An E. coli bacterium can move in two different ways: it can swim or it can tumble. The bacterium moves in a specified direction during swimming and during tumbling it does not have a set direction of movement and there is little displacement. Generally, the bacterium alternates between these two modes of operation in its entire lifetime. This alternation between the two modes enables the bacteria to move in random directions and search for nutrients.
b) Swarming: Once one of the bacteria reaches the desired food location, it should attract other bacteria so that they converge at the desired location. To achieve this, a penalty function based upon the relative distances of each bacterium from the fittest bacterium is added to the original objective function. Finally, when all the bacteria have merged into the solution point the penalty function becomes zero. The effect of swarming is to make the bacteria congregate into groups and move as concentric patterns with high bacterial density.
c) Reproduction: The original set of bacteria after several chemotaxis stages undergoes the reproduction stage where the bacteria are split into two groups. The least healthy bacteria die and the other healthiest bacteria split into two at the same location thus ensuring that the population of the bacteria remains constant.
d) Elimination and Dispersal: An unforeseen event may cause the elimination of a set of bacteria and/or disperse them to a new environment. This helps in reducing the probability of being getting trapped in local minima.
3.2 The BF Algorithm
The algorithm is discussed here in brief. Step1: Initialization
i. Number of bacteria (S) to be used for finding the minima.
ii. Number of parameters (p) to be optimized. iii. Specifying the location of the initial set of
bacteria.
iv. Nc is the number of chemotactic steps taken by
each bacterium before reproduction.
v. Ns is the maximum number of steps taken by each
bacterium when it moves from low nutrient area to high nutrient area.
vi. Nre and Ned are the number of reproduction and
elimination dispersal events.
vii. Ped is the probability of elimination and dispersal.
viii.Random swim direction vector ∆(i) and run length vector C(i).
Step2: Iterative algorithm for optimization
The algorithm begins with the calculation of objective value using equation (2) for the initial bacterial population inside the innermost chemotaxis loop. Any ith bacteria at the jth chemotactic, kth reproduction and lth elimination stage is θi (j,k,l) and its corresponding objective value is given by J1(i,j,k,l). The algorithm works as follows:
1. Starting of the Elimination-dispersal loop
2. Starting of the Reproduction loop
3. Starting of the chemotaxis loop
a) i = 1, 2, ...S, calculate J1 ( i, j, k, l)
b) J1 ( i, j, k, l) is served as J1last so as to compare with other
J1 values.
c) Tumble: Generate a random vector Δ(i) with each element Δn(i), m = 1,2, … , P, a random number on [-1, 1].
d) Move:
) ( ) ( T
) Δ( ) C( ) ( ) (
i i
i i
j,k,l i 1,k,l j i
This results in a step size C(i) in the direction of the tumble for ith bacterium.
e) Calculate J1 ( i, j+1, k, l)
f) Swim
Let n = 0 (counter for swim length) While n<Ns
n=n+1;
If J1 ( i, j+1, k, l) < J1last then J1last = J1 ( i, j+1, k, l) and
) ( ) ( T
) Δ( ) C( ) ( ) (
i i
i i
j,k,l i 1,k,l j i
Else n = Ns
g) Go to the next bacterium (i+1) till all the bacteria undergo chemotaxis.
4. If j<Nc, go to step 3 and continue chemotaxis since the
life of bacteria is not over else go to the reproduction stage.
5. Reproduction:
a) For the given k and l, and for each i = 1, 2, 3, ... S, let
1 c N
) J( health
J
1 j
i,j,k,l i
be the health of ith bacterium.
The bacteria are stored according to ascending order
ofJihealth.
b) The bacteria with the highest Jihealth values die and
other bacteria with minimum values split and the copies that are made are placed at the same location as their parent.
6. If k < Nre, go to step 2 to start the next generation in the
chemotactic loop else go to step 7.
7. Elimination - dispersal: For i = 1, 2, ... S a random number (rand) is generated and if rand ≤ Ped, then that
bacterium gets eliminated and dispersed to a new random location, else the bacterium remains at its original location.
8. If l < Ned go to step 1 else stop.
4. Experimental Results and Analysis
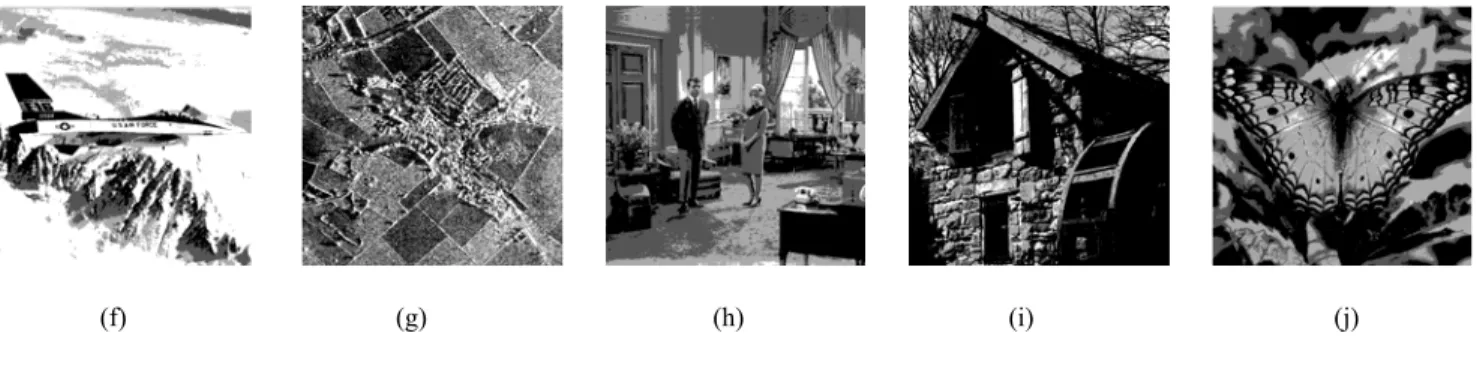
In this section, the performances of the following methods are evaluated: Tsallis based BF, PSO and GA methods. All the experiments were performed on a P4 3GHz with 2GHz RAM. Benchmark images namely Lenna, Pepper, Baboon, Hunter, Cameraman, Airplane, Map, Living room, House and butterfly used for the experiment are gathered in Figure 1 with their histograms.
(a) (b) (c) (d) (e)
(f) (g) (h) (i) (j)
Fig. 1 Test Images and their histograms
Table 1: Objective values and their optimal threshold values by using BF, PSO and GA methods
Test Images m Objective values Optimal threshold values
BF PSO GA BF PSO GA
LENNA
2 0.8889 0.8889 0.8889 120,164 120,164 120,164
3 1.296278 1.296268 1.296247 81,124,178 110,149,187 98,159,181
4 1.654271 1.654255 1.654208 85,124,161,193 85,118,164,200 86,120,151,205 5 1.995787 1.995773 1.995717 76,108,136,164,193 86,117,142,166,196 95,130,152,173,200
PEPPER
2 0.8889 0.8889 0.8889 82,154 82,154 82,154
3 1.296278 1.296274 1.296262 86,118,190 93,133,179 75,103,182
4 1.654264 1.654248 1.654225 71,121,161,197 73,121,141,176 73,109,141,193 5 1.995771 1.995766 1.995739 70,109,139,169,197 78,111,141,169,198 78,105,139,168,200
BABOON
2 0.8889 0.8889 0.8889 91,147 91,147 91,147
3 1.296284 1.296274 1.296202 111,148,188 108,155,181 111,136,193
4 1.654266 1.654262 1.654241 75,114,146,175 62,115,144,174 94,125,152,177 5 1.995744 1.995737 1.995708 78,106,136,157,179 84,110,132,153,175 90,116,139,159,180
HUNTER
2 0.8889 0.8889 0.8889 94,137 94,137 94,137
3 1.296270 1.296267 1.296227 82,118,171 83,143,174 87,147,173
4 1.654258 1.654255 1.654240 71,110,142,182 78,109,143,187 90,119,150,191 5 1.995766 1.995720 1.995713 65,93,123,150,182 70,103,139,174,198 79,114,144,174,198
CAMERA MAN
2 0.8889 0.8889 0.8889 120,154 120,154 120,154
3 1.296189 1.296180 1.296141 78,128,178 78,121,173 81,143,170
4 1.654190 1.654183 1.654177 91,123,156,211 82,122,154,201 76,116,148,202 5 1.995674 1.995669 1.995663 70,107,134,158,200 78,110,133,159,199 88,118,143,169,205
AIRPLANE
2 0.8889 0.8889 0.8889 72,153 72,153 72,153
3 1.296223 1.296204 1.296180 99,143,193 98,134,192 89,148,172
4 1.654277 1.654262 1.654243 68,103,135,182 85,117,153,180 79,111,153,173 5 1.995795 1.995784 1.995768 61,94,121,150,185 75,107,134,157,185 73,98,131,162,192
MAP
2 0.881206 0.881206 0.881206 114,176 114,176 114,176
3 1.273982 1.267481 1.232429 84,142,198 90,131,183 80,145,172
4 1.587902 1.585544 1.579716 73,113,156,203 78,121,158,189 80,117,157,199 5 1.828422 1.818369 1.788800 75,112,147,174,206 79,113,142,170,191 91,118,144,174,206
LIVING ROOM
2 0.888881 0.888881 0.888881 81,144 81,144 81,144
3 1.296281 1.296275 1.296255 89,143,197 91,137,198 88,117,178
4 1.654263 1.654247 1.654244 67,107,145,186 87,126,165,200 90,126,158,199 5 1.995743 1.995701 1.995627 72,111,139,164,199 71,125,150,176,205 69,126,157,182,204
HOUSE
2 0.888761 0.888761 0.888761 87,145 87,145 87,145
3 1.296092 1.296090 1.296052 88,133,199 90,133,199 82,123,177
4 1.653630 1.653586 1.653581 67,105,146,189 70,112,152,189 73,111,151,189 5 1.994217 1.993744 1.993426 66,95,121,155,200 70,104,134,160,212 60,99,114,158,198
BUTTERFLY
2 0.888825 0.888825 0.888825 97,136 97,136 97,136
3 1.296202 1.296190 1.296168 99,135,197 100,135,185 89,124,169
4 1.653424 1.652617 1.652564 95,120,144,189 89,122,143,178 94,121,141,179 5 1.994823 1.991453 1.989359 89,114,141,170,213 70,107,134,162,189 70,119,140,170,214
(f) (g) (h) (i) (j)
Fig. 2 Segmented images of multilevel thresholding for m = 3
[(a) Lena, (b) Pepper, (c) Baboon, (d) Hunter, (e) Cameraman, (f) Airplane, (g) Map, (h) Living Room, (i) House, (j) Butterfly]
Table 2: PSNR value, CPU time and standard deviation value obtained by BF, PSO and GA methods
Test Images m PSNR (db) CPU Time Standard Deviation
BF PSO GA BF PSO GA BF PSO GA
LENNA
2 15.2419 15.2419 15.2419 3.0218 3.6810 3.9219 0.0000 0.0000 0.0000
3 17.4715 17.1425 16.9455 3.5327 4.0357 4.3906 1.6827e-006 2.5418e-006 3.8999e-006
4 19.5070 19.4324 19.0207 4.0310 4.7523 4.8438 3.4304e-006 1.3306e-005 1.9104e-005
5 20.9916 20.5637 19.8703 4.5275 4.9900 5.2854 4.5355e-006 1.6797e-005 2.7208e-005
PEPPER
2 12.9108 12.9108 12.9108 3.0531 3.5394 3.9844 0.0000 0.0000 0.0000
3 16.6563 16.0269 15.5628 3.2310 3.5473 3.9919 2.8014e-006 7.3578e-006 2.0199e-005
4 19.2433 16.7109 16.3735 4.1089 4.4063 5.0938 1.6217e-005 7.0094e-005 1.7406e-004
5 20.4910 20.2089 19.7642 4.5213 4.8484 5.2314 2.0208e-004 6.3010e-004 1.1678e-003
BABOON
2 13.1404 13.1404 13.1404 3.1028 3.5021 3.8906 0.0000 0.0000 0.0000
3 18.1076 17.0809 16.7728 3.7452 4.2591 4.4422 2.9078e-006 9.3397e-006 1.2993e-005
4 17.5204 17.1462 17.1583 3.9303 4.3365 4.5156 3.4997e-006 7.2225e-006 1.3714e-005
5 18.7616 18.2718 17.2903 4.8614 5.4188 5.8281 9.7325e-006 1.1321e-005 1.8993e-005
HUNTER
2 11.3848 11.3848 11.3848 3.0106 3.6970 3.9797 0.0000 0.0000 0.0000
3 14.5772 14.5135 14.0724 3.5624 4.0130 4.3906 4.6660e-007 1.8965e-006 1.0060e-005
4 16.2874 15.4496 14.1926 4.1200 4.6875 4.7031 1.8203e-006 4.2172e-006 1.0886e-005
5 17.3380 16.6426 15.6197 4.4226 5.0009 5.4688 5.4613e-005 1.2255e-004 9.3619e-004
CAMERAMAN
2 10.6258 10.6258 10.6258 2.5690 3.0021 3.6482 0.0000 0.0000 0.0000
3 15.6856 14.9951 14.5900 3.1250 3.7658 4.3906 4.7916e-006 5.4543e-006 8.4892e-006
4 16.7835 15.9187 14.9756 3.9253 4.6188 4.8594 3.6715e-005 7.5181e-005 1.1024e-004
5 17.8802 17.2393 16.6026 4.3906 5.1343 5.6026 6.6163e-005 1.0319e-004 7.7199e-004
AIRPLANE
2 13.7290 13.7290 13.7290 2.9632 3.3159 3.8921 0.0000 0.0000 0.0000
3 15.8742 15.5913 14.6681 3.3310 3.7625 4.1358 8.3154e-007 3.1114e-006 6.9412e-006
4 16.3276 15.6294 14.9701 3.9259 4.8750 5.2656 9.5166e-007 2.6305e-006 9.2004e-006
5 17.6049 17.6077 16.1579 4.7410 5.2813 5.6077 5.1122e-006 3.3007e-005 6.3861e-005
MAP
2 16.6045 16.6045 16.6045 2.7942 3.3221 3.6563 0.0000 0.0000 0.0000
3 18.4286 18.0419 16.2161 3.2771 3.7969 4.1563 5.6090e-007 1.0167e-006 4.6714e-006
4 20.6499 19.7997 19.7340 3.6104 4.0213 4.5744 5.0556e-004 1.1493e-003 3.9730e-003
5 22.1638 21.8968 21.5746 3.9885 4.5873 4.9810 6.5988e-004 8.1623e-003 1.6169e-002
LIVING ROOM
2 13.1208 13.1208 13.1208 3.1406 3.6250 3.9531 0.0000 0.0000 0.0000
3 17.1198 16.9810 16.5873 3.5769 3.9139 4.3417 1.6980e-006 6.9103e-005 7.0160e-004
4 19.2320 18.8655 18.5189 3.9139 4.3964 4.7602 4.3245e-006 8.4404e-006 2.2951e-005
5 21.3385 20.9931 20.5597 4.0251 4.6421 5.1715 4.3515e-005 9.3293e-005 1.8187e-004
HOUSE
2 12.9865 12.9865 12.9865 2.9117 3.2563 3.7656 0.0000 0.0000 0.0000
3 14.0213 13.8104 13.6918 3.3437 3.8884 4.2736 2.5025e-006 4.3646e-005 6.9786e-005
4 16.8884 16.4428 16.1794 3.8074 4.4620 4.8655 3.7689e-006 8.7702e-005 1.1385e-004
5 17.5635 16.7719 16.5772 4.5114 4.9437 5.4353 7.5181e-005 9.5166e-005 1.2255e-004
BUTTERFLY
2 13.0516 13.0516 13.0516 3.1406 3.7344 4.1406 0.0000 0.0000 0.0000
3 18.1337 17.8316 17.2964 3.5746 4.1980 4.5607 1.4899e-006 4.8520e-005 8.5774e-004
4 20.0356 18.9792 18.8382 4.0356 4.6370 5.0254 1.9529e-005 6.7992e-004 1.3908e-005
(a) (b) (c) (d) (e)
(f) (g) (h) (i) (j)
Fig. 3 Segmented images of multilevel thresholding for m = 5
[(a) Lena, (b) Pepper, (c) Baboon, (d) Hunter, (e) Cameraman, (f) Airplane, (g) Map, (h) Living Room, (i) House, (j) Butterfly]
The proposed multilevel thresholding technique using BF is implemented with the following parameters: Number of bacterium (s): 20, Number of chemotatic steps (Nc): 10,
Swimming length (Ns): 10, Number of reproduction steps
(Nre): 4, Number of elimination of dispersal events (Ned):
2, In Tsallis objective function, the parameter q is chosen as 4.
Several aspects would be tested: (1) the multilevel thresholding results of different methods (2) the objective values for different methods (3) the stability of different methods (4) Peak to Signal Ratio (PSNR) value.
The multilevel thresholding is applied to methods aforementioned to experiment their respective effects. Objective values and their thresholds obtained by different methods are listed in Table 1. Multilevel thresholding segmentation results depend on the objective function selected. The higher value of objective function indicated the better segmentation. It is observed that the results by the proposed method are better than others.
Segmented images of Tsallis-BF by m = 3 and 5 are shown in Figures 2 and 3 respectively. The segmentation is better when m = 5 is chosen than by choosing m = 3.
The PSNR value, CPU time and the standard deviation value obtained by different methods are listed in Table 2. PSNR value is calculated as follows:
) RMSE
255 ( 10 20log PSNR
where
2 j)] (i, M
1 i
N
1
j [I(i,j) I MN
1
RMSE
The higher value of PSNR means that the quality of the thresholded image is better. For all the images, the performance of the proposed method is better than the PSO and GA, since their objective value and PSNR measure are higher. It is also observed from the table that compared with PSO and GA methods, the BF method shorten the CPU time significantly. The standard deviation value obtained by the proposed method is lower than the other two methods which show the stability of the proposed method.
5. Conclusion
ten standard test images and the segmentation results are superior to those obtained by applying the Tsallis-BF algorithm. Experimental results show that the BF algorithm converges faster than the PSO and GA and provides better stability. In addition, the new algorithm provides better quality in visualization by obtaining maximum PSNR value. Furthermore, the proposed method is also suitable for other types of images.
References
[1] N. Pal, and S. Pal, “A review on image segmentation techniques, Pattern Recognition”, Vol. 26, No. 9, 1993, pp. 1277-1294.
[2] F.H.Y. Chan, F.K. Lam, and H. Zhu, “Adaptive thresholding by variational method”, IEEE Trans. Image Process., Vol. 7, No. 3, 1998, pp. 468-473. [3] P. K. Sahoo, S. Soltani, and A.K.C. Wong, “A survey
of thresholding techniques “, Comput. Vis. Graph. Image Process. , Vol. 41, 1988, pp. 233-260.
[4] N. Otsu, “A threshold selection method from gray level histograms”, IEEE Transactions on Systems, Man and Cybernetics SMC Vol. 9, No. 1, 1979, pp. 62-66.
[5] J.N. Kapur, P.K. Sahoo, and A.K.C. Wong, “A new method for gray-level picture thresholding using the
entropy of the histogram”, Computer Vision, Graphics and Image Processing, Vol. 29, No. 3, 1985, pp. 273-285.
[6] T. Pun, “A new method for grey level picture thresholding using the entropy of the histogram”, Signal Processing, Vol. 2, 1980, pp. 223-237.
[7] J.C. Yen, F.J. Chang, “A new criterion for automatic multilevel thresholding”, IEEE Trans. Image Process., Vol. 4, No. 3, 1995, pp. 370-378.
[8] P.Y. Yin, L.H. Chen, “A fast iterative scheme for multilevel thresholding methods”, Signal Process., Vol. 60, No. 2, 1997, pp. 305-313.
[9] Peng-Yeng Yin, 1999. A fast scheme for multilevel thresholding using genetic algorithms. Signal Processing 72, 85-95.
[10]Shu-Kai, S., Fan, & Yen Lin, 2007. A multilevel thresholding approach using a hybrid optimal estimation algorithm. Pattern Recognition 28, 662-669.
[11]P.Y. Yin, “Multilevel minimum cross entropy threshold selection based on particle swarm optimization algorithm”, Appl. Math. Comput., Vol. 184, No. 2, 2007, pp. 503-513.
[12] A. Ratnaweera, S.K. Halgamuge, and H.C. Watson,
“Self-organizing hierarchical particle swarm optimizer with time varying acceleration coefficients”, ITTT Trans. Evol. Comput. Vol. 8, No. 3, 2004, pp. 240-255.
[13]Kevin. M. Passino, “Biomimicry of bacterial foraging for distributed optimization and control”, IEEE Control Systems Magazine, Vol. 6, 2002, pp. 52-67.