Vanessa Gabrielle di Lego Gonçalves
Mortality among Brazilian Air Force Officers
2 Vanessa Gabrielle di Lego Gonçalves
Mortality among Brazilian Air Force Officers
Dissertação apresentada ao curso de Mestrado em Demografia do Centro de Desenvolvimento e Planejamento Regional da Faculdade de Ciências Econômicas da Universidade Federal de Minas Gerais, como requisito parcial à obtenção do Título de Mestre em Demografia.
Orientador: Prof. Dr. Cássio Maldonado Turra Coorientador: Prof. Dr. Cibele Cesar
Belo Horizonte, MG
3 Ficha Catalográfica
G635m
2014
Gonçalves, Vanessa Gabrielle di Lego.
Mortality among Brazilian Air Force officers [manuscrito] / Vanessa Gabrielle di Lego Gonçalves. – 2014.
47 f. : il., gráfs. e tabs.
Orientador: Cássio Maldonado Turra. Coorientadora: Cibele Cesar.
Dissertação (mestrado) - Universidade Federal de Minas Gerais, Centro de Desenvolvimento e Planejamento Regional.
Inclui bibliografia.
1. Mortalidade por profissões – Brasil – Teses. 2. Crianças – Brasil – Condições sociais – Teses. 3. Força Aérea Brasileira. I. Turra, Cássio Maldonado. II.Cesar, Cibele. III. Universidade Federal de Minas Gerais. Centro de Desenvolvimento e
Planejamento Regional. IV. Título.
CDD: 304.64
5 AGRADECIMENTOS
Mais uma etapa cumprida. Como todo grande empreedimento humano que lhe trascende os esforços próprios e lhe traz por vezes caminhos tortuosos, percorrê-lo é chegar a mais um fim com a única e absoluta certeza de que não seria possível fazê-lo sozinho.
Agradeço primeiramente à Força Aérea Brasileira e particularmente ao Maj. Brig. Méd. Jorge Marones de Gusmão, diretor da Direção de Saúde da Aeronáutica (DIRSA), não somente pelo acesso a informação e apoio indispensáveis para o desenvolvimento dessa pesquisa, mas também pelas conversas incansáveis em que o geist militar em sua absoluta totalidade me guiaram para análises mais profundas a respeito do que os dados me mostravam. À Sgt. Marcelle, pela sua cooperação e auxílio fundamentais para percorrer os sistemas de informação da Aeronáutica e coletar os dados necessários para levar a pesquisa adiante. Sem o seu constante e prestativo apoio certamente não seria possível acessar uma magnitude tão grande de informação em tempo hábil para finalizar a dissertação.
6 dissertação mesmo em um prazo tão curto. À FAPEMIG, por ter me concedido o apoio financeiro ao longo do mestrado, possibilitando a dedicação exclusiva e necessária para a conclusão do trabalho.
A todos os professores, colegas, secretários e secretárias, e todos que fazem parte da família Cedeplar. Cada um contribuiu a seu modo para a minha formação enquanto aspirante a demógrafa e serei eternamente grata por isso.
Aos amigos que sempre, mesmo distantes, estão por perto: Thania Furbino, Lucas Cunha, Pedro Pinheiro Chagas, Maria Luísa Lucas, Bruna Barros.
Aos amigos que fiz no mestrado, em especial, Vinícius Prado Monteiro, Jenny Garcìa, Andrea Idelga Fernand e Fátima Lage, entre tantos outros. Certamente vocês tornaram esse caminho menos árduo.
Aos meus pais, que sempre me fizeram acreditar que eu era capaz de muito mais do que eu mesma sempre achei; obrigada por todo o apoio incondicional.
7 If we knew what it was we were doing, it would not be called research, would it?
8 RESUMO
Os objetivos desse estudo são (1) estimar o nível de mortalidade masculina para as coortes de oficiais da Força Aérea Brasileira que ingressaram na instituição entre os anos 1947-1960 e foram observados até Junho de 2013; (2) comparar essas estimativas com as taxas nacionais de mortalidade masculina e (3) analisar alguns fatores associados à sobrevivência desses militares. Esses oficiais não apenas são selecionados através de um processo rigoroso com elevados critérios psicológico, cognitivo, físico e de saúde, como também mantêm um treinamento rígido em um ambiente controlado ao longo da sua formação. Uma vez graduados, a instituição demanda exames periódicos anuais de saúde, oferece recursos médicos de alta qualidade para o militar e para a sua família, bem como lhes oferece suporte estrutural, tal como auxílio a moradia. Logo, isso leva a 2 hipóteses principais: (1) o nível de mortalidade desses oficiais é menor do que o esperado para um homem brasileiro médio; (2) aspectos que influenciam a mortalidade adulta, tal como diferentes origens socioeconômicas evidenciados por alguns estudos, não afetam esses oficiais, devido à sua prolongada exposição a um ambiente favorável. Logo, para testar a primeira hipótese taxas de mortalidade são estimadas e comparadas com a tabela de vida brasileira correspondente, bem como com países que reconhecidamente experimentam baixa mortalidade. A segunda hipótese é testada através de regressão de Poisson e curvas de sobrevivência Kaplan-Meier usando a váriavel região de nascimento como uma proxy para origem socioeconômica. Devido à qualidade dos dados militares, estimar o seu nível de mortalidade e compará-lo com a média brasileira poderá não somente melhorar o nosso conhecimento a respeito da mortalidade masculina, como também contribuir para se compreender os limites da expecativa de vida e a influência das condições de vida na infância sobre a sobrevivência em um contexto de país em desenolvimento.
9 ABSTRACT
This study aims to (1) estimate the male mortality level for the cohorts of Brazilian Air Force officers who enrolled in the military between years 1947-1960 and were observed until June 2013; (2) compare those estimates with the national male mortality rates and (3) analyze some factors associated with their survival. Those officers are not only selected through a strict process of recruitment which already involves demanding health, physical, cognitive and psychological criteria, but also maintain a rigid training in an extremely controlled environment. Once they are graduated, the institution requires periodic annual health screening and offers complete medical resources, housing support and other important structural aid both for themselves and their families, even after retirement. Hence, this leads to 2 main hypotheses: (1) their overall mortality level is lower than the expected for an average Brazilian male; (2) aspects which are evidenced by some studies to affect adult mortality, such as different socioeconomic backgrounds, are offset by their long-lasting exposure to a privileged health setting. Thus, we address the first hypothesis by estimating their mortality rates through Poisson regression and later comparing them with the corresponding Brazilian life table and with other countries’ that are known to
present low mortality levels; and address the second hypothesis through Poisson modeling and survival analysis, with the variable place of birth used as an indicator of their socioeconomic background. Due to the reliability and quality of military data, a better understanding of their mortality level relative to average Brazilian males may not only improve our knowledge of male mortality, but also contribute to further understanding the limits to life expectation and the possible influence of early-life conditions on survival in a developing country scenario.
10 SUMMARY
Pag.
Introduction ………10
Historical Background………......15
Military culture and spirit……….. ……17
Data and Methods………...19
1.1 Data………20
1.2 Variables………... 20
1.3 Analytical approach………... 23
Results……….. ….. 23
1.1 Survival by time of follow-up………. 24
1.2 Mortality differentials by age………..... 33
Discussion………...41
11 INTRODUCTION
The mortality advantage of certain population subgroups has attracted increasing attention of social scientists because of the spread of new high quality data and the interest on disentangling the pathways to lower mortality. Earlier research has shown for a large and heterogeneous list of countries, the survival advantage associated with higher income, higher educational attainment, better occupational status (Cutler, D. and Lleras-Muney, A., 2008; Christensen, B. and Johnson, N.,1995), gender (Crimmins, E. and Saito, Y., 2001; Case, A. and Paxson, C., 2005; Norris, K. and Nissenson, A., 2008), race (Elo and Preston, S.H., 1994; David, R.W. and Selina, 2009) and marital status (Zick, C. and Smith, 1991; Goldman, 1993; Waite, L. and Gallagher, M. 2000; Rahman, 1991), just to mention a few of the most well-know factors. All these characteristics relate to mortality through very complex pathway mechanisms. Educational attainment, for example, affects health and mortality through health behaviors, social psychological resources, and access to and utilization of health care (Hoffmann, 2008; Mirowsky and Ross, 2003; Rogers et al. 2000; Williams, 1990). Addressing each one of these mechanisms in detail surpasses the scope of this study and we refer the interested reader to the several excellent articles for a more detailed literaturereview.
12 examined mortality differentials among religious groups. One well-known example is the low mortality levels among members of The Church of Jesus Christ of Latter-day Saints, the Mormons. Breslow (2008) showed that Mormon males can expect to live 9.8 years more than U.S. white males for periods 1989-1991, whereas females had a life expectancy of 86.1, about 5.6 years greater than U.S. white females in 1989-1991. Among the explanations for the mortality advantage of Mormons is the adoption of healthy lifestyles including the abstention from alcohol, tobacco and stimulating drinks, such as coffee or tea, and the use of a balanced diet. Other religious groups that value healthy lifestyles, like Seventh-Day Adventists, also have substantially reduced mortality rates (Hummer et al., 1999; McCullough et al., 2000).
Sometimes, the mortality advantage of some population groups looks surprising and paradoxical. This is the case, for example, of the mortality advantage of Hispanics relative to non-Hispanic whites in the U.S., despite their lower socio-economic status (Palloni and Morenoff, 2001). Several factors are associated with the lower mortality among Hispanics including the selection of healthy immigrants (Turra and Elo, 2007), selective return migration (Abraido-Lanza et al., 1999), data problems (Hummer et al., 2004; Markides and Eschbach, 2005; Palloni and Arias, 2004), as well as cultural and behavioral factors (Eschbach et al., 2004; McDonald and Kennedy, 2004). The mortality advantage of foreign-born groups are not limited to the U.S. and have been reported in Europe as well, including among the Turkish in German and Mediterranean in France (Razum, 2002;Darmon, 2003).
13 Philadelphia were 11% higher than for troops in combat in Iraq. An earlier work from
MacIntyre (1978), using the U.S Navy’s cohort of 800 survivors from World War II and
the Korean conflict showed that pilots experienced not only lower all cause mortality, but also lower mortality from cardiovascular, cancer, and accidental causes when compared to the U.S civilian population. The main explanation, according to the author, was the generally good socioeconomic background of members of the military. He also speculated about the positive genetic influence of long-lived parents, above average intelligence, and the health and fitness orientation of the military aviators (MacIntyre, 1978).
Besides presenting a surprisingly low mortality even in the context of armed conflicts, the military group also challenges some other well-known evidence in the demography field, such as the association of mortality with race, gender, and marital status. For example, four of every five unintentional injury victims of the U.S Armed Forces were white males, with rates about 1.3 times higher than blacks, in years 1980-1993. Female death rates for homicides (6.4 per 100,000) are higher than for males (5.0 per 100,000) during years 1980-1993, not in armed conflict (NIOSH, 1996). A married female serving in a combat troop in Iraq had the most potential to get injured or killed, compared to single women and men, and married servicemen were more likely to be involved in hostile incidents than single servicemen (Ozcan, 2012).The main explanation is the occupational profile and the demands of military duties, especially during conflict. Others also argue that the survival advantage of the military accrues
from a selection bias at enlistment or recruitment, called the ‘healthy soldier effect’
(Mclaughlin, 2008; Shah, 2009), in which the selection of the healthier and fitter results in lower mortality rates. However, the underlying factors that account for the sex differentials in mortality and the controversial effect of marital status are still uncertain.
Other research use military data not specifically to address the surprising survival advantage or mortality determinants of the group, but to approach epidemiologically the
pathways through which more risky and stressful situations affect veterans’ survival or
14 2009; Costa, 2010; Clipp, 1996; Spiro, 1997; Boscarino, 1997). Recent research evidenced that veterans from the American Civil War who experienced greater stress in battle had higher mortality rates at older ages and were at greater risk of developing Post-Traumatic Stress Disorder (Costa, 2010). Some research also uses military data to evaluate the relationship between nutritional status and some anthropometric measures, such as height and weight, and their impact on subsequent mortality levels (Costa and Fogel, 2004; Fogel, 1997; Costa, 2004). Also, some studies examine the effect of specific early-life infections such as stomach ailments, measles, respiratory infections, diarrhea, and tuberculosis on reduced cause-specific longevity by using evidence of the Union Army veterans (Costa, 2003). On those cases, however, the use of military data is more restricted to the reliability and availability of those measures and is not really interested in more closely analyzing the characteristics of the military group.
Little is known about mortality differentials among adults in Brazil. Despite the long lasting effort to produce reliable mortality estimates for the total population by age, sex and main geographic areas, the results are still timid compared to those from other countries. The absence of more detailed information on mortality according to different factors, such as socioeconomic characteristics, is particularly worrying in Brazil, a heterogeneous country where it remains unclear the extent to which the numerous pathways linking mortality with several well established factors operate. In this study, we benefit from reliable mortality data available for Brazilian Air Force officers, to try to fill part of the gap in the literature by looking more closely at the survival of a selected group of Brazilians. We are particularly interested in learning whether this group presents a survival advantage relative to their national counterparts and if despite being a healthy selected male subgroup, others factors are still associated with their survival. For that purpose, we obtained information from 706 male officers who enrolled in the Brazilian Air Force between the years 1947 and 1960. We followed these individuals until 30th June 2013 and recorded information on place of birth and career (pilot or
15 The choice for the variable place of birth is not only due to the availability of that information, but also for addressing the possible influence of early-life conditions on their survival. According to Preston, Hill and Drevenstedt (1998), childhood conditions may influence adult mortality through a physiological, direct mechanism or through a non-physiological, indirect mechanism. These two mechanisms may also be positive or negative. A direct and positive effect is one that has a permanent impact or a scarring effect that influences later health and survival, for example, the influence of having tuberculosis in childhood and higher mortality at later ages. An indirect and negative effect, on the other hand, is acquiring immunity due to exposure to certain diseases in childhood and presenting lower mortality afterward. Some other research focus on the exogenous influences on childhood and their impact on adult mortality, such as economic recessions, climate change and starvation periods (Bengtsson, 2000; Van den Berg, 2007; Van den Berg, 2009; Doblhammer, 2003). Conversely, there is also evidence that other important mid-life factors affect mortality, such as behavior related to tobacco and alcohol abuse and sedentary life styles, sometimes offsetting the influence of earlier life events on old age mortality (Kannisto, 1997; Kannisto, 1994). Since the group of military officers of this research enrolled in the institution Brazilian Air Force (BAF) at relatively young ages (15-24 years old), we use the variable place of birth as a proxy for their childhood conditions, considering the different levels of regional development in Brazil. Because officers are submitted to an extremely controlled environment that offers an overwhelmingly good health, nutritional and physical structures, this study hypothesizes that the working environment may offset the effect of being born in more or less developed regions. In addition, we use the information on career since officers graduate as pilots or administrative officers, and therefore, may be exposed to different mortality risk factors throughout their working lives. Different careers may also indicate different personal characteristics at graduation that can be related to the risk of dying at later ages, such as better health.
16 mortality. All male officers in this database enrolled, graduated and had permanent contact with the Air Force throughout their lives, until their moment of death or end of period study. Further understanding their possibly privileged survival relative to Brazilian males may not only improve our knowledge of male mortality, but also contribute to better acknowledging male life expectation in a developing country scenario (Rosero-Bixby, 2008).
HISTORICAL BACKGROUND
In order to understand the context in which those officers became engaged in the military institution, and thus not only adopted a particular set of behaviors and attitudes, but also were submitted to a particular kind of training, it is important to at least briefly state the historic path of the institution. The history of the Brazilian Air Force (BAF) is connected to the Brazilian historical setting, dating back to 1916, in the context of World War I. Surprisingly the first aviation organization at the time was prompted by the Navy, followed by the Army, in 1919, after the war. For years, the aviation in Brazil was divided between the Navy and the Army, becoming an independent institution only in 1941, also in the context of a war, but this time World War II. At that time the Ministry of Air Force was created by Salgado Filho, in January 1941, as the war in Europe brought the demand of a single force to command the air operations. The aviation albeit split between the Army and the Navy was unified in another institution which was named the National Air Forces. All aircrafts, equipment and personnel were transferred to this newly created operation base. After some months and a request of minister Salgado Filho, the institution was renamed the Brazilian Air Force (INCAER, 1991). Due to the technological requirements that involve the aviation industry, the creation and demand of an Air Force is also aligned to the characteristics of the development of a national
industry. President Getúlio Vargas’ government during the 1930’s was clearly directed
17 allocated. In 1933 the North American company Curtiss Wright Export Corporation came forth as interested in building aircrafts in Brazil, but the plan was not carried on. With later support from President Getúlio Vargas and the assistance of engineer Guedes Munis, an industrial tycoon at the time named Henrique Lages, builds the Fábrica Brasileira de Aviões (Brazilian Aircraft Factory), which for the following years is responsible for providing airplanes particularly for training new pilots, at high demand, due to the war that was in course in Europe. The Ministry of Air Force then buys a fleet of 100 airplanes for basic instruction, in order to train as fast as possible new upcoming pilots. Some other factories were built during that time, mainly on the Southeast region of Brazil, which concentrated not only the highest income, but also the best land and climate possibilities for building and storing aviation equipment. One example is the factory in Galeão, Rio de Janeiro, which was the result of negotiations between the Brazilian Navy and Germany, in which German technicians and projects were sent to Brazil and the constructions of the planes were performed in Rio de Janeiro. Another examples is the factory in Lagoa Santa, Minas Gerais, an initiative of President Getúlio Vargas together with French airplane designer René Couzinet to conduct a Brazilian production of airplanes. Important Brazilian entrepreneurs at the time, together with the Federal Government, decided to build the factory in the city of Lagoa Santa, due to its dry climate, favorable against corrosion, and its distance from the coast area, favorable against enemy attack (Andrade, 1976; Bertazzo, 2003).
By the end of the Second World War in 1945, the Brazilian Air Force industry was capable of building advanced training airplanes and providing both the civil and military local markets with their aircrafts. But as the war ended, and the strong growing belligerent competitive market of the United States and other countries in Europe skyrocketed, the demand for Brazilian private industries’ airplanes decreased and the
18 Aeronautics/ITA), preceded by the Centro Técnico da Aeronaútica (Technical Center of Aeronautics/CTA). Both were pioneering centers of technology primarily organized and directed by Richard Smith, from the Department of Aeronautics Engineering from the Massachusetts Institute of Technology (MIT). Smith brought the necessary knowledge and technological expertise to train forthcoming Brazilian aeronautics engineers. By 1950 ITA was a higher technological study and research center sited at São José dos Campos, in São Paulo, which graduated 800 engineers in aeronautics. The Air Force Academy (AFA) was only formally built in 1969 at Rio de Janeiro and later transferred to Pirassununga, São Paulo, in 1971, where it has been sited until today (Aérea, 2013).
MILITARY CULTURE AND SPIRIT
Apart from the national context at the time of enrollment of those officers, it is also important to note some of the features of the military institution, which guides the particular behavior and mindset of the individual, influencing their choices on all realms of life. For that, the notably and respected anthropological work of Celso Castro (1990; 2000), although directed at another branch of the military force, the Army, reflects with precision the environment in which cadets (military students) live and the culture they embody within the years of formation. His work is particularly important for better understanding the surroundings and origins of the officers of this study, since some of
his research concentrates on the 1940’s and 1950’s through 1960’s. His research
certainly surpasses our objectives here and his work shall be briefly cited, solely in order to explicit some of the cultural and social aspects of military life at the time. The
single most important idea is the application of German sociologist Georg Simmel’s
concept of the value of identity in a “totalizing” social environment as the military one.
19
Another important aspect of Castro’s research is to show how the social origins of
the military changed over time. Throughout the 1940’s 78.8% of the enrolled military in
Brazil were from the bourgeoisie, with some especial participation of the elite (19.8%
were from the traditional higher classes). In the 60’s, however, the participation of the
higher classes decreased to 6%, while the participation of the working class raised from 4% to 9% and the participation of individuals who had a military parent increased from 21% to 35% (Castro, 1990). Those decades were very prestigious and the military were accepted and respected in the most refined social circles at the time, as well as usually considered good partners for marriage. That scenario changed after the dictatorship
period, which altered society’s acceptance of the military institution. The prestige of the
military was also affected by changes in the social structures that conflicted with some of the traditional aspects of the military profession. One example is the increase in women labor force participation, which affected marriage patterns for the military. By the
90’s the military had already lost its prestige before the civil society (Castro, 1990).
Therefore, we can conclude from the earlier works, that the present study deals with individuals who enrolled at a time when the military held an important occupational title and recognized social status in society. They were both from traditional higher classes and the bourgeoisie, but also from the working class, since the cohort being examined
here is composed of individuals who entered the Air Force from the 1940’s until the
1960’s. Also, they probably shared fundamental elements made explicit by Castro, such
20 DATA AND METHODS
1.1. DATA
The data for this study come from the Brazilian Air Force Health Center (DIRSA), where military records are kept on an electronic database for the Air Force pension fund. The access to those records were kindly granted and formally approved by the director of the Center, Brig. Gen. Jorge Marones de Gusmão. The database contains information for officers who are still alive and retired, officers who are already deceased but whose families receive survival benefits, and officers who died on duty and did not support any designated beneficiary in the BAF pension plan. Therefore, we are missing a minority group of individuals who did not die on duty and had no wives and children or whose beneficiaries are also dead. All individuals receive a service identification number in the system, which helps the data managers to keep track of them. Since the BAF pension system demands utmost control due to legal accountability issues within the government, the data are continuously updated and checked, making them particularly reliable when compared to other cohort data in Brazil.
21 1.2. VARIABLES
To measure the mortality patterns among BAF officers, we recorded complete dates of enrollment, birth and death (or end of follow-up, which was set at 30th of June 2013, date of the last system update). We were able to classify deaths into two groups of causes of deaths: deaths during military service (on duty deaths) and other causes of death. We also obtained information on place of birth as of the enrolment date in the BAF, which was categorized according to two main geographic regions: the Northern states located in the northeast, north and center-west parts of Brazil and the Southern states located in the south and southeast parts of the country. Whereas the northern area comprise the least socially and economically developed states of Brazil, the southern area include the wealthiest states.
The individuals enrolled in the 1947-1960 cohorts could follow aviation or administrative careers: We were able to measure those two categories as of the enrollment date. Because we have not data for career shifts during the military service, we assumed that each career was fixed over the observation time. Our hypothesis is that pilots have higher mortality than administrative personnel, due to their riskier occupational profile.
1.3. ANALYTICAL APPROACH
22 during the follow-up period as a function of person years of exposure, age, place of birth and career. By using a Poisson regression model, we are assuming that the distribution of the number of occurrences of the event (death) in a fixed time interval is Poisson with
mean
t
, where λ is the rate of occurrence of the event per unit of time and t isthe length of the time interval. Thus, when the distribution is assumed to follow a Poisson distribution, the regression model is considered a Generalized Linear Model-GLM {Agresti, 2002 #1478}, with a log link :
(1)
i
ln
i
0
1X
i1
2X
i2
...
iX
iThe model allows the addition of an exposure element, where the mean is allowed to vary according to a specific quantity:
E
(
Y
)
i
E
i
. On this case, the exposure is person-years and is denominated the offset of the model. The term is then added to the model, as follows:(2)
ln
ln
E
i
0
1X
iThe parameter of interest is the exponential of the estimates, due to the log link
e
coef
.Each officer’s exposure began at the date of enrollment and terminated at the time
of death or June 2013. We treated age as a continuous variable. Due to the relatively small number of deaths, especially after age 80, we split the records for each officer in our dataset by age groups using the stplit syntax in STATA (Statacorp, 2005). In addition, we censured the follow-up of officers at age 80. We measured age according to seven groups: 15-24, 25-34, 35-44, 45-54, 55-64, 65-74 and 75-79. Both the number of deaths and person-years lived were computed for each age group, for all cohorts together.
23 exploratory analyses, we also tested for the inclusion of interaction terms but they proved to be not statistically significant, and we decided to keep only the additive models.
We used the Poisson regression coefficients to examine the existence of mortality differentials by place of birth and career among the BAF officers. In addition, we predicted age-specific death rates based on the coefficients of first model that controls only for age. We compared the age specific death rates for the BAF officers with male death rates for a selected number of countries which are known for their low levels of mortality and high quality mortality data. The list includes Chile, Sweden, France and Japan. The mortality data for these countries were obtained in HMD (The Human Mortality Database). We also compared our estimates with mortality data for Brazil obtained from IBGE (Instituto Brasileiro de Geografia e Estatística, 2000). The mortality estimates for the selected countries are for the year 2000, because this is the earliest year we were able to get official mortality data for Brazil. 60% of the deaths of the 1947-1960 BAF cohorts occurred between the years 1995 and 2013 and thus, some of the mortality differences may arise from inconsistency in time. To improve our comparative analysis, we also estimated age-specific mortality rates for the Brazilian males born in 1935 (the mean year of birth of the BAF cohorts) using data from the United Nations complete life tables for the years 1950 to 2015. Further, we used the mortality data and life table techniques to estimate truncated life expectancy at age 80 for all populations being considered in the analysis.
RESULTS
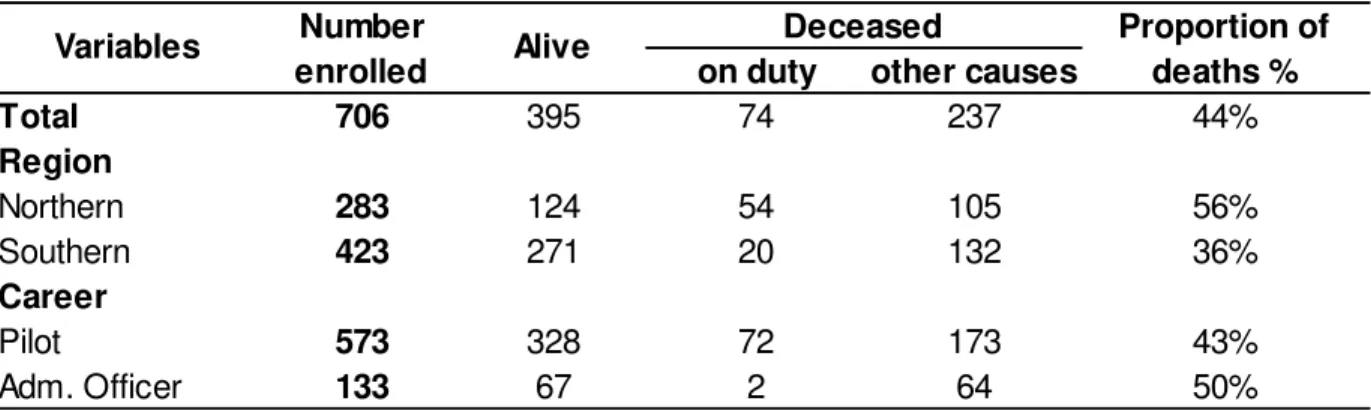
24 of officers who were born on the Northern region of Brazil are deceased, whereas that proportion is of 36% for those who were born on the Southern region. Also, of all causes of death, 13% of on duty deaths occurred to officers born on the Southern region, while 34% of officers born on the Northern region died on duty. As for their careers, of all pilots, deaths occurred to 43%, while that proportion is of 50% for administrative officers. As expected, of all causes of death for pilots, 34% occurred on duty, while that number for administrative officers is 0.03%.
Table 1. Descriptive statistics for all variables
on duty other causes
Total 706 395 74 237
Region
Northern 283 124 54 105
Southern 423 271 20 132
Career
Pilot 573 328 72 173
Adm. Officer 133 67 2 64
36% 43% 50% Alive Variables Number enrolled
Deceased Proportion of deaths %
44%
56%
Source: DIRSA/Air Force Health Center
1.1. SURVIVAL BY TIME OF FOLLOW-UP
25 Figure 1. Kaplan-Meier Survival Curve, BAF, all causes of death
26 When we consider the sample without on duty deaths, the KM curve (Figure 2) shows that survival time is longer. After dropping cases of those who died on duty 50% of the remaining cohort members died by the 65.5th year of follow-up. These results are not surprising since most of the deaths on duty occur in the first decades of the working life. Indeed, the largest difference between the two scenarios is on the 25% first deaths: when considering all causes of death (Figure 1), 25% of the individuals fail by time of analysis 48.07 years, whereas when considering the sample without on duty deaths, 25% of the individuals fail by time 54.07 years. Figure 3 shows the KM survival curves by region of birth for all causes of death. Clearly, the officers born on the most developed regions of Brazil have an overall higher survival than those born on the less developed regions (p-value=0.000).
27 Figure 2. Kaplan-Meier Survival Curve, BAF, without on duty deaths
28 Figure 3. Kaplan-Meier Survival Curves by region of birth, all causes of death
29 The differences in the distribution of survivors by career are not as clear as the differences by place of birth. Figure 5 shows that the proportion of survivors among pilots from all causes of death reduces more rapidly in the first 20 years of observation, but it catches up the proportion of survivors among administrative offices by the year 56.20. In fact, there is a crossover point, after which the proportion of administrative officers alive become lower. Overall, the difference between the two survival curves is not statistically significant (p-value=0.268).
Not surprisingly, deaths on duty are responsible for shaping the survival curves by career. When we fit KM curves without on duty deaths by career (Figure 6), the difference between pilots and administrative workers becomes statistically significant (p-value=0.007), with the proportion of survivors among pilots becoming larger than among administrative officers during most of the observation period: 50% of administrative officers deceased by time 59.76, whereas the median time for pilots did not happen by the end of the follow-up period.
Therefore, despite living in the same environment since very young ages, having similar lifestyles, income and access to health care, we still found mortality differentials among the subgroups of officers that arise from epidemiologic and socioeconomic conditions that are related to the place of birth. The type of career also plays a role, as pilots have higher risk of dying from on duty causes, but they appear to carry a health advantage for older ages, compared to administrative officers.
30 Figure 4. Kaplan-Meier Survival Curve by region, BAF, without on duty deaths
31 Figure 5. Kaplan-Meier Survival Curves by Careers, BAF, all causes of death
32 Figure 6. Kaplan-Meier Survival Curve by Careers, BAF, without on duty deaths
33 1.2. MORTALITY DIFFERENTIALS BY AGE
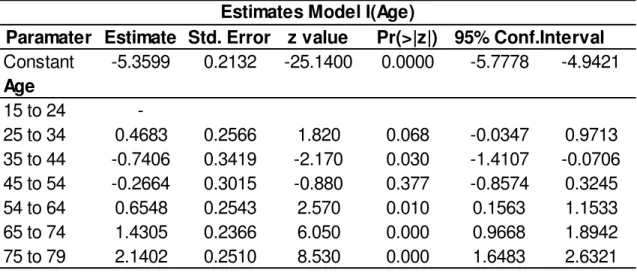
In the second part of our analysis, we examine age specific mortality rates fitting Poisson regression models. Table 2 presents the results for the first model that accounts only for age (Model 1).
Using the coefficients in Model 1 we predicted age-specific mortality rates for the BAF cohort and compared them with the mortality rates for the other populations: Sweden, Chile, France, Japan and Brazil (Figure 7). The concentration of on duty deaths at younger ages makes the death rates higher at age groups 15-24 and 25-34 in the BAF cohorts than in any other population. Of course, the difference is biased upwards since members of the BAF cohorts experienced these mortality rates about 40 to 60 years ago, while for the other population death rates are for the year 2000. The age-specific mortality rates are still higher for the BAF officers than in the Brazilian cohort, suggesting that the risk of dying on duty was not trivial, despite the fact that Brazil was not on war during this time. After the age of 55, the mortality rates for BAF officers become comparable and even lower than those for populations known for experiencing the lowest mortality levels in the world. These results suggest a high degree of health selection among BAF officers in Brazil.
Table 2. Poisson Regression Estimates by Age only
Paramater Estimate Std. Error z value Pr(>|z|) 95% Conf.Interval
Constant -5.3599 0.2132 -25.1400 0.0000 -5.7778 -4.9421
Age
15 to 24
-25 to 34 0.4683 0.2566 1.820 0.068 -0.0347 0.9713
35 to 44 -0.7406 0.3419 -2.170 0.030 -1.4107 -0.0706
45 to 54 -0.2664 0.3015 -0.880 0.377 -0.8574 0.3245
54 to 64 0.6548 0.2543 2.570 0.010 0.1563 1.1533
65 to 74 1.4305 0.2366 6.050 0.000 0.9668 1.8942
75 to 79 2.1402 0.2510 8.530 0.000 1.6483 2.6321
34 Figure 7. Age-specific male mortality rates, Sweden (2000), Chile (2000), France (2000), Japan (2000), Brazil
(2000), Brazil cohort and BAF (cohort)
35 In order to get a better understanding of differences in mortality patterns across the populations compared in our analysis, we also estimated mortality ratios for ages 45 and above assuming the age specific mortality rates for Sweden as the standard. The closer the ratio is to the value of one, the closer the mortality of that given population in a certain age group is to Sweden’s mortality rate. As shown in Figure 8 the mortality
36
Figure 8. Mortality Ratios between each country’s rate and Sweden’s rate as pattern.
37 Table 3. Male life expectanciesfor BAF, Sweden, Brazil and Brazil cohort
Age BAF Sweden Brazil Brazil cohort
45 30.25 30.43 25.68 25.91
55 21.16 21.22 17.85 18.58
65 12.67 12.57 10.73 11.60
75 4.33 4.46 4.04 4.38
Male Life Expectancies
Source: HMD/ Human Mortality Database, available at http://www.mortality.org/ .IBGE/ Instituto Brasileiro de Geografia e Estatística, male life tables available at http://www.ibge.gov.br/ . DIRSA/Air Force Healh Center
While a BAF officer expects to live another 30.25 years at age 45, an average Brazilian expects to live 25.68 years according to period life table (year 2000) and 25.91 years, when considering the cohort data.
One should be careful when comparing our estimates with those from other populations since our sample is small and there is large statistical uncertainty. Table 4 shows the predicted death rates using the lower and upper bounds for the 95% confidence interval. The ratio of mortality rates in the upper bound to mortality rates in the lower bound can be as high as 8 for the age group 35-44 and as low as 2.29 for the age group 15-24. We also fit Poisson models to assess the joint effects of age, region of birth and career on death rates. Our multivariate analyses account for all deaths. All estimates were performed in STATA (Statacorp, 2005).
38 Table 4. BAF Age-Specific Mortality Rates
nmx
Age Median Lower Upper
15 0.0047 0.0031 0.0071
25 0.0075 0.0030 0.0189
35 0.0022 0.0008 0.0067
45 0.0036 0.0013 0.0099
55 0.0090 0.0036 0.0226
65 0.0197 0.0081 0.0475
75 0.0400 0.0161 0.0993
95% Confidence Interval BAF Age-Specific Mortality Rates
39 Table 5. Male Mortality Rates and Ratios (Sweden as the Standard)
RATE RATIO RATE RATIO RATE RATIO RATE RATIO RATE RATIO RATE RATIO
0.003 0.831 0.005 1.607 0.006 1.768 0.004 1.177 0.010 3.007 0.012 3.814 0.009 1.069 0.012 1.501 0.011 1.348 0.009 1.071 0.018 2.207 0.020 2.426 0.020 0.832 0.031 1.298 0.025 1.065 0.022 0.941 0.037 1.556 0.035 1.499 0.042 0.824 0.059 1.153 0.050 0.967 0.046 0.887 0.064 1.239 0.056 1.094
75
Male Mortality Rates and Ratios-Sweden as Pattern
Age
45 55 65
BAF Chile France Japan Brazil Brazil Cohort
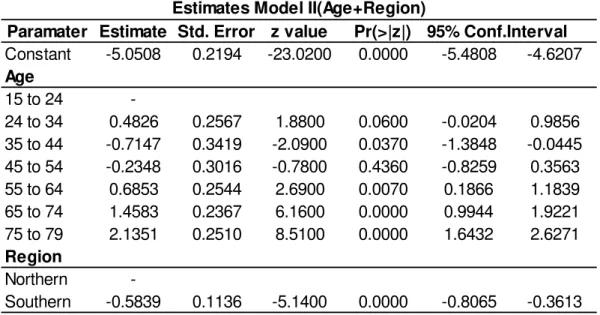
40 Table 6. Poisson Regression Estimates by Age and Region
Paramater Estimate Std. Error z value Pr(>|z|) 95% Conf.Interval Constant -5.0508 0.2194 -23.0200 0.0000 -5.4808 -4.6207 Age
15 to 24
-24 to 34 0.4826 0.2567 1.8800 0.0600 -0.0204 0.9856
35 to 44 -0.7147 0.3419 -2.0900 0.0370 -1.3848 -0.0445 45 to 54 -0.2348 0.3016 -0.7800 0.4360 -0.8259 0.3563
55 to 64 0.6853 0.2544 2.6900 0.0070 0.1866 1.1839
65 to 74 1.4583 0.2367 6.1600 0.0000 0.9944 1.9221
75 to 79 2.1351 0.2510 8.5100 0.0000 1.6432 2.6271
Region
Northern
-Southern -0.5839 0.1136 -5.1400 0.0000 -0.8065 -0.3613 Estimates Model II(Age+Region)
Table 7. Poisson Regression Estimates by Age, Region and Occupation (Career)
Paramater Estimate Std. Error z value Pr(>|z|) 95% Conf.Interval Constant -5.064045 0.2207 -22.9500 0.0000 -5.4966 -4.6315 Age
15 to 24
-25 to 34 0.4787 0.2567 1.8600 0.0620 -0.0245 0.9819
35 to 44 -0.7194 0.3420 -2.1000 0.0350 -1.3898 -0.0491 45 to 54 -0.2392 0.3017 -0.7900 0.4280 -0.8305 0.3521
55 to 64 0.6810 0.2545 2.6800 0.0070 0.1822 1.1799
65 to 74 1.4548 0.2367 6.1500 0.0000 0.9908 1.9188
75 to 79 2.1314 0.2511 8.4900 0.0000 1.6392 2.6235
Region
Northern
-Southern -0.5834 0.1136 -5.1400 0.0000 -0.8060 -0.3607 Ocupation
Pilot
-Adm 0.0807 0.1388 0.5800 0.5610 -0.1912 0.3527
41 DISCUSSION
In this study we examined mortality estimates for the cohort of Brazilian Air Force officers who enrolled in the military between years 1947 and 1960. The BAF officers is a selected group of Brazilian men who has been exposed to a healthy and well structured setting since the moment they enroll in the military institution. Therefore, were brought forth two main hypotheses for our study: (1) BAF officers experience lower mortality levels than the average Brazilian male, but have risks of dying that are comparable to the populations living in countries with much lower mortality levels; (2) factors that typically affect adult mortality such as different socioeconomic backgrounds are offset in the Air Force population subgroup by the long-lasting exposure to a privileged setting.
The results confirm a survival advantage of BAF officers when compared to the average Brazilian male in 2000 as well as men from the 1935 Brazilian birth cohort. However, contrary to the findings from earlier studies that looked at the influence of mid-life conditions over survival (Kaden, 2013), (Kannisto, 1997), we showed that place of birth had a statistically significant impact on BAF mortality throughout the follow-up period. Officers who were born in the more developed regions of Brazil had lower mortality relative to those who were born in the less developed regions, despite living in similar socioeconomic settings after enrolling in the military service.
42 Although we cannot test for each of these effects with our current data, it seems reasonable to suppose that birthplace is a good proxy for early life conditions. Therefore, our results provide evidence in favor of previous studies that have shown
that early life events have ‘scarring’ affects on adult mortality, despite noteworthy positive changes during an individual’s life course. Even if one invests heavily on health, education and nutrition at relatively young ages and continuously does so throughout
his life, adverse conditions during infancy and childhood or on mother’s health during
pregnancy might still have significant impacts on mortality at later ages.
Given that we collected data for officers enrolled from 1947 to 1960, most of them joined the Brazilian Air Force in moments of transitional processes and the creation of important research aviation centers and factories in the Southeast Brazil, as mentioned before. Those centers and factories probably attracted more individuals from those particular areas interested on training in engineering. If so, it is possible that the selection of individuals born in the Southern states with stronger background than those in the Northern states reinforced potential effects from early life conditions on mortality later in life. An extension of this study should include other BAF cohorts in order to test if the settlement of the institution during the 1940s and 1950s make the mortality differences within the BAF more pronounced.
43 help demographers identify potential errors in the mortality functions estimated for the entire country. Indeed, as we pointed out in this study, the mortality patterns above age 45 in Brazil look very different from those of other populations with more reliable mortality data, including the officers of the Brazilian Air Force, which suggests that more attention should be paid to the accuracy of mortality estimates at old ages.
Finally, our study points to the contribution of analyzing levels and patterns of mortality in subgroups, where the possibility of taking a closer look into a population’s
44 References
Abraido-Lanza et al., (1999). The Latino mortality paradox: A test of the "salmon bias" and healthy migrant hypotheses. American Journal of Public Health. 89(10)1543-1548.
Aérea, Força Aérea (2013). Available at http://www.afa.aer.mil.br/. Dowload on 15/04/2013.
Agresti, A. (2002). Categorical Data Analysis. Ed. John Wiley. New York. Edition 2.
Andrade, R. P. (Ed.). (1976). A construção aeronáutica no Brasil 1910-1976. São Paulo: Brasiliense.
Andreev, E. M., D. Jdanov, V.M. Shkolnikov, and D.A. Leon. . (2011). Long-term trends in the longevity of scientific elites: Evidence from the British and the Russian academies of science. Population Studies-a Journal of Demography, 65, 319-334.
Bengtsson, T., and Lindstrom, M. (2000). Childhood misery and disease in later life: the effects on mortality in old age of hazards experienced in early life, southern Sweden, 1760-1894. Population Studies, 54, 263–277.
Bertazzo, R. P. (2003). A Crise da Indústria Brasileira Aeronáutica:1945-1968. Bacharel, UFJF, Juiz de Fora.
Boscarino, J. A. (1997). Diseases Among Men 20 Years After Exposure to Severe Stress: Implications for Clinical Research and Medical Care. Psychosomatic Medicine 59, 605–614.
Boscarino, J. A. (2006b). Posttraumatic Stress Disorder and Mortality Among U.S. Army Veterans 30 Years After Military Service. Annals of Epidemiology 16, 248–256.
Breslow,L. and Enstrom, J. E. (2008). Lifestyle and reduced mortality among active California Mormons, 1980–2004. Preventive Medicine. 46, 133-136.
Buzzell, E. and. Preston, S. H. (2007). Mortality of American Troops in the Iraq War. Population and Development Review, 33, 555–566.
Case, A. and Paxson, C. (2005). Sex Differences in Morbidity and Mortality. Demography. 42. Number 2, 189-214.
45 Castro, C. (Ed.). (1990). O Espírito Militar. Um Estudo de Antropologia Social na Academia Militar das Agulhas Negras. Rio de Janeiro: Jorge Zahar.
Costa, D. (2003). Understanding Mid-Life and Older Age Mortality Declines: Evidence from Union Army Veterans. Journal of Econometrics, 112, 175-192.
Costa, D. (2004). The Measure of Man and Older Age Mortality: Evidence from the Gould Sample. Journal of Economic History, Working Paper No. 8843. Vol. 1(64), 1-23.
Costa, D., Fogel, R. (1997). A Theory of Technophysio Evolution, with Some Implications for Forecasting Population, Health Care Costs, and Pension Costs. Demography, 34, 49-66.
Clipp, E.C., and Elder, G.H. (1996). The aging veteran of World War II: Psychiatric and life course insights. In P.E. Ruskin & J.A. Talbott (Eds.), Aging and Posttraumatic Stress Disorder (pp.19-51).
Cutler, D. M. and Lleras-Muney, A. (2010). Understanding differences in health behaviors by education. Journal of Health Economics. 29,1-28.
Davison, E. H., Pless, A.P., Gugliucci, M.R., King, L.A., King, D.W., Salgado, D.M., et al. (2006). Late-life emergence of early-life trauma: The phenomenon of late-onset stress symptomatology among aging combat veterans. Research on Aging 28: 84-114.
Doblhammer, G. and R. (2003). Seasonal mortality in Denmark: the role of sex and age. Demographic Research, 9, 197-222.
Elo, I., Preston, S. H and Stewart, Q. (1999). Effects of Age Misreporting on Mortality Estimates at Older Ages. Population Studies, 53, 165-177
Elo, I. and Preston, S.H. (1992). Effects of early-life condition on adult mortality: A review. Population index. 58, 186-222
Eschbach, R. and Markides, K.S. (2004). Evaluation of mortality data for older Mexican Americans: Implications for the Hispanic paradox. American Journal Of Epidemiology. 159(7), 707-715
Fogel, R. W. (2004). Health, Nutrition, and Economic Growth. Economic Development and Cultural Change, 52(3), 643.
46 Hayward, M. D., Pienta, A.M., and McLaughlin, D.K. (1997). Inequality in men's mortality: The socioeconomic status gradient and geographic context. J Health Soc Behav, 38, 313-330.
INCAER (Ed.). (1991). História Geral da Aeronáutica (Vol. 3).
IBGE. Instituto Brasileiro de Geografia e Estatística (2000). Tábuas Completas de Mortalidade 2000. Available at http://www.ibge.gov.br/home/estatistica/populacao/. (download on 23/10/2013)
Kahn and Costa, D. (2010). Health, Wartime Stress, and Unit Cohesion: Evidence From UnionArmy Veterans. Demography, 47(Number 1), 45-66.
Kannisto (Producer). (1994). Development of oldest-old mortality. 1950-1990 (Odense University Press, Odense, Denmark). Available on http://www.demogr.mpg.de/.
Kannisto, V., Christensen, K. and Vaupel, JW. (1997). No increased mortality later in life for cohorts born during famine. American Journal of Epidemiology, 145, 987-994.
Kennedy, McDonald and Biddle. (2006). The Healthy Immigrant Effect and Immigrant Selection: Evidence from Four Countries. SEDAP Research Paper No. 164
Khlat, D. (2003). Is there a Mediterranean migrants mortality paradox in Europe? International Journal of Epidemiology, 32(6), 1115-1118.
MacIntyre NR, M. R., Oberman A, Harlan WR, Graybiel A, Johnson E. (1978 ). Longevity in military pilots: 37-year followup of the Navy's "1000 aviators". Aviat Space Environ Med, 49(9), 1120-1122.
McDonald, J.T.and Kennedy, S.(2004). Insights into the 'healthy immigrant effect': health status and health service use of immigrants to Canada. Social Science & Medicine. 59(8)1613-1627.
McMichael , A.J. (1976). Standardized mortality ratios and the “healthy worker effect”:
Scratching beneath the surface. J Occup Med. 18,165-168.
Marmot et al. (1998). Contribution of Psychosocial factors to Socioeconomic Differences in Healths. Milbank Quarterly, 76(3), 403-448.
Markides, K.S.and Eschbach, K. (2005). Aging, migration, and mortality: Current status of research on the Hispanic paradox. Journals of Gerontology Series B-Psychological Sciences And Social Sciences. 60, 68-75
47 NIOSH, (1996). National Mortality Profile of Active Duty Personnel in the U.S. Armed Forces: 1980-1993.
Ozcan, S. (2012). Casualty Profile of the United States Army in Afghanistan and Iraq. Monterrey, California. Ministry of Defense.Thesis.
Paes, N. A. (2005). Avaliação da cobertura dos registros de óbitos dos Estados brasileiros em 2000. Revista de Saúde Pública, 39(6), 882-890.
Palloni, A. and Arias, E. (2004). Paradox Lost: Explaining the Hispanic Adult Mortality Advantage. Demography. 41, 385-415
Palloni, A.and Morenoff J.D. (2001). Interpreting the paradoxical in the Hispanic paradox - Demographic and epidemiologic approaches. Population Health and Aging. 140-174.
Preston, Guillot and Heuveline. (2001). Demography: Measuring and Modeling Population Processes. Oxford. Blackwell Publishers
Preston Hill and Drevenstedt (1998). Childhood conditions that predict survival to advanced ages among African-Americans. Social Science & Medicine. 47,1231-1246
Razum, O. and Twardella, D. (2002). Viewpoint: Time travel with Oliver Twist - Towards an explanation for a paradoxically low mortality among recent immigrants. Tropical Medicine & International Health 7(1), 4-10.
Rosero-Bixby, L. (2008). The Exceptionally High Life Expectancy of Costa Rican Nonagenarians. Demography, 45(3), 673–691.
Sastry, N. (2004). Trends in Socioeconomic Inequalities in Mortality in Developing Countries: The Case of Child Survival in Sao Paulo, Brazil. Demography. 41(3)443-464
Shah et al., (2009). Healthy worker effect phenomenon. Indian J Occup Environ Med, 13, 77-79.
Spiro, A., Chatterjee, S., King, L.A., King, D.W., and Davison, E.H. . (2009). Research on Aging Military Veterans: lifespan Implications of Military Service. PTSD Research Quarterly, 20(3), 1-9.
Spiro, A., Schnurr, P.P., and Aldwin, C.M. . (1997). A life-span perspective on the effects of military service. Journal of Geriatric Psychiatry and Neurology, 30, 91-128.
48 The Human Mortality Database (HMD). University of California, Berkeley (USA), and Max Planck Institute for Demographic Research (Germany). Available at www.mortality.org or www.humanmortality.de (data downloaded on 17/12/2013 ) from http://www.mortality.org/ or www.humanmortality.de
Turra, C. and Gomes., M. (2009). The number of centenarians in Brazil: Indirect estimates based on death certificates Demographic Research, 20(20), 495-502.
Turra, C. and Elo, I. (2007). Socioeconomic Differences in mortality among U.S Adults: Insights into the Hispanic Paradox. Journal of Gerontology Social Sciences. 52(B)S184-S192
Van den Berg, G. D., Christensen, K. (2009). Exogenous determinants of early-life conditions, and mortality later in life. Social Science & Medicine, 68, 1591-1598.
Van den Berg, G. J., Lindeboom, M., and Lopez, M. (2007). Inequality in individual mortality and economic conditions earlier in life. Working paper VU University
Amsterdam.
Yates, L. B., Djousse, L., Kurth, T., Buring, Julie E.,Gaziano, M. (2008). Exceptional Longevity in Men: Modifiable Factors Associated With Survival and Function to Age 90 Years. Arch Intern Med., 168(3), 284-290.