CERNE
Historic:
Received 29/01/2018 Accepted 22/05/2018 Keywords:
Fragmentation Forests Anthropogenic Exposure Future Forest Scenarios
1 Sorocaba São Paulo State University, Sorocaba, São Paulo, Brazil, ORCID: 0000-0003-1269-3986a, 0000-0001-8722-8398b, 0000-0003-0937-786Xc, 0000-0002-7359-6859d, 0000-0002-5234-8944e
2 Technological Research Institute of São Paulo, São Paulo, São Paulo, Brazil, ORCID: 0000-0002-7760-9514a
+
Correspondence:
DOI:
10.1590/01047760201824022512
Elfany Reis do Nascimento Lopes1a+, Jomil Costa Abreu Sales1b, Jocy Ana Paixão de Sousa1c,
Amanda Trindade Amorim1d, José Luiz Albuquerque Filho2a, Roberto Wagner Lourenço1e
LOSSES ON THE ATLANTIC MATA VEGETATION INDUCED BY LAND USE CHANGES
LOPES, E. R. N.; SALES, J. C. A. SOUSA, J. A. P.; AMORIM, A. T.; ALBUQUERQUE FILHO, J. L.; LOURENÇO, R. W. Losses on the atlantic mata vegetation induced by land use changes. CERNE, v. 24, n. 2, p. 121-132, 2018.
HIGHLIGHTS
The linear growth of the anthropogenic land changes in 2025 will reduce 22% of vegetation.
Urban areas and agriculture are the main uses responsible for vegetal fragmentation.
Land changes projection are important as decision making in environmental planning.
Similar areas with strong urban agglomeration tends to present similar deterioration.
ABSTRACT
Land use changes are related to urbanization, economics and technology, infl uencing the management of natural resources and the ecosystem processes. The present study evaluated the behavior of land use changes in the period of 2007 and 2016, and identifi ed the infl uence of these changes on the Atlantic Forest vegetation and the expected consequences for a future scenario in the short (2020) and medium term (2025). The study was developed in the Una river basin, located in southeastern Brazil. Land use mapping was performed using Landsat 5 and Sentinel-2A satellite imagery, with visual interpretation techniques. The assessment of land use changes and ecological losses was modeled in the Land Change Modeler and the gains and losses for each category and their future scenarios were identifi ed. The calculations of landscape metrics were performed with the V-LATE extension for ArcGIS. The Anthropogenic Exposure Indicator was applied to evaluate the exposure of fragments. The comparative between land uses showed an increase of 484.33 ha of anthropogenic areas and a decrease of 484.14 ha of vegetation. The greater conversion of forests to other uses was related to agriculture. The fragments are under intense edge effect and 13.70% are under high anthropogenic exposure. By 2016, a loss of 484 ha of Atlantic Forest was identifi ed, being expected a loss of 694.11 ha by 2020 and of 934.10 ha by 2025.
LOSSES ON THE ATLANTIC MATA VEGETATION INDUCED BY LAND USE CHANGES
INTRODUCTION
Land use changes are considered exogenous changes caused by factors inherent in urbanization, economics and technology, directly influencing the management of natural resources and the ecosystem processes. In the ecological system, the greatest impacts occur in forest areas (Lambin; Meyfroidt, 2010).
The transitions of forest areas to other uses are driven to suppress the economic needs of man, leading to conversions of use to agricultural, livestock and urban areas (Lambin; Meyfroidt, 2010; Imazon, 2014). The impacts of these actions on forests directly influence their ecological functions, the environmental physicochemical processes and the quality of life of the populations, reinforcing the need for studies that indicate future scenarios for the change in the occupation pattern of these areas (Barbier et al., 2010; Balestrini et al., 2011; Lira et al., 2012; Kennel et al., 2015).
In Brazil, transitions among Atlantic Forest sites have been evident. This biome is one of the largest tropical forest hotspots in the Americas, currently presenting 12% of its original extension of 1,350,000 km². Most of the remnants of this biome are embedded in areas of major anthropogenic interference, making it one of the most endangered and threatened ecosystems in the world (Ribeiro et al. 2009; Colombo; Joly, 2010; MCT, 2015; Shuey et al., 2017).
The degree of threat in the Atlantic Forest vegetation is marked by anthropogenic activities and its conservation scenario is disastrous (Lawler et al., 2014). Land use changes and its high biodiversity loss are mainly related to agricultural demands. Even in the face of high degradation and fragmentation, the Atlantic Forest currently has approximately 7,000 endemic plant species (Neves et al., 2017). Despite the evident transition, studies of land use changes in biodiversity hotspots in Brazil are focused on the Amazon, showing also the trends of the impact of the conversion of vegetation to areas for the productive economic sector in the north of the country (Maeda et al., 2011; Arvor et al., 2017; Carvalho et al., 2017).
Consequences of this forest reduction and fragmentation have revealed the impairment of services and products provided by the ecosystem, inducing isolation and susceptibility to fires, invasion of exotic species and interference in evolutionary processes through which diversity originates (Ehrlich; Wilson, 1991, Santos Filho, 1995; Myers; Knoll, 2001; Carranza et al., 2017; Leite et al., 2017).
Considering the severity of the ecological losses that natural areas have undergone, the main concern of
this study was to investigate the impact and the relation of land use changes in Atlantic Forest areas. Thus, the present work sought to evaluate the behavior of land use changes in the period of 2007 and 2016, to identify the influence of these changes on the Atlantic Forest vegetation and the consequences expected for a future scenario in the short (2020) and medium term (2025).
MATERIAL AND METHODS
Study area
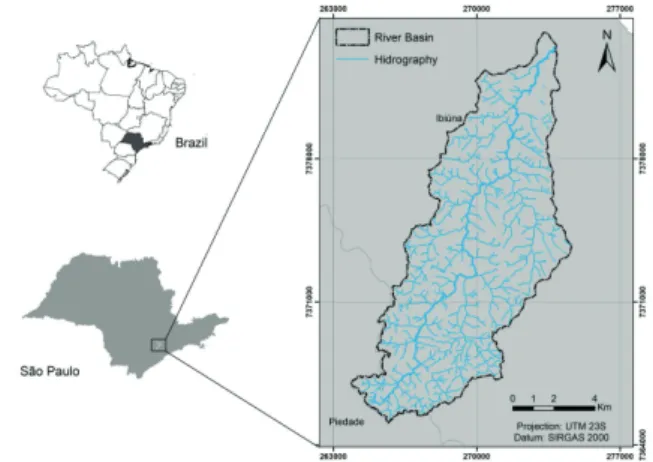
The study was developed in an area of the Una river basin, located in the state of São Paulo, southeastern Brazil (Figure 1). The basin has an approximate extension of 96 km² and its main water course extends for 25.5 km. It is characterized by belonging to the tenth Water Resources Management Unit of Sorocaba and Middle Tietê, in the state of São Paulo (UGHRI 10). The basin contributes significantly to the formation of the Itupararanga reservoir, which is the main source of water supply for municipalities in the region, and an area of economic interest due to agricultural expansion, containing fragments of native forests and proximity to the Environmental Protection Areas (EPAs) of Serra do Mar, Corumbataí, Botucatu and Tejupá.
FIGURE 1 Location of the Una river basin, Ibiúna, São Paulo - Brazil.
Temporal mapping of land and forest use
The mapping of land and forest use was carried out considering the years 2007 and 2016. The mapping for the year 2007 was elaborated using a Landsat 5 satellite image, obtained from the US Geological Survey (USGS) website, with a spatial resolution of 30 meters, 219/076 point/orbit, and September as the month of acquisition. The mapping for 2016 was elaborated using a Sentinel-2A satellite image, obtained from the Brazilian National Institute for Space Research (INPE) website, with a spatial resolution of 20 meters, and November as the month of acquisition. For both images, reprojection and geometric corrections were performed for the southern hemisphere and the projection system used was the Universal Transverse Mercator (UTM), Datum SIRGAS 2000, zone 23 S.
The mapping was performed using visual interpretation techniques and post-classifi cation, in true compositions, considering the stipulated criteria of size and shape; color and tonality, location of the object in the landscape; texture and structure of the landscape. Considering that the satellite images used have a low spectral resolution, a mapping was performed for the year 2010, with a Spot-5 image with spatial resolution of 2.5 meters, using true composition. The image, besides having a better spatial resolution than those of 2007 and 2016, is presented in a middle year in the analysis. These justifi cations motivated the primary realization of the mapping in greater detail and, from this, post-classifi cation visual interpretation was performed by multitemporal retro-analysis for the remaining years (Rafi ee et al., 2009; Huzui, et al., 2012).
The categories adopted for land use mapping were adapted from the Guidelines for Good Land Use Practice, Land Use and Forest Changes (GPG/LULUCF) and consist of Forest (FO), Reforestation (RE), Country Areas (CA), Agriculture (AG), Urban Area (UA), Flooded Area (FA) and Pasture (PA).
The mapping for the year 2016 was validated through work in the fi eld, from the defi nition of random points of verifi cation of land use, being evaluated the totality of one hundred points with the aid of GPS and digital camera. For land use correction, when needed, the vectors were edited, and the mapping was updated.
Assessment of land use changes and ecological losses
The quantifi cation and identifi cation of losses of natural areas and their conversion to anthropogenic areas were modeled in the Land Change Modeler (LCM) of the Idrisi Selva software (Clark Labs, 2012). Both mappings were processed in a comparative way, with the gains and losses for each category being identifi ed, as well as the sites that persisted with the same use over time.
It was also calculated the changes occurred in the net transitions from forest area to other uses, the areas of forest losses and gains, their quantitative fi gures, the changes and the spatial behavior of the transitions.
Temporal assessment of forest fragmentation
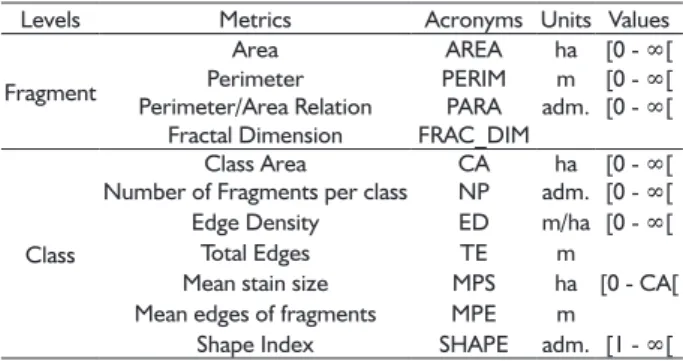
Forest fragments were segmented from the land use mapping of year 2016, with the calculations of landscape metrics in the vegetation area being performed using V-LATE (Vector-based Landscape Analysis Tools Extension) associated with the ArcGIS 10.5 software and the Microsoft Excel 2010 program (Microsoft, 2010; ESRI, 2014). For the analysis of the infl uence of fragmentation on these areas, the metrics listed in Table 1 were evaluated.
TABLE 1 Analysis of the trend of the NDVI series. Levels Metrics Acronyms Units Values
Fragment
Area AREA ha [0 - ∞[ Perimeter PERIM m [0 - ∞[ Perimeter/Area Relation PARA adm. [0 - ∞[
Fractal Dimension FRAC_DIM
Class
Class Area CA ha [0 - ∞[ Number of Fragments per class NP adm. [0 - ∞[ Edge Density ED m/ha [0 - ∞[
Total Edges TE m
Mean stain size MPS ha [0 - CA[ Mean edges of fragments MPE m
Shape Index SHAPE adm. [1 - ∞[
Assessment of the anthropogenic exposure of forest fragments
The Anthropogenic Exposure Indicator (AEI) developed by Lourenço et al. (2014b) was applied to evaluate the exposure of the basin fragments. The AEI is based on the calculation of the Circularity Index (CI), given by the interference potential of its surroundings according to the geometric feature of circular or elongated shape of the fragment (Viana; Pinheiro, 1998), and on the Edge Effect Index (EE), which is based on the measurement of the contact surface of the different land uses with the perimeter of the fragments, assigning values according to the degree of importance for the degradation. According to Lourenço et al. (2014), the AEI [1] varies from 0 to 1, with 1 representing the scenario of greater exposure to the effects of anthropogenic activities on the fragment and 0 the scenario of lower pressure of anthropogenic activities. Where: CI = Circularity Index; EE = Edge Effect Index; AEI = Anthropogenic Exposure Indicator
LOSSES ON THE ATLANTIC MATA VEGETATION INDUCED BY LAND USE CHANGES
RESULTS AND DISCUSSION
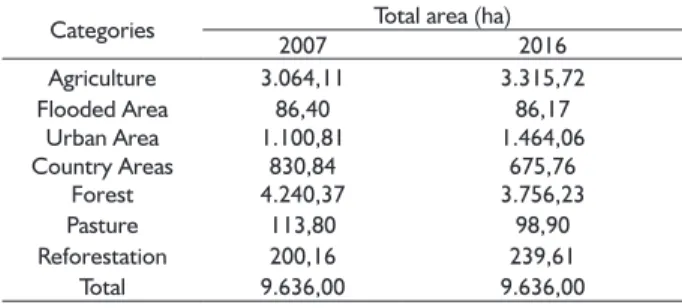
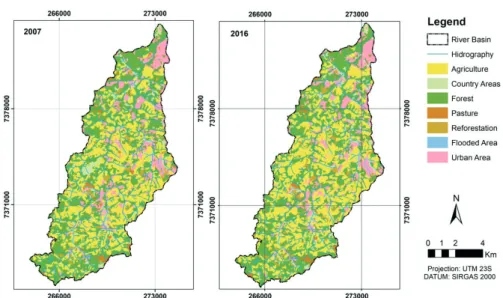
Land use for the years 2007 and 2016 in the study area are presented in Table 2 and Figure 2. The comparative analysis between land use maps showed an increase of 484.33 ha of anthropogenic areas for the period evaluated. The natural areas, considered as forests and flooded areas, decreased from 4,327 ha to 3,842 ha. Specifically, the natural vegetation of the Atlantic Forest declined by 484.14 ha, equivalent to 11.18% of its area in 2007, and currently accounts for only 39% of the total area of the river basin. Considerable increases were observed for urban area (363.25 ha), agriculture (251.61 ha) and reforestation (39.45 ha). These high rates of anthropogenic areas may be related to the decrease identified for vegetation.
TABLE 2 Quantitative figures of the land use categories for
2007 and 2016.
Categories Total area (ha)
2007 2016
Agriculture 3.064,11 3.315,72
Flooded Area 86,40 86,17
Urban Area 1.100,81 1.464,06 Country Areas 830,84 675,76
Forest 4.240,37 3.756,23
Pasture 113,80 98,90
Reforestation 200,16 239,61
Total 9.636,00 9.636,00
A significant change in the landscape was observed in the north, where the vegetation was replaced by an urban area. This area refers to 11% of the urban agglomerate of the city of Ibiúna and represents the flat area of the city, equivalent to the low course of the water basin. The situation of low slope and proximity to the hydrographic network made it possible to intensify deforestation and convert natural areas to uses of socioeconomic interest during this period.
The area of the middle course of the basin also presented a densification of anthropogenic areas, mainly for agriculture, country areas and urban sites. These areas present reliefs that vary from flat to wavy and allow intensive use of the soil without the need for investment of onerous cultivation practices for correction and agricultural production. Consequently, the large areas of cultivation favored the creation of urban and rural centers, with small settlements without sanitary structure, and encourage the process of irregular housing in these areas.
The decrease of around 0.23 ha in flooded area indicates a water loss of significant relevance, since the area has a high propensity for agricultural activity, with intensive water use for irrigation. In addition, the
Future scenarios
Two stochastic and spatial dynamic models based on short-term (2020) and medium-term (2025) landscape scenarios were developed, with emphasis on the fragmentation of Atlantic Forest vegetation. The modeling was implemented using the Land Change Modeler (LCM) tool of the Idrisi Selva software (Clark Labs, 2012). For the construction of future scenarios, the transitions between the land use maps of 2007 and 2016 were calculated, with emphasis on the potential changes of forests to the other categories of use through a sub-model that conceived the driving forces of transitions after the changes.
The use transitions were calculated using the multilayer perceptron (MLP) classifier. The MLP evaluates the land use classification through a perceptron neural network classifier, using the return propagation algorithm (BP) and a nonparametric regression analysis between input variables and a dependent variable with the output containing a neuron which represents the expected associations. For the calculations of future changes and projections, the Markov chain forecast was used. The Markov chain calculates the number of changes based on the previous and later land use maps, along with the date specified for the future scenario. The procedure identifies the amount of use that can be carried over from the later date to the forecast date, based on a projection of future transition potentials (Clark Labs, 2012).
In the model execution, training and validation samples and areas of land use categories that have remained persistent were specified, as recommended by the method. In this case, the module calculates the respective samples based on the transition parameters and, by default, the sample size is set to be equal to the smallest number of pixels that have passed from one category to another. The modeling extracts from the two land use maps the areas that were subjected to the transitions and areas that were eligible to change or not (Clark Labs, 2012).
conversion of vegetation to bare soils for planting or urban areas, with soil sealing, contributes to high rates of evapotranspiration and loss of water from the water system. Figure 3 presents in greater detail the transitions of land use change that occurred in the period.
The assessment of losses and gains confirm previous data on the amount of land use, where agriculture showed the highest area gain in the period. The category presented a gain of 425 ha and a loss of 174 ha, that is, a real gain of 251 ha. This situation can be related to the changes of country areas areas and forests, which had a real loss of 155 ha and 484 ha, respectively, with these areas being converted to agricultural farming. Their sum represents the highest rate of change in the period (39.50%). The pastures obtained an area loss greater than the gain, equivalent to -35 ha in its current area, being the second highest rate of changes in the area (33.23%). This negative rate may reflect its conversion
both to agricultural areas and to the installation of new urban centers.
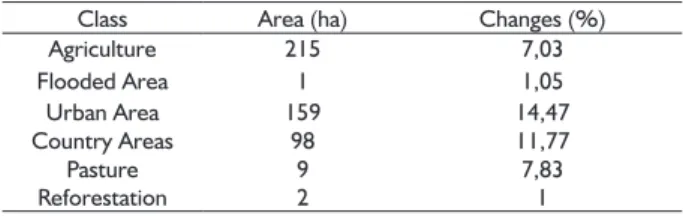
Transitions between anthropogenic areas can be linked to the process of land use change as an exogenous factor characterized by socioeconomic innovations that occur independently of the ecological system. These transitions follow their own dynamics and it usually driven by urbanization, economic development or globalization (Lambin; Meyfroidt, 2010). There are a wide discussion about the impact of the changes and the conversion of forest area to the other categories of anthropogenic use, Table 3 shows the conversions and their percentages of changes occurred.
We identified 484 ha of forest losses which was highest conversion to agriculture class. In the area, agricultural activity presents two contrasting aspects. While it is the vector of local socioeconomic development that promotes the economy and the generation of employment and income, it is also responsible for the
FIGURE 2 Land and Forest use in the Una river basin in (a) 2007 and (b) 2016.
FIGURE 3 A. Quantitative figures in hectares of gain and loss between 2007 and 2016. B. Quantitative figures in percentages of
LOSSES ON THE ATLANTIC MATA VEGETATION INDUCED BY LAND USE CHANGES
meters of edges and average density of 20,012.73 m.ha-1.
The areas of the fragments presented great variation, with the minimum area corresponding to 0.03 ha and the maximum area corresponding to 327.55 ha, while the perimeter ranged between 101.91 m and 44.388.16 m.
The size of the patches is intertwined with many ecosystem processes that require a minimum of contiguous preserved area to occur. Forest fragments or small-scale forest patches are more subject to phenomena such as edge effect and forest isolation, which occur from the interaction of the margin of two adjacent ecosystems. These effects are less pronounced in large fragments, due to their smaller area/perimeter ratio (Helzer; Jelinski, 1999; Kim, 2013).
This phenomenon is also capable of affecting local microclimate and abiotic interactions, such as changes in solar incidence, humidity and wind patterns at the edges of the fragments. Consequently, these changes affect seed germination and the proliferation of shadow intolerant individuals. The increase in the incidence of wind at the edge is proportional to the increase of the fall of trees, altering the structure and composition of the landscape, prey-predator relationships and mutualism, commensalism and parasitism relationships (Batáry et al., 2014).
It was observed a high shape index and high variability in its shapes, with the area presenting from circular to irregular fragments. The index ranged from 1.08 to 7.83 and the perimeter/area ratio and the fractal dimension also confirm the shape variation of the fragments, indicating intense edge effect and sinuosity on these areas.
According to Liao (2013), in the long term, the edge effect is responsible for the local extinction and isolation of forest remnants, affecting the populations of the fauna and flora species, leading to changes in ecological processes such as pollination, predation, territorial behavior and dietary habits of the populations of remaining species. The largest number of fragments
TABLE 3 Contributions to the loss of net changes in forests. Class Area (ha) Changes (%)
Agriculture 215 7,03
Flooded Area 1 1,05
Urban Area 159 14,47
Country Areas 98 11,77
Pasture 9 7,83
Reforestation 2 1
ecological losses of natural areas, inducing biodiversity loss and contributing to the depletion of natural resources, affecting water replacement, water regime and the susceptibility to flood and landslide events.
The urban area develops in parallel with the growth of the agricultural areas, also representing a high contribution rate for the loss of forest area, especially in the central region of the basin. According to the latest Brazilian demographic census, conducted in 2010, the area of the basin comprised 9,009 households and a total population of 29,906 inhabitants. Currently, the anthropogenic impact of this area is already greater (Lopes et al., 2016). The sum of the conversions of forests to country areas, pasture, reforestation and flooded area totaled 110 ha, likewise contributing to the loss of biodiversity in the vegetated area.
The spatial pattern of these areas is associated with the most evident changes in the north and central regions of the river basin, predominantly associated with large urban and agricultural areas. According to Basnyat (2009) and Andersson et al. (2015), the loss of forest area to urban areas is due to the economic characteristics of the municipality, as it is an agricultural production pole, which attracts numerous workers and favors the accentuated growth of these areas. The forest fragmentation of the Atlantic Forest areas is presented in Table 4.
The influence of land use change on vegetation areas revealed a total of 212 forest fragments, representing 3,763.31 ha. The area suffered a deficit of 11.5% in its original area in 2007. The average area of the patches was estimated at 177,514.93 ha, with 905
accounted for a size less than 5 ha (129), while those with medium size totaled 63, and 20 fragments had the largest sizes. The large fragments correspond to the largest area in the basin, being also larger than the total area of the small and medium fragments.
Deleterious effects on vegetation are more incident in smaller fragments, exposing the entire ecological community to a greater environmental susceptibility. According to Oertli et al. (2000), larger and better conserved areas support more species. Based on this biogeography principle, there is a global trend towards reducing biodiversity loss by promoting the preservation of large green areas and forest parks (Sallustio et al., 2017).
A study carried out in Singapore’s rainforests has assessed the biodiversity loss in the country, considering that in its colonization, in 1819, Singapore lost 95% of the 540 km2 of its original vegetation. The study showed
alarming rates of biodiversity loss, where the extinction of 73% of the local species was associated with forest loss (Brook et al., 2003). Alroy (2017) goes further and claims, based on an extrapolation of global biodiversity loss data, that if tropical deforestation progresses, there is a high possibility of occurrence of events equivalent to mass extinction in the coming years. Thus, several studies have warned of the high impact of land use changes and forest conversion in anthropogenic areas. Comparatively, in the study area, this relation resembles that observed in the researches of ecological interaction among species, being able to also reveal high biodiversity losses.
Although highly fragmented, vegetation areas are still important green areas providing different ecosystem services. Evidence of this is the fact that the local fragments are intermixed with the main water resources of the basin, which allows a greater conservation of the water bodies and helps in the process of maintaining
the water quality of the basin. The largest fragments are found in the southern portion of the basin, which has the highest hypsometric amplitude and slope percentages. Lutz et al. (1994) and Wang et al. (2016) emphasize that topography is a determinant factor for the practice of agricultural activities, therefore, factors such as the high cost for the implementation of soil correction measures for agricultural practice or expansion of the urban area are impediments to such practice and have favored the maintenance of green areas in these places.
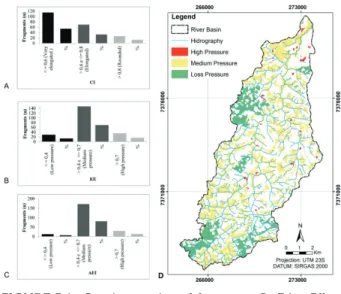
In the investigation of the anthropogenic exposure of this vegetation, the CI of the fragments revealed that more than half of the fragments (54%) had a very elongated shape characteristic (Figure 5A). This factor can still be correlated with the shape index metrics, the perimeter/area ratio and the fractal dimension previously shown, again confirming the irregular pattern and high local fragmentation.
TABLE 4 Forest fragments classes and metrics.
Level Group Metrics Results
Class
Area
Class Area (m²) 37,633,165.32
Number of Fragments per class 212,00
Shape Index 2,13
Perimeter/Area Relation 0,03
Size Edge
Mean stain size (ha) 177,514.93 Mean edges of fragments (ha) 422,685.68 Edge Density (m.ha-1) 20,012.73
Total Edges (m) 694,479.99
Level Group Metrics Minimum Mean Maximo
Fragment
Area (ha) 0.04 17.75 327,55
Area Perimeter (m) 101.91 3,275.85 44,388.16
Shape Perimeter/Area Relation 0.009 0.037 0,257
Shape Index 1.08 2.13 7.83
Distance nearest neighbor (m) 0.9 42.12 295.22 Neighbor Area nearest neighbor (ha) 26.04 53.76 327.00
Small (< 5ha) 0.04 1.89 4.96
Size Medium (5 -50 ha) 5.07 17.2 47.31
Large (> 50 ha) 51.13 121.75 327.55
LOSSES ON THE ATLANTIC MATA VEGETATION INDUCED BY LAND USE CHANGES
According to Lourenço et al. (2014), evaluating the environment of the fragments, along with the characteristics of their shape, helps to determine tehir fragility. For this, the EE of the fragments was evaluated, showing the interaction of the fragments by the threshold neighborhood. Figure 5B shows the percentage distribution of the fragments and their respective anthropogenic pressures.
As EE shows variation from 0 (low pressure) to 1 (high pressure), only 29 fragments present low anthropogenic exposure (13.70%) (Figure 5B). For Cheptou et al. (2017), the anthropogenic influence that drives fragmentation contributes to changes in species richness and structure, favoring the introduction of exotic species, and impairs interaction at different ecological levels. Thus, fragments with higher EE exposure present worse conditions for regeneration and maintenance of environmental quality.The regeneration of remnants under anthropogenic exposure is multifactorial. According to Arroyo-Rodriguez et al. (2017), the secondary succession of landscapes is relatively rapid in newly modified areas and is more likely to occur as a function of the proximity to well-preserved and biodiversity-rich native forests. However, for fragments that have undergone extensive and intensive anthropogenic disturbances, regeneration is slow, with biodiversity impoverishment and reduced potential to perform ecosystem functions and services.
Of the totality, 16.50% of the fragments are exposed. The sum of fragments with medium and high anthropogenic exposure represents, in the basin, 86.50% of the natural vegetation, with consequent reduction of biodiversity and condition of fragility. Figures 5C and 5D
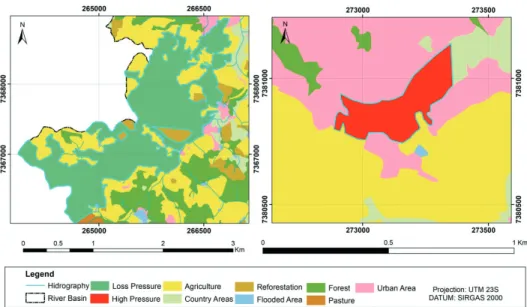
show the fragments classified regarding the AEI. The areas with the greatest forest fragmentation and with high exposure are predominantly in the northern region, which is the place with the highest rate of urbanization. Of these, 13.70% of the fragments are classified with high anthropogenic exposure, which means to affirm the strong influence of anthropogenic uses, especially the agricultural, urban, and pasture use in the environments. The highest percentage of fragments is in a situation of medium exposure (80.60%), while the sum of both represents 94.30% under increased anthropogenic exposure. Figure 6A shows the surroundings of a fragment considered to be of low anthropogenic exposure.
Its surroundings have pasture and agricultural areas, which, added to a more circular shape, contribute to classify it in a lower exposure situation. Figure 6B shows the diversity of land uses in the surroundings of two fragments of high exposure. It was possible to observe that the urban area accounts significantly for the exposure of these fragments, surrounding the whole fragment. As there is a trend to increase the urban area in the basin, over the years, few fragments will resist the demand for urban expansion, making them more susceptible to anthropogenic activities and consequently increasing the possibility of total suppression.
Based on the forest fragmentation identified, the importance of spatial models for environmental planning was evidenced, since understanding the spatial dynamics and the future projection of the impacts of these changes allows us to understand the complex relationship between different land use interactions in the ecosystem process, and help in decision making to conserve and ensure the maintenance of forests. In the actual situation
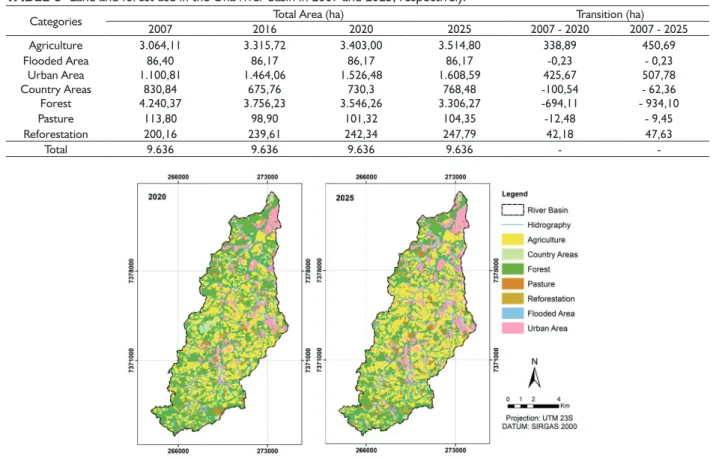
TABLE 5 Land and forest use in the Una river basin in 2007 and 2025, respectively.
Categories Total Area (ha) Transition (ha)
2007 2016 2020 2025 2007 - 2020 2007 - 2025
Agriculture 3.064,11 3.315,72 3.403,00 3.514,80 338,89 450,69
Flooded Area 86,40 86,17 86,17 86,17 -0,23 - 0,23
Urban Area 1.100,81 1.464,06 1.526,48 1.608,59 425,67 507,78
Country Areas 830,84 675,76 730,3 768,48 -100,54 - 62,36
Forest 4.240,37 3.756,23 3.546,26 3.306,27 -694,11 - 934,10
Pasture 113,80 98,90 101,32 104,35 -12,48 - 9,45
Reforestation 200,16 239,61 242,34 247,79 42,18 47,63
Total 9.636 9.636 9.636 9.636 -
-observed, the future scenarios for 2020 and 2025 were calibrated, designed and validated to represent the land use landscape in the short and medium term. Future projections made it possible to compare the past and present state of the basin. Based on the calculated transition, Table 5 shows the possible behavior of land use change between 2007 and 2025.
Figure 7 presents the land use scenarios for 2020 and 2025, also helping to understand these data. It was observed a linear growth for all the anthropogenic areas in the basin, with consequent reduction of the Atlantic Forest vegetation. The pasture and country areas presented a retraction in 2016, with subsequent growth in future scenarios. The flooded area, by reducing its surface area in 2016, maintained a steady pattern until 2025. The trend of impact in the basin was evident through agriculture and urban expansion activities, so that by 2025 an increase of 450.69 ha and 507.78 ha is expected, respectively. In a study by Costa et al. (2014) in Atlantic Forest fragments, the authors also found that due to land use change, there was a greater conversion of forests to agricultural and urban areas.
The forest category is the most affected in relation to the scenarios of changes until 2025. By 2016, the loss of Atlantic Forest area had been estimated at 484 ha; for
2020, the scenario predicts a total of 694.11 ha, and for 2025, a total of 934.10 ha. This value reflects a loss of 22% of the area mapped in 2007 and reduces vegetation to 34% of the total area of the basin.
The future scenarios of degradation of this area reveal increased ecological losses, reaffirming a possible lack of protection, control and measures to recover vegetation in the Atlantic Forest. Considering the linear loss of forest area for the last 20 years, it is possible to affirm a greater forest fragmentation and consequent anthropogenic exposure of the fragments. Spatially, the fragments categorized into high exposure have been suppressed, or their areas may be considered irrelevant to establishing an ecosystem relationship. It was observed that the fragments classified with low exposure are highly fragmented in the years 2020 and 2025, making the projection even more alarming.
Given the estimates presented, the study is a guidance for decision making regarding measures to contain fragmentation and recover forest areas. Notwithstanding, a meta-analysis on forest restoration has shown that policymakers and managers do not have technical principles to achieve such goals. This study, developed by Meli et al. (2017), showed that the recovery stage depends on the region and type of land
LOSSES ON THE ATLANTIC MATA VEGETATION INDUCED BY LAND USE CHANGES
use. Regarding ecological parameters, species abundance is recovered faster than species richness. Moreover, mining areas showed faster recovery results in relation to agricultural areas. Considering that the analyzed area is suitable for agricultural practice, the recovery of the vegetation areas should present results in the long term. Despite this collation, the regeneration of these areas favors ecosystem processes at the local level, benefiting social, economic and natural sectors, justifying the need to conserve and recover these environments.
CONCLUDE REMARKS
The evaluation of land use changing on Atlantic Forest vegetation between 2007 and 2025 scenario is 22% of reduction. Urban areas and agriculture are the main uses responsible for fragmentation due to the largest number of small fragments (<5ha) with high anthropogenic exposure. Considering the vegetation losses in the next 20 years, the area presents an alarming future and attention must be drawn to the fact.
ACKNOWLEDGMENTS
To the Foundation for Support to the Institute of Technological Research (FIPT) for the scholarship during the study. To the Institute of Technological Research of São Paulo (IPT) for the participation of the first and second authors in the New Talents Program.
REFERENCES
ALROY, J. Effects of habitat disturbance on tropical forest biodiversity. Proceedings Of The National Academy Of Sciences, Sydney, v. 114, n. 23, p.6056-6061, 2017.
ANDERSSON, K.; LAWRENCE, D.; ZAVALETA, J.;GUARIGUATA, M. R. More Trees, More Poverty? The Socioeconomic Effects of Tree Plantations in Chile, 2001– 2011. Environmental Management, Chile, v. 57, n. 1, p. 123-136, 19 ago. 2015. Springer Nature.
ARROYO-RODRÍGUEZ, V.; MELO, F. P. L.; MARTÍNEZ-RAMOS, M., BONGERS, F.; CHAZDON, R. L.; MEAVE, J. A.; NORDEN, N.; SANTOS, B. A.; LEAL, I. R. E.; TABARELLI, M. Multiple successional pathwaysin human-modified tropical landscapes: newinsights from forest succession, forestfragmentation and landscape ecology research. Biological Reviews, v. 92, p. 326–340, 2017.
ARVOR, D; TRITSCH, I; BARCELLOS, C; JÉGOU, N; DUBREUIL, V. Land use sustainability on the South-Eastern Amazon agricultural frontier: Recent progress and the challenges ahead. Applied Geography, v. 80, p. 86-97, ISSN 0143-6228, 2017. Elsevier.
BALESTRINI, R., ARESE, C., DELCONTE, C. A., LOTTI, A. E SALERNO, F. Nitrogen removal in subsurface water by narrow buffer strips in the intensive farming landscape of the Po River watershed, Italy. Ecological Engineering, v. 37, p. 148–157, 2011.
BARBIER, EB; BURGESS, JC; GRAINGER, A. The forest transition: Towards a more comprehensive theoretical framework. Land use policy, v. 27, n. 2, p. 98-107, 2010.
BASNYAT, B. (Thailand). Asia-pacific Forestry Sector Outlook Study Ii (Org.). Impacts of demographic changes on
forests and forestry in asia and the pacific: Food and
Agriculture Organization of the United Nations Regional Office for Asia and The Pacific. Working Paper No. APFSOS
II/WP/2009/08. Bangkok, 2009. 82 p.
BATÁRY, P.; FRONCZEK, S.;NORMANN, C.;SCHERBER, C. E.; TSCHARNTKE, T. How do edge effect and tree species diversity change bird diversity and avian nest survival in Germany’s largest deciduous forest? Forest Ecology and Managemant. v. 319, n. 1, p. 44-50. 2014.
BROOK, B.W.; SODHI, N.S.; NG, PETER K.L. Catastrophic extinctions follow deforestation in Singapore Nature,
London. v. 424, n. 6947, p. 420-6, 2003.
CARRANZA, M.L.; HOYOS, L.; FRATE, L.; ACOSTA, A.T.R.; CABIDO, M. Measuring forest fragmentation using multitemporal forest cover maps: Forest loss and spatial pattern analysis in the Gran Chaco, central Argentina.
Landscape and Urban Planning, v. 143, p. 238-247, ISSN 0169-2046, 2015. Elsevier BV.
CARVALHO, T.S.; DOMINGUES, E.P.; HORRIDGE, J.M. Controlling deforestation in the Brazilian Amazon: Regional economic impacts and land-use change. Land Use Policy, v. 64, p. 327-341, ISSN 0264-8377, 2017. Elsevier.
CHEPTOU, P.; HARGREAVES, A. L.; BONTE, D.; JACQUEMYN, H. Adaptation to fragmentation: evolutionary dynamics driven by human influences. Philos Trans R Soc Lond B Biol Sci, v. 372, 2017.
CIIAGRO. CENTRO INTEGRADO DE INFORMAÇÕES AGROMETEREOLÓGICAS. Série histórica de pluviosidade mensal de Ibiúna – SP. Disponível em: <http://www.ciiagro.sp.gov.br/ciiagroonline/Quadros/ QChuvaPeriodo.asp> Acesso em: 21 jun. 2015.
CLARK LABS. Idrisi Selva. Worcester: Clark Labs, Clark University. 2012.
COLOMBO, AF; JOLY, CA. Brazilian Atlantic Forest lato sensu: the most ancient Brazilian forest, and a biodiversity hotspot, is highly threatened by climate change. Braz. J. Biol., v. 70, n. 3, p. 697-708, 2010.
EHRLICH, PR. WILSON, E. O. Biodiversity studies: science and policy. Science. v. 253, n. 5021, p. 758-762, 1991.
ESRI. ECONOMIC AND SOCIAL RESEARCH INSTITUTE.
HELZER, CJ; JELINSKI DE. The relative importance of patch area and perimeter-area ratio to grassland breeding birds.
Ecol. Appl., v. 9, n. 1, p. 1448–1458. 1999.
HUZUI, AE.; CALIN, I; PATRU-STUPARIU, I. Spatial pattern analyses of landscape using multi-temporal data sources.
Procedia Environmental Sciences, v. 14, p. 98-110, 2012.
IMAZON. INSTITUTO DO HOMEM E MEIO AMBIENTE DA AMAZÔNIA. Análise das Emissões de GEE no brasil (1990 - 2012) Mudanças de uso da Terra. 2014. 19p.
IPCC. INTERNATIONAL PANEL ON CLIMATE CHANGE.
Good Practice Guidance for Land Use, Land-Use Change and Forestry. IGES, 2003. 590p.
KENNEL, E; HUBBART, JA; IKEM, A. A comparison of forest and agricultural shallow groundwater chemical status a century after land use change. Science of the Total Environment, v. 529, p. 82–90, 2015.
KIM, E; SONG, W; LEE, D. A multi-scale metrics approach to forest fragmentation for Strategic Environmental Impact Assessment. Environmental Impact Assessment Review. v.42, p.31–38. 2013.
KÖPPEN, W. Grundriss der Klimakunde: Outline of
climate science. Berlin: Walter de Gruyter, 1931. 388p.
LAMBIN, EF.; MEYFROIDT, P. Land use transitions: Socio-ecological feedback versus socio-economic change. Land use policy, v. 27, n. 2, p. 108-118, 2010.
LAWLER, JJ. et al. Projected land-use change impacts on ecosystem services in the United States. PNAS, v. 111, n. 20, p. 7492–7497, 2014.
LIAO, J. et al. Modelling plant population size and extinction thresholds from habitat loss and habitat fragmentation: Effects of neighbouring competition and dispersal strategy.
Ecological Modelling. v. 268, p. 9–17. 2013.
LIRA. PK. et al. Land-use and land-cover change in Atlantic Forest landscapes. Forest Ecology and Management, v. 278, p. 80–89, 2012.
LOPES, RNE; SOUZA, JC; SOUSA, JAP; ALBUQUERQUE
FILHO, JL; LOURENCO, RW. Socioeconomic and environmental determinants on the urban potential of the una watershed, Ibiúna, SP. Rede : Revista Eletrônica do
Prodema, v. 10, p. 07-22, 2016.
LOURENÇO, RW; SILVA, DCC; SALES, JCA. Geoprocessamento como ferramenta de gestão e planejamento ambiental: O caso da cobertura vegetal em áreas urbanas. In: SMITH, W. S.; MOTA JÚNIOR, V.; LIMA, J. C. Biodiversidade do Município de Sorocaba. 1. ed. Secretaria Municipal do Meio Ambiente, 2014. p. 65-78.
LUTZ, E; PAGIOLA, S; REICHE, C. THE COSTS AND BENEFITS OF SOIL CONSERVATION: THE FARMERS’ VIEWPOINT.
The World Bank Research Observer, England, v. 9, n. 2, p.273-295, 1994. Oxford University Press (OUP).
MAEDA, EE; ALMEIDA, CM; XIMENES, AC; FORMAGGIO, AR; SHIMABUKURO, YE; PELLIKKA, P. Dynamic modeling of forest conversion: simulation of past and future scenarios of rural activities expansion in the fringes of the Xingu National Park, Brazilian Amazon. International Journal of Applied Earth Observation and Geoinformation. v. 13, n. 3, p. 435-446, 2011.
MCGARIGAL, K. FRAGSTATS: Spatial pattern analysis program for categorical maps: user manual. 2015. 182p.
MCT. MINISTÉRIO DA CIÊNCIA E TECNOLOGIA. Atlas dos
Remanescentes Florestais da Mata Atântica:Período
de 2013-2014. FUNDAÇÃO SOS MATA ATLÂNTICA
E INSTITUTO NACIONAL DE PESQUISAS ESPACIAIS, 2015. 60p.
MELI, P. et al. A global review of past land use, climate, and active vs. passive restoration effects on forest recovery.
Plos One, v. 3, p. 1 -17, 2017.
MICROSOFT. Microsoft Office Excel. 2010.
MYERS, N.; KNOLL, A.H. The biotic crises and the future of evolution. PNAS. v. 98, n. 10, p. 5389-5392, 2001.
NEVES, DM. et al. Dissecting a biodiversity hotspot: The importance of environmentally marginal habitats in the Atlantic Forest Domain of South America. Diversity and Distributions, v. 23, p. 898–909, 2017.
OERTLI, B. et al. Does size matter? The relationship between pond area and biodiversity. Biological Conservation. Switzerland, p. 59-70. maio 2002.
RAFIEE, R.; MAHINY, A. S.; KHORASANI, N. Assessment of changes in urban green spaces of Mashad city using satellite data. International Journal of Applied Earth Observation and Geoinformation, v. 11, p. 431-438, 2009.
RIBEIRO, MC. et al. The Brazilian Atlantic Forest: How much is left, and how is the remaining forest distributed? Implications for conservation. Biological Conservation, v. 142, p. 1144-1156, 2009.
SALLUSTIO, L., DE TONI, A., STROLLO, A., DI FEBBRARO, M., GISSI, E., CASELLA, L., GENELETTI, D., MUNAFÒ, M., VIZZARRI, M. E MARCHETTI, M. Assessing habitat quality in relation to the spatial distribution of protected areas in Italy. Journal Of Environmental Management, Rome, v. 201, p.129-137, out. 2017.
SANTOS-FILHO, PS. Habitat Fragmentation: implications for in situ conservation. Oecologia Brasiliensis. v. 1, 1995.
LOSSES ON THE ATLANTIC MATA VEGETATION INDUCED BY LAND USE CHANGES
VIANA VM; PINHEIRO LAV. Conservação da biodiversidade em fragmentos florestais. Escola Superior de Agricultura “Luiz de Queiroz” da Universidade de São Paulo. ESALQ, 1998.
WANG, J; WANG, H; CAO, Y; BAI, Z; QIN, Q. Effects of soil and topographic factors on vegetation restoration in opencast coal mine dumps located in a loess area.