Jumping to Conclusions Style along the
Continuum of Delusions: Delusion-Prone
Individuals Are Not Hastier in Decision
Making than Healthy Individuals
Suzanne Ho-wai So*, Nate Tsz-kit Kwok
Department of Psychology, The Chinese University of Hong Kong, Hong Kong SAR, China
Abstract
Literature comparing‘jumping to conclusions’(JTC) between patients and healthy controls has demonstrated the importance of the reasoning bias in the development of delusions. When groups that vary along the entire delusional continuum are included, the relationship between JTC and delusionality is less clear. This study compared JTC and delusional di-mensions between 28 patients with delusions, 35 delusion-prone individuals and 32 non-delusion-prone individuals. Delusion proneness was defined by an established threshold based on the Peters et al. Delusions Inventory. Two versions of the beads task (85:15 and 60:40) were used to measure JTC. As hypothesized, patients manifested hastier data gath-ering than the two non-clinical groups on both beads tasks. However, delusion-prone indi-viduals did not manifest a hastier decision making style than non-delusion prone
individuals. Instead, non-prone participants showed more JTC bias than delusion-prone individuals on the easier beads task. There was no evidence for a dose-response re-lationship between JTC and delusional dimensions, with correlations between JTC and PDI scores found in the non-delusion-prone group only. The present finding confirms the link be-tween an extreme JTC bias and the presence of clinical delusions, and argues against a lin-ear relationship between JTC and delusionality along the symptomatic continuum.
Introduction
‘Jumping to conclusions’(JTC) reasoning bias refers to a tendency to make decisions based on
insufficient information in ambiguous situations [1]. Studies reported that JTC is found in 70%
of individuals with delusions, and this hasty decision making style has been theorised as a
pre-disposing factor for the development of delusions (see reviews in [2], [3], [4]). As evidence
sup-porting the relationship between JTC and delusions accumulates, cognitive interventions have
recently been developed to target this reasoning bias [5–6].
a11111
OPEN ACCESS
Citation:So SH-w, Kwok NT-k (2015) Jumping to Conclusions Style along the Continuum of Delusions: Delusion-Prone Individuals Are Not Hastier in Decision Making than Healthy Individuals. PLoS ONE 10(3): e0121347. doi:10.1371/journal.pone.0121347
Academic Editor:Jim van Os, Maastricht University Medical Centre, NETHERLANDS
Received:October 27, 2014
Accepted:January 30, 2015
Published:March 20, 2015
Copyright:© 2015 So, Kwok. This is an open access article distributed under the terms of the Creative Commons Attribution License, which permits unrestricted use, distribution, and reproduction in any medium, provided the original author and source are credited.
Data Availability Statement:All relevant data are within the paper.
Funding:The authors have no support or funding to report.
Large-scale population studies have consistently reported an overlap in psychotic symptoms
between clinical and non-clinical groups [7–16]. These reports have led to a shift from the
tra-ditional categorical view to a continuum approach of understanding psychosis, where clinical delusions and non-delusional beliefs are suggested as two extreme ends of the same spectrum
[7,16–18]. This raises the following question: how does JTC, which is considered to predict the
development of delusions, relate to delusionality along the symptomatic continuum? Most investigations of JTC and delusionality either compared patients with non-clinical controls, or compared non-clinical individuals with high vs. low delusion-proneness (see
re-view by [4]). As reviewed by Garety and Freeman [4], non-clinical studies of JTC yielded
mixed evidence, with some studies reporting hastier decision-making in individuals with high
compared to low delusion-proneness (e.g. [19–21]), whereas others reported no significant
group difference [22–24].
A potentially more robust design to investigate the link between JTC and delusionality would be studies that encompass the full symptomatic continuum, comparing patients, indi-viduals with high delusion proneness and indiindi-viduals with low delusion proneness. This design allows for (i) comparison of JTC bias across clinical and non-clinical groups varying on sionality, and (ii) investigation of dose-response relationship between JTC and severity of
delu-sions across groups. To date, four studies took this approach [25–28].
Despite comparable patient symptom profiles across studies, the group comparison results
were divergent. Van Dael et al. [27] reported a graded difference in JTC across groups, with the
highest proportion of patients giving a definite rating after seeing only one bead on the beads task, followed by the delusion-prone group and then the non-delusion-prone group. Van Dael
et al. [27] also found that the association between level of psychosis liability and JTC was
stron-ger in individuals with delusions than those without, suggesting a dose-response relationship between JTC and delusions. Although a similar trend of graded JTC pattern across groups was
observed by Balzan et al. [25], the difference in JTC (defined by definite certainty rating on the
first bead) between the two non-clinical groups did not reach statistical significance. On the
contrary, Freeman et al. [26] and Warman et al. [28] found that JTC was unique to the clinical
group and not associated with delusions in the non-clinical groups. In both studies, the delu-sion-prone individuals actually gathered more information than the non-deludelu-sion-prone
indi-viduals. According to Warman et al. [28], the clinical group gave the most definite decisions
after two beads, followed by the non-delusion-prone and then the delusion-prone group. In
both Freeman et al. [26] and Warman et al. [28], the difference between the two non-clinical
groups was not significant.
Warman et al. [28] proposed a possible explanation for their finding of a lack of stepped
dif-ference in JTC—that delusion-prone individuals substantially adjust their data gathering
strat-egies to a difficult task. Both Freeman et al. [26] and Warman et al. [28] used the 60:40 version
of the beads task only, whereas Balzan et al. [25] and Van Dael et al. [27] used an easier version
(with a 90:10 or 85:15 ratio of bead colours respectively). It is unclear to what extent the lack of
stepped difference along the continuum in Freeman et al. [26] and Warman et al. [28] was
re-lated to the more ambiguous beads task used.
Apart from variations in the JTC task, the above studies also differed in their criteria for de-lusion-proneness, which might also contribute to the divergent findings as illustrated. Van
Dael et al. [27] used the Community Assessment of Psychic Experiences scale positive
dimen-sion [29], whereas Freeman et al. [26] used the Paranoid Thought Scale [30]. Compared to
these two scales, the Peters et al. Delusions Inventory (PDI) [31] was more widely applied to
measure delusion proneness [19,21–25,28]. Both Balzan et al. [25] and Warman et al. [28]
de-termined delusion-proneness based on median split of the PDI total score. The PDI total score is an aggregate score of the number of delusion-like beliefs endorsed on the PDI and three suggested editors or reviewers. This does not alter
dimensions of delusions (conviction, distress and preoccupation). Therefore, an individual who endorses only a few highly distressing or preoccupying beliefs may have a similar PDI total score with an individual who endorses many non-distressing or non-preoccupying beliefs.
Instead of the total score, Preti et al. [32] reported a reliable cutoff criterion using number of
beliefs on the PDI. According to Preti et al. [32], a threshold of eight delusion-like beliefs on
the PDI reliably discriminated patients with psychosis from healthy individuals, with 74% sen-sitivity and 79% specificity. With the expected high negative predictive value of 96%, Preti et al.
[32] recommended PDI as a tool for assessing psychosis proneness among
non-clinical samples.
The present study aimed to expand on the existing literature and revisit the tendency of JTC varying along the delusional spectrum using both the easier (85:15) and harder (60:40) versions of the beads task, across groups that are defined by a reliable psychometric cutoff criterion.
Based on previous studies, key hypotheses were as follows:
1. on the easier (85:15) beads task, the number of beads drawn to decision will be the smallest in the clinical group, followed by the delusion-prone group, and then the non-delusion-prone group;
2. on the harder (60:40) beads task, the number of beads drawn to decision will be the smallest in the clinical group, followed by the delusion-prone group, and then the non-delusion-prone group;
3. there will be a stronger association between data gathering and PDI scores in the clinical group than the non-clinical groups.
Methods
This study was approved by the New Territories West Cluster Research Ethics Committee (Reference number: NTWC/CREC/476/06), Hong Kong.
Participants
Patients were recruited from an early intervention programme at Castle Peak Hospital for psy-chosis in Hong Kong. Adult patients with a casenote diagnosis of schizophrenia spectrum dis-order with present delusions were included. Exclusion criteria were learning disability, organic brain disorders and drug-induced psychosis. Before patients were invited to take part in the study, their capacity to give consent to study participation was ascertained by their treating psychiatrists. Non-clinical controls were recruited from educational and community institutes. Only adults with no personal or family history of psychiatric illness were included in the study. All participants gave written informed consent to join the study in person.
Measures
Positive and Negative Syndrome Scale (PANSS) [33]. Symptomatology of patients was assessed by their treating psychiatrists using PANSS. PANSS consists of symptoms commonly reported in schizophrenia, grouped into three subscales: positive (7 items), negative (7 items), general psychopathology (16 items), and a total score. Good psychometric properties of
PANSS have been reported [33].
Beads Tasks. ‘Jumping to conclusions’(JTC) was assessed using the 85:15 and 60:40
ver-sions of the beads task [34–35]. All participants completed the 85:15 task first, followed by the
predetermined order unknown to the participant, one by one with replacement. Upon presen-tation of each bead, the participant can either make a decision on which jar the beads are drawn from or request to view more beads. All the beads that have been drawn remain in view. The procedure of the 60:40 beads task is the same as the 85:15 version, but the two jars contain
blue and red beads in a ratio of 60:40 and 40:60 respectively [36]. The predetermined sequences
of bead presentation in the two tasks (as shown below) are similar to previous studies using the
same tasks [34–38]:
85:15 beads task (= orange,●= black):
● ● ● ●
60:40 beads task (= blue,●= red):
● ● ● ● ● ●● ●
The number of draws to decision (DTD) was recorded as a measure of data-gathering style.
Garety et al [39] suggested dichotomizing the DTD measure into presence and absence of an
extreme JTC bias, with two beads or fewer classified as an extreme JTC response, and this
method of assessing JTC has been used in numerous studies (e.g. [35,39–42]).
The 21-item Peters et al. Delusions Inventory (PDI-21) [31]. PDI-21 [31] is a self-rated questionnaire of delusional ideation. Participants were asked if they had experienced any of the 21 delusion-like beliefs (yes/no), and for each endorsed belief, to rate their degrees of convic-tion, distress and preoccupation on a 5-point Likert scale respectively. In the original PDI-21, the conviction score, distress score, and preoccupation score are obtained by adding up the
di-mension ratings for all the endorsed beliefs (range 0–105 for each dimension). The PDI total
score is the sum of all the dimension scores and the number of beliefs (range 0–336). In order
to examine the relationship between reasoning bias and delusional dimensions more specifical-ly (independent of the number of beliefs endorsed), we included in this study all the original
PDI measures as well as average levels of conviction, distress, and preoccupation (range 0–5 for
each dimension). This strategy of analysing average dimension scores has been adopted in
re-cent PDI studies [32,43].
All participants completed the PDI and the beads tasks in the presence of the researcher.
Statistical analysis
To compare JTC style across the three groups (clinical, delusion-prone, and non-delusion-prone groups), group difference in DTD was tested using one-way ANOVAs, whereas
preva-lence of JTC bias and error rates were compared using chi-square tests (or Fisher’s exact tests
in case of any expected value smaller than 5). Where group differences were found, these were followed by Bonferroni pairwise comparisons (for continuous variables) and 2x2 chi-square or
Fisher’s exact tests (for categorical variables). To explore the relationship between beads task
performance and PDI dimensions, a series of regression analyses with the PDI scores as IVs and various beads task measures as DVs were performed using data from the three
groups respectively.
Results
Demographics and delusional dimensions across groups
This sample (N = 95) consisted of 28 patients with delusions and 67 individuals from the com-munity. Among the non-clinical participants, the mean number of PDI beliefs endorsed was
(SD = 33.15, median = 65, range = 4–132). According to Preti et al (2007), 35 (52.2%) individu-als endorsed eight or more delusion-like experiences on the PDI and were categorised into the
‘delusion-prone’group, whereas the remaining 32 (47.8%) were categorised into the‘
non-delusion-prone’group. Preti et al’s (2007) cut-off of eight PDI beliefs coincides with the
medi-an number of beliefs endorsed in this sample. Therefore, medimedi-an split of PDI number of beliefs
would yield the same grouping of non-clinical individuals as Preti et al’s (2007)
psychometric cutoff.
Gender distribution was comparable across groups (Percentage of male participants: 46.4%
in clinical group, 40.0% in delusion-prone group, 28.1% in non-delusion-prone group;χ2(2,
n = 95) = 2.23,p= .328). There was a significant group difference in age (F(2,92) = 3.29,
p= .042), with a non-significant trend of the patients (mean 21.25 years; SD = 3.65) being
older than the delusion-prone group (mean 19.51 years; SD = 2.37;p= .058). Year of education
differed across groups (F(2,88) = 18.52,p<. 001), with patients having less education (mean
10.88 years; SD = 2.59) than both the delusion-prone (mean 13.60 years; SD = 1.63;p<. 001)
and the non-delusion-prone (mean 13.84 years; SD = 1.76;p<. 001) groups.
Information on medication was available for 26 patients. Fourteen patients were on atypical antipsychotics (Risperidone, Olanzapine, Quetiapine, Amisulpiride, Clozapine and Ziprasi-done), nine were on typicals (Zuclopenthixol, Haloperidol, and Flupentixol), and three were not on any anti-psychotics. The mean dose of antipsychotics in chlorpromazine equivalents
[44–45] was 244.32 mg/day (SD = 170.44).
In the clinical group, the average PANSS scores were as follows: positive 19.50 (SD = 6.94,
range 8–33), negative 16.79 (SD = 6.53, range 7–28), general psychopathology 37.25
(SD = 13.12, range 16–57), and delusion item score 3.71 (SD = 1.24, range 2–5).
PDI scores of the groups are presented inTable 1. There was a significant group difference
in PDI total score (p<. 001) and number of delusion-like beliefs endorsed (p<. 001). Post-hoc
Bonferroni tests revealed a significantly higher PDI total score in the delusion-prone group
than patients (p<. 001), and a significantly higher PDI total score in patients than the
non-de-lusion-prone group (p= .001). A similar graded pattern was found in the number of
delusion-like beliefs endorsed, with the delusion-prone group endorsing significantly more delusion-delusion-like
Table 1. Mean (SD) of the Peters et al. Delusions Inventory (PDI) scores.
Patients Delusion-Prone Non-delusion-prone Group difference*
PDI Total score (n = 26) (n = 34) (n = 32) F(2,89) = 25.619
69.38(40.50) 90.68(22.65) 40.81(20.89) p<.001
Number of beliefs (n = 28) (n = 35) (n = 32)
7.11(3.82) 10.00(1.80) 4.84(1.97) F(2,92) = 32.985
range:1–14 range:8–14 range:1–7 p<.001
PDI Conviction (n = 26) (n = 34) (n = 32)
Total 21.38(12.18) 30.32(8.80) 13.91(6.86) F(2,89) = 1.015
Per belief 2.81(0.87) 3.02(0.63) 2.77(0.80) p= .367
PDI Distress (n = 26) (n = 35) (n = 32)
Total 20.62(13.12) 24.83(7.38) 10.81(6.64) F(2,90) = 5.197
Per belief 2.70(0.87) 2.48(0.59) 2.09(0.75) p= .007
PDI Preoccupation (n = 27) (n = 35) (n = 32)
Total 19.19(13.45) 25.37(7.00) 11.25(6.46) F(2,91) = 2.637
Per belief 2.49(0.81) 2.53(0.53) 2.17(0.72) p= .077
beliefs than patients (p<. 001), and patients endorsing more beliefs than the
non-delusion-prone group (p= .003).
For delusional dimensions, significance of group difference was tested for average level of dimensions per belief, and not for total dimension scores. There was a significant group differ-ence in delusional distress, with the non-delusion-prone group lower than the clinical group
(p= .007). Group difference was not significant for delusional preoccupation and conviction
(p>. 05).
Data-gathering style across groups
Performance of the two versions of the beads task across groups is presented inFig. 1, Tables2
and3. Across groups, number of beads drawn to decision was significantly lower in the easier
Fig 1. Performance of the two beads tasks across groups.
doi:10.1371/journal.pone.0121347.g001
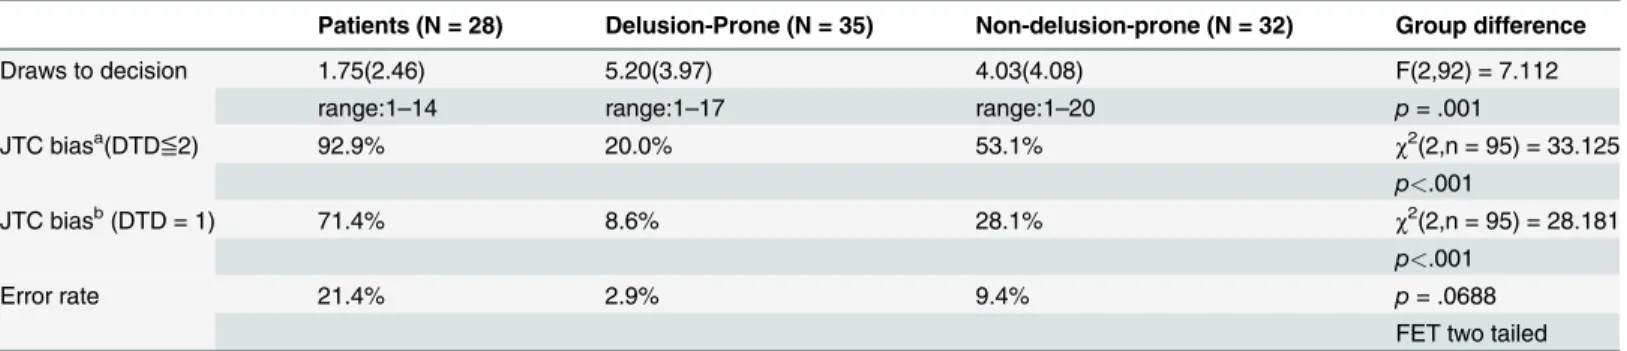
Table 2. Performance on the 85:15 beads task across groups.
Patients (N = 28) Delusion-Prone (N = 35) Non-delusion-prone (N = 32) Group difference
Draws to decision 1.75(2.46) 5.20(3.97) 4.03(4.08) F(2,92) = 7.112
range:1–14 range:1–17 range:1–20 p= .001
JTC biasa(DTD≦2) 92.9% 20.0% 53.1% χ2(2,n = 95) = 33.125
p<.001
JTC biasb(DTD = 1) 71.4% 8.6% 28.1%
χ2(2,n = 95) = 28.181 p<.001
Error rate 21.4% 2.9% 9.4% p= .0688
FET two tailed aDe
fined by making a decision after viewing two or fewer beads bDe
beads task (85:15 task) than the more difficult one (60:40 task): patients (mean difference =
-0.57; SD = 1.48;p= .05), delusion-prone individuals (mean difference = -4.06; SD = 3.02;
p<. 001) and non-delusion-prone individuals (mean difference = -2.72; SD = 2.75;p<. 001).
Age was not significantly correlated with the number of draws to decision (DTD) in any of the
groups for either beads task (p>. 05). Level of education, however, was correlated with DTD
on the 60:40 beads task within the delusion-prone group only (r = .39,p= .019). Level of
educa-tion was not correlated with DTD on the 85:15 beads task in any group, or with prevalence of
JTC bias and error rate on the 60:40 task in any group (p>. 05).
Hypothesis 1: on the easier (85:15) beads task, the number of beads drawn to decision will be the smallest in the clinical group, followed by the delusion-prone group, and then the non-delusion-prone group. As shown inTable 2, there was a significant group difference
in DTD on the 85:15 beads task (p= .001). Post-hoc Bonferroni tests showed that patients
drew significantly fewer beads than the delusion-prone group (p= .001). There was a statistical
trend that patients drew fewer beads than non-delusion-prone individuals (p= .052), whereas
the two non-clinical groups did not differ from each other (p= .576).
With a three-by-two chi-square test, a significant group difference in prevalence of JTC bias
(defined by decision after viewing two or fewer beads) was found across all groups (χ2(2,
n = 95) = 33.125,p<. 001). Two-by-two chi-square tests revealed that JTC was more prevalent
in patients than in the non-delusion-prone group (χ2(1, n = 60) = 11.61,p= .001), and more
prevalent in the non-delusion-prone group than in the delusion-prone group (χ2(1, n = 67) =
7.979,p= .005).
Extreme JTC bias (defined by decision after viewing one bead only) was also significantly
different across the three groups (χ2(2, n = 95) = 28.181,p<. 001). Two-by-two chi-square
tests revealed that an extreme JTC bias was more common in patients than in
non-delusion-prone group (χ2(1, n = 60) = 11.214,p= .001), and more common in the non-delusion-prone
group than in the delusion-prone group (χ2(1, n = 67) = 4.347,p= .037).
A three-by-two Fisher’s exact test revealed no significant group difference in error rate
(p= .0688, two tailed).
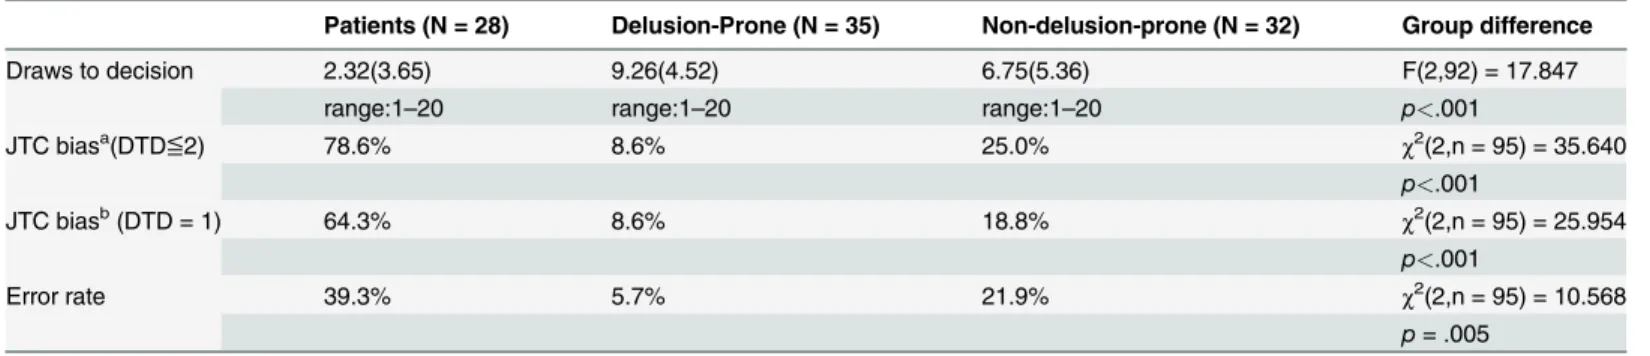
Hypothesis 2: on the harder (60:40) beads task, the number of beads drawn to decision will be the smallest in the clinical group, followed by the delusion-prone group, and then the non-delusion-prone group. As shown inTable 3, there was a significant group difference
in DTD on the 60:40 beads task (p<. 001). Post-hoc Bonferroni tests showed that DTD was
significantly fewer in patients than in both delusion-prone (p<. 001) and non-delusion-prone
(p= .001) groups, which did not differ from one another (p= .085).
Table 3. Performance on the 60:40 beads task across groups.
Patients (N = 28) Delusion-Prone (N = 35) Non-delusion-prone (N = 32) Group difference
Draws to decision 2.32(3.65) 9.26(4.52) 6.75(5.36) F(2,92) = 17.847
range:1–20 range:1–20 range:1–20 p<.001
JTC biasa(DTD≦2) 78.6% 8.6% 25.0% χ2(2,n = 95) = 35.640
p<.001
JTC biasb(DTD = 1) 64.3% 8.6% 18.8%
χ2(2,n = 95) = 25.954 p<.001
Error rate 39.3% 5.7% 21.9% χ2(2,n = 95) = 10.568
p= .005 aDe
fined by making a decision after viewing two or fewer beads bDe
A three-by-two chi-square test revealed a significant group difference in prevalence of JTC
(defined by decision after viewing two or fewer beads) (χ2(2, n = 95) = 35.64,p<. 001).
Two-by-two chi-square tests showed that JTC was more common in the clinical group than both the
delusion-prone (χ2(1, n = 63) = 31.845,p<. 001) and non-delusion-prone (χ2(1, n = 60) =
17.143,p<. 001) groups, which did not differ from one another (p= .070).
Extreme JTC (defined by decision after viewing one bead only) was different across groups
(χ2(2, n = 95) = 25.95,p<. 001). Two-by-two chi-square tests showed a higher prevalence of
extreme JTC bias in patients relative to both delusion-prone (χ2(1, n = 63) = 21.729,p<. 001)
and non-delusion-prone (χ2(1, n = 60) = 12.902,p<. 001) groups. The two non-clinical groups
did not differ from one another (p= .292, Fisher’s exact test two-tailed).
There was a significant group difference in error rate (χ2(2, n = 95) = 10.568,p= .005).
Two-by-two chi-square tests revealed significant group difference in error rate between
pa-tients and the delusion-prone group (χ2(1, n = 63) = 10.705,p= .001) only.
Hypothesis 3: There will be a stronger association between data gathering and PDI scores in the clinical group than the non-clinical groups. For the clinical and the delusion-prone groups, linear regression analyses of PDI scores as IVs and beads task measures as DVs
failed to generate any statistically significant model (p>. 05). Delusional dimensions on the
PDI did not predict any of the beads task measures.
For the non-delusion-prone group, the PDI total score significantly predicted DTD on the
85:15 task (Beta = 0.499, SE = 0.031,t= 3.156,p= .004), and delusional preoccupation
signifi-cantly predicted DTD on the 60:40 task (Beta = 0.471, SE = 1.197,t= 2.923,p= .007).
De-lusional preoccupation also significantly predicted JTC bias of the 60:40 task (B = -3.938,
SE = 1.902, Waldχ2(1) = 4.288,p= .038).
Discussion
This study compared the beads task performance in patients with delusions, participants from the community who met the criterion of delusion proneness, and non-delusion-prone individ-uals. We found that, on the less ambiguous version of the beads task (with the colour ratio 85:15), the jumping to conclusions (JTC) bias was stronger in patients, followed by non-delu-sion-prone individuals, and then delunon-delu-sion-prone individuals. On the more ambiguous version of the beads task (with an 60:40 colour ratio), the pattern of group difference was the same but the difference between the two non-clinical groups was not statistically significant. A hasty de-cision making style was more prevalent among patients than the non-clinical groups on both versions of the beads task.
With the same pattern of group difference for both beads tasks in our study, Warman
et al.’s [28] hypothesis that delusion-prone individuals, in particular, adjusted their data
gather-ing strategies to a difficult task was not supported. On the contrary, consistent with other
stud-ies that included both versions of the beads task (e.g. [36,38,40]), all groups drew significantly
more beads in the more difficult version. This suggests that clinical and non-clinical partici-pants, across studies, understand and respond to the varying task instructions and demands.
The finding that patients had a more hasty decision-making style than non-clinical
partici-pants replicated previous studies (e.g., [2,4,37,41]), confirming the role of JTC in predicting
the presence of delusions. However, the hypothesised stepped decrease in JTC bias along the
delusional continuum (i.e. patients>delusion-prone group>non-delusion-prone group),
es-pecially the expected difference between the two non-clinical groups, was not found. On both beads tasks, the delusion-prone individuals actually gathered more information to make
deci-sions than the non-delusion-prone individuals, which replicated findings in Freeman et al. [26]
DTD and prevalence of JTC bias of the non-clinical groups reported in the present study were comparable to both said studies. However, the difference between the non-clinical groups (i.e. a stronger JTC bias in non-delusion-prone than delusion-prone individuals) reached statistical significance for the first time in the present study. With at least three published studies to date reporting less JTC in delusion-prone than non-delusion-prone individuals, it is conceivable that the predictive nature of JTC on delusions may not be linear.
Evidence supporting the role of JTC in delusion development is most marked when patients
are compared with non-clinical individuals (see review by [4]). When at-risk or
delusion-prone groups are included, the effect of JTC on delusions becomes less explicit. This may sim-ply be due to the smaller difference in both JTC tendency and delusion severity across compari-son groups. For example, non-clinical studies that reported more JTC in delusion-prone than non-delusion-prone individuals tended to adopt a percentile split, yielding two non-clinical
groups more widely apart on delusion-proneness than studies using a median split [19,21].
However, studies that investigated the link between JTC and delusion-proneness based on
me-dian split grouping or correlation approaches did not provide consistent results [20,22,23,25,
28,46].
Another possibility is that the JTC style only reliably distinguishes risk of delusions when it becomes extreme (i.e. decision after viewing only 1 to 2 beads, as in the clinical group). After the first few bead draws, the subsequent beads requested may have a diminishing marginal ef-fect in differentiating risk of delusions. In fact, with studies including clinical samples only, the systematic association between JTC and severity of delusions is not consistently reported (e.g.
[47–48]). Similarly, clinical and non-clinical studies using multi-dimensional measures found
inconsistent results regarding the association between JTC and dimensions of delusions
[22,23,49]. We did not find a closer link between JTC and delusional ideation in the clinical
group as compared with healthy controls. Therefore, while the JTC bias is associated categori-cally with the presence of delusions, there is less evidence supporting a linear relationship
be-tween JTC and severity of or predisposition to delusions. As suggested by Van Dael et al. [27],
it is possible that cognitive processes in patients with delusions are not dysfunctional under op-timal environmental conditions, but are more susceptible to impact from adverse events than
those of individuals who never have delusional experiences. Bentall et al. [50] argued for a
com-bination of affective and cognitive processes (including JTC) in contributing to paranoia across clinical and non-clinical groups. Therefore, a more reliable prediction of the risk of developing delusions may take into account other psychosocial factors that may mediate or interact with JTC.
Using an established PDI threshold [32], the present study included delusion-prone
individ-uals who reported delusional ideation that was not less prominent than the clinical group. Rather, delusion-prone individuals in this study endorsed a greater number of delusion-like be-liefs and had a higher PDI total score than patients. Previous studies using the PDI have
re-ported number of beliefs endorsed in non-clinical individuals ranging from 5.40 to 11.32 [23,
51–54]. Mean number of PDI beliefs endorsed in the present study (7.54) posits our
non-clinical sample within the wide range of previous studies. On the other hand, mean number of beliefs endorsed by our patients (7.11) appeared to be smaller than that reported by previous
studies (e.g. 11.8 in Peters et al. [55], 8.76 in Lim et al. [52]). The mean PDI total score in our
patients (69.38) was also smaller than in previous studies (e.g. 128.14 in Kao et al. [51]; 91.04 in
Lim et al. [52]). It is possible that our patients, who had first-episode psychosis, had lower
delusional distress was significantly higher in patients than in non-delusion-prone individuals, which replicates previous findings and confirms the importance of delusional distress in
differ-entiating clinical and non-clinical populations [54,56]. Altogether, the present findings make
one wonder how the delusion-prone individuals, with a high level of delusional ideation but a lack of a hasty decision-making style, maintain their functioning without the need for clinical care. It has been postulated that JTC and belief flexibility may jointly contribute to delusion de-velopment, where a lack of JTC creates doubt for the individual to consider alternative
explana-tions [26,39,54]. This theory has been tested in clinical samples only [39,57].
The present study has several limitations. Data-gathering style was measured using number of beads drawn to decision, which was suggested to be the most reliable measure of JTC in
dif-ferentiating individuals with and without delusions [2]. However, we did not record
partici-pants' confidence of their decision, which had anecdotally been reported as different between
groups varying in delusion-proneness [28]. Moreover, patients were recruited based on
case-note diagnoses. Although present delusion was checked using the PANSS, a standardized diag-nostic procedure would increase assessment reliability. This study also lacked a formal screening procedure to confirm the absence of mental illness in the non-clinical individuals. In addition, our patients were not matched with the non-clinical individuals on age and year of education. Although our major findings were not affected by this difference, a perfectly matched control group would strengthen the interpretability of the results. It will also be bene-ficial to have a measure of general intelligence, which has been associated with JTC bias in
some studies [23,27,37].
Future research on JTC, using multiple measures, as well as its interaction with belief flexi-bility in delusion-proneness may extend our understanding of the role of cognitive processes between the non-clinical and clinical ends of the delusion spectrum. This can then be followed by examining the effect of interventions targeting specific cognitive processes in reducing
sub-clinical delusions or in delaying transition into psychosis (e.g. metacognitive training) [5–6].
Acknowledgments
The authors would like to thank all participants for their time.
Author Contributions
Conceived and designed the experiments: SHS NTKK. Performed the experiments: SHS NTKK. Analyzed the data: SHS NTKK. Contributed reagents/materials/analysis tools: SHS NTKK. Wrote the paper: SHS NTKK.
References
1. Garety PA, Freeman D. Cognitive approaches to delusions: a critical review of theories and evidence. Br J Clin Psychol. 1999; 38(Pt 2): 113–154. PMID:10389596
2. Fine C, Gardner M, Craigie J, Gold I. Hopping, skipping or jumping to conclusions? Clarifying the role of the JTC bias in delusions. Cogn Neuropsychiatry. 2007; 12(1): 46–77. PMID:17162446
3. Freeman D, Garety P. Advances in understanding and treating persecutory delusions: a review. Soc Psychiatry Psychiatr Epidemiol. 2014; 49: 1179–1189. doi:10.1007/s00127-014-0928-7PMID: 25005465
4. Garety PA, Freeman D. The past and future of delusions research: from the inexplicable to the treat-able. Br J Psychiatry. 2013; 203(5): 327–333. doi:10.1192/bjp.bp.113.126953PMID:24187067 5. Moritz S, Andreou C, Schneider BC, Wittekind CE, Menon M, Balzan RP, et al. Sowing the seeds of
doubt: A narrative review on metacognitive training in schizophrenia. Clin Psychol Rev. 2014; 34(4): 358–366. doi:10.1016/j.cpr.2014.04.004PMID:24866025
delusions. J Behav Ther Exp Psychiatry. 2011; 42(3): 414–421. doi:10.1016/j.jbtep.2011.03.001 PMID:21481815
7. Claridge G. "The schizophrenias as nervous types" revisited. Br J Psychiatry. 1987; 151: 735–743. PMID:3332195
8. Freeman D. Delusions in the nonclinical population. Curr Psychiatry Rep. 2006; 8(3): 191–204. PMID: 19817069
9. Johns LC, van Os J. The continuity of psychotic experiences in the general population. Clin Psychol Rev. 2001; 21(8): 1125–1141. PMID:11702510
10. Kelleher I, Cannon M. Psychotic-like experiences in the general population: characterizing a high-risk group for psychosis. Psychol Med. 2011; 41(01): 1–6.
11. Myin-Germeys I, Krabbendam L, van Os J. Continuity of psychotic symptoms in the community. Curr Opin Psychiatry. 2003; 16(4): 443–449.
12. Strauss JS. Hallucinations and delusions as points on continua function: rating scale evidence. Arch Gen Psychiatry. 1969; 21(5): 581–586. PMID:5823480
13. Taylor HE, Stewart SL, Dunn G, Parker S, Bentall RP, Birchwood M, et al. Psychopathology and affect dysregulation across the continuum of psychosis: a multiple comparison group study. Early Interv Psy-chiatry. 2014; 8(3):221–8. doi:10.1111/eip.12064PMID:23773506
14. van Os J, Hanssen M, Bijl RV, Ravelli A. Strauss (1969) revisited: a psychosis continuum in the general population?. Schizophr Res. 2000; 45(1): 11–20.
15. van Os J, Hanssen M, Bijl RV, Vollebergh W. Prevalence of psychotic disorder and community level of psychotic symptoms: an urban-rural comparison. Arch Gen Psychiatry. 2001; 58(7): 663–668. PMID: 11448373
16. van Os J, Linscott RJ, Myin-Germeys I, Delespaul P, Krabbendam L. A systematic review and meta-analysis of the psychosis continuum: Evidence for a psychosis proneness-persistence-impairment model of psychotic disorder. Psychol Med. 2009; 39: 179–195. doi:10.1017/S0033291708003814 PMID:18606047
17. Chapman LJ, Chapman JP. Scales for rating psychotic and psychotic-like experiences as continua. Schizophr Bull. 1980; 6(3): 476–489.
18. Verdoux H, van Os J. Psychotic symptoms in non-clinical populations and the continuum of psychosis. Schizophr Res. 2002; 54(1–2): 59–65. PMID:12051177
19. Colbert SM, Peters ER. Need for closure and jumping-to-conclusions in delusion-prone individuals. J Nerv Ment Dis. 2002; 190(1): 27–31. PMID:11838027
20. Freeman D, Pugh K, Garety P. Jumping to conclusions and paranoid ideation in the general population. Schizophr Res. 2008; 102(1–3): 254–260. doi:10.1016/j.schres.2008.04.011PMID:18514488 21. White LO, Mansell W. Failing to ponder? Delusion-prone individuals rush to conclusions. Clin Psychol
Psychother. 2009; 16(2): 111–24. doi:10.1002/cpp.607PMID:19277988
22. Freeman D, Pugh K, Antley A, Slater M, Bebbington P, Gittins M, et al. Virtual reality study of paranoid thinking in the general population. Br J Psychiatry. 2008; 192(4): 258–263. doi:10.1192/bjp.bp.107. 044677PMID:18378984
23. Rodier M, Prévost M, Renoult L, Lionnet C, Kwann Y, Dionne-Dostie E, et al. Healthy people with de-lusional ideation change their mind with conviction. Psychiatry Res. 2011; 189(3): 433–439. doi:10. 1016/j.psychres.2011.06.018PMID:21763003
24. Warman D. Reasoning and Delusion Proneness: Confidence in Decisions. J Nerv Ment Dis. 2008; 196(1): 9–15. doi:10.1097/NMD.0b013e3181601141PMID:18195636
25. Balzan RP, Delfabbro PH, Galletly CA, Woodward TS. Over-adjustment or miscomprehension? A re-examination of the jumping to conclusions bias. Aust N Z J Psychiatry. 2012; 46(6): 532–540. doi:10. 1177/0004867411435291PMID:22679205
26. Freeman D, Pugh K, Vorontsova N, Antley A, Slater M. Testing the continuum of delusional beliefs: An experimental study using virtual reality. J Abnorm Psychol. 2010; 119(1): 83–92. doi:10.1037/ a0017514PMID:20141245
27. Van Dael F, Versmissen D, Janssen I, Myin-Germeys I, van Os J, Krabbendam L. Data gathering: Bi-ased in psychosis? Schizophr Bull. 2006; 32(2): 341–351. PMID:16254066
28. Warman DM, Lysaker PH, Martin JM, Davis L, Haudenschield SL. Jumping to conclusions and the con-tinuum of delusional beliefs. Behav Res Ther. 2007; 45(6): 1255–1269. PMID:17052687
30. Green CEL, Freeman D, Kuipers E, Bebbington P, Fowler D, Dunn G, et al. Measuring ideas of perse-cution and social reference: the Green et al. Paranoid Thought Scales (GPTS). Psychol Med. 2008; 38(1): 101–111. PMID:17903336
31. Peters E, Joseph S, Day S, Garety P. Measuring delusional ideation: The 21-item Peters et al. Delu-sions Inventory (PDI). Schizophr Bull. 2004; 30(4): 1005–1022. PMID:15954204
32. Preti A, Rocchi MB, Sisti D, Mura T, Manca S, Siddi S, et al. The psychometric discriminative properties of the Peters et al Delusions Inventory: a receiver operating characteristic curve analysis. Compr Psy-chiatry. 2007; 48(1): 62–69. PMID:17145284
33. Kay SR, Opler LA, Fiszbein A. Positive and Negative Syndrome Scale (PANSS) Rating Manual. San Rafael, CA: Social and Behavioral Sciences Documents; 1987.
34. Huq SF, Garety PA, Hemsley DR. Probablilistic judgements in deluded and non-deluded subjects. Q J Exp Psychol A. 1988; 40: 801–812. PMID:3212213
35. Garety PA, Hemsley DR, Wessely S. Reasoning in deluded schizophrenic and paranoid patients: Bi-ases in performance on a probabilistic inference task. J Nerv Ment Dis. 1991; 179: 194–201. PMID: 2007889
36. Dudley REJ, John CH, Young AW, Over DE. Normal and abnormal reasoning in people with delusions. Br J Clin Psychol. 1997; 36: 243–258. PMID:9167864
37. Falcone MA, Murray RM, Wiffen BD, O’Connor JA, Russo M, Kolliakou A, et al. Jumping to conclusions, neuropsychological functioning, and delusional beliefs in first episode psychosis. Schizophr Bull. 2014: sbu104.
38. Ross K, Freeman D, Dunn G, Garety P. A randomised experimental investigation of reasoning training for people with delusions. Schizophr Bull. 2011; 37(2): 324–333. doi:10.1093/schbul/sbn165PMID: 19520745
39. Garety PA, Freeman D, Jolley S, Dunn G, Bebbington PE, Fowler DG, et al. Reasoning, Emotions, and Delusional Conviction in Psychosis. J Abnorm Psychol. 2005; 114(3): 373–384. PMID:16117574 40. Dudley R, Shaftoe D, Cavanagh K, Spencer H, Ormrod J, Turkington D, et al.“Jumping to conclusions”
in first-episode psychosis. Early Interv Psychiatry. 2011; 5: 50–56. doi:10.1111/j.1751-7893.2010. 00258.xPMID:21272275
41. So SHW, Freeman D, Garety, P. Impact of state anxiety on the jumping to conclusions delusion bias. Aust N Z J Psychiatry. 2008; 42(10): 879–886. doi:10.1080/00048670802345466PMID:18777232 42. Startup H, Freeman D, Garety PA. Jumping to conclusions and persecutory delusions. Eur Psychiatry.
2008; 23: 457–459. doi:10.1016/j.eurpsy.2008.04.005PMID:18585008
43. Sisti D, Rocchi MBL, Siddi S, Mura T, Manca S, Preti A, et al. Preoccupation and distress are relevant dimensions in delusional beliefs. Compr Psychiatry. 2012; 53(7): 1039–1043. doi:10.1016/j. comppsych.2012.02.005PMID:22444950
44. Andreasen NC, Pressler M, Nopoulos P, Miller D, Ho BC. Antipsychotic dose equivalents and dose-years: A standardized method for comparing exposure to different drugs. Biol Psychiatry. 2010; 67(3): 255–262. doi:10.1016/j.biopsych.2009.08.040PMID:19897178
45. Woods SW. Chlorpromazine equivalent doses for the newer atypical antipsychotics. J Clin Psychiatry. 2003; 64(6): 663–667. PMID:12823080
46. McKay R, Langdon R, Coltheart M. Need for closure, jumping to conclusions, and decisiveness in delu-sion-prone individuals. J Nerv Ment Dis. 2006; 194(6): 422–426. PMID:16772859
47. Colbert SM, Peters ER, Garety PA. Delusions and belief flexibility in psychosis. Psychol Psychother. 2010; 83(Pt 1): 45–57. doi:10.1348/147608309X467320PMID:19712542
48. Menon M, Addington J, Remington G. Examining cognitive biases in patients with delusions of refer-ence. Eur Psychiatry. 2011; 28(2): 71–73. doi:10.1016/j.eurpsy.2011.03.005PMID:21658918 49. Ziegler M, Rief W, Werner SM, Mehl S, Lincoln TM. Hasty decision-making in a variety of tasks: does it
contribute to the development of delusions? Psychol Psychother. 2008; 81(Pt 3): 237–247. doi:10. 1348/147608308X297104PMID:18426693
50. Bentall RP, Rowse G, Shryane N, Kinderman P, Howard R, Blackwood N, et al. The cognitive and af-fective structure of paranoid delusions: A transdiagnostic investigation of patients with schizophrenia spectrum disorders and depression. Arch Gen Psychiatry. 2009; 66(3): 236–247. doi:10.1001/ archgenpsychiatry.2009.1PMID:19255373
51. Kao YC, Wang TS, Lu CW, Cheng TH, Liu YP. The psychometric properties of the Peters et al. Delu-sions Inventory (PDI) in Taiwan: reliability, validity, and utility. Soc Psychiatry Psychiatr Epidemiol. 2012; 47(8): 1221–1234. doi:10.1007/s00127-011-0428-yPMID:21861160
53. Peter ER, Joseph SA, Garety PA. Measurement of delusional ideation in the normal population: intro-ducing the PDI (Peters et al. Delusions Inventory). Schizophr Bull. 1999; 25(3): 553–576. PMID: 10478789
54. Warman DM, Martin JM. Jumping to conclusions and delusion proneness: The impact of emotionally salient stimuli. J Nerv Ment Dis. 2006; 194(10): 760–765. PMID:17041288
55. Peters E, Day S, McKenna J, Orbach G. Delusional ideation in religious and psychotic populations. Br J Clin Psychol. 1999; 38(1): 83–96.
56. Balzan R, Delfabbro P, Galletly C. Delusion-proneness or miscomprehension? A re-examination of the jumping-to-conclusions bias. Aust J Psychol. 2012; 64(2): 100–107.