CONSERVATION AND VALORIZATION OF THE HISTORICAL HERITAGE
THROUGH LASER SCANNER TECNOLOGY
F. Guzzettia, N. Cattaneoa, F. Tosob, A. Priviteraa
a
Dept. of Architecture, Built environment and Construction engineering (ABC), Polytechnic of Milan, 20133, Milan - [email protected] b
Dept. DAStU, Polytechnic of Milan, 20133, Milan–[email protected]
KEY WORDS:Laser scanner survey, Architectural conservation, Point cloud
ABSTRACT:
In Italy there is a very widespread multitude of buildings important and interesting in the field of Cultural Heritage. Several of them have been abandoned in the last decades and now they show all the deterioration and the structural damages due to abandon. This is also the case of about forty traditional farmsteads located in the close suburbs of the city of Milano and belonging to the local administration. Among these farmsteads, Cascina Linterno, for its rich historical background going back to the 14th century and earlier, was chosen to carry out a test in the planning process with the participation of local associations under the supervision of a group of experts in the field of structural assessment, preservation and design from Politecnico of Milan. Time and resources saving and effectiveness of appropriate activities is the main guideline of this process, where the first step consists necessarily on the topographical survey. The choice of Terrestrial Laser Scanner to carry out the survey complied naturally most necessities, but it was also meant to provide new challenges in the fruition of the point cloud by groups of experts without topographical knowledge. The aim is to analyze the procedures and the output needed by the different specialists involved in this kind of intervention on Cultural Heritage, in order to provide friendly tools to work directly on the point cloud, taking advantage of its rapidity in acquisition and of its richness of details, thus avoiding the production oftraditional “lossy” layouts.
1. INTRODUCTION
Buildings belonging to Cultural Heritage and no longer in use, are often in bad state of disrepair and similar situations can be found all around Italy. In most cases these sites have already been a subject for a wide set of studies, analysis or inventories which did not led to any restoration activity. Some of these studies, for example degree-thesis in Architectural, Historical or Cultural Heritage studies, are very detailed and rich in accurate information.
Cascina Linterno, a farmstead located in the western side of the city of Milano, rich in historical background and surely dated before the 14th century, provides a very typical frame of this kind of situation: a very accurate thesis was made in 2010 by Francesco Carlo Toso and Ilaria Gelmo as well as restoration projects, but for several reasons the works never started, and most basic interventions to protect the building from further deterioration took place thanks to the intervention of a local association.
Recently the Council of Milano sponsored by Fondaizone CaRiPlo decided to engage a group of expert from Politecnico di Milano, leaded by prof. Lionella Scazzosi, to carry out a renovation project meant to optimized the financial resources in order to make this site usable.
A wide set of documentation was already available: a topographical survey had been already carried out and layouts of plans, sections and elevations at scale 1:100 and 1:50 were available. Nevertheless in most cases there is not a survey report, useful to know how reliable the data are, when they were acquired, and which instruments were used. And in any case these layouts describe structures that later years of abandon may have changed. Moreover the variety of experts already involved
and not yet involved in the project makes it difficult to make sure that the dataset fulfills all their requirements.
In this outline a Terrestrial Laser Scanner (TLS) survey has been immediately taken into consideration as the most suitable procedure to set a zero-level of the survey, which means that all the previous layouts, if needed, can be used after a comparison with TLS data only for the purposes admitted by the results of the comparison. This is what happened also in the case of Cascina Linterno.
One important constraint that led to the choice of TLS technology was a low safety level on site, considered not sufficient for conducting a direct survey inside the building. In Cascina Linterno, as well as in all the buildings in precarious structural conditions, the choice of TLS technology is very appropriate because it collects an enormous set of data in a very short time, thus reducing the permanence time of operators in dangerous places. In particular the use of laser-scanner FARO CAM2 Focus 3D, which is very small and light and makes use of a likewise small and handy tripod, enabled one single operator to carry, place and use the instrument also in hardly accessible, dark and unstable sites.
Moreover it is quite obvious to expect that such buildings are affected by structural deformations which require an expert to be detected on the spot and a very time-consuming acquisition of data in case the survey is conducted with traditional instruments as total station or terrestrial photogrammetry. The point cloud collected by a TLS can be used to detect semi-automatically these deformations and to measure their entities. Beside acquisition speed and convenience, the test survey of Cascina Linterno aims to take advantage of TLS technology not to produce the traditional set of layouts, but to provide a full set of data, suiting the necessities of all the specialists involved. In the process started at Cascina Linterno all the specialists involved must make an effort to access, understand and use the point cloud, which is for them a new and not familiar kind of data. On the other side, following their necessities, the survey team is engaged in studying and providing handy procedure or new tools to enable them to work autonomously on the point cloud.
2. AIMS OF THE TEST
The final layouts coming out from processing TLS acquisitions
are generally “lossy”: the 3D information and the richness of
detail is usually reduced and normalized in 2D plans, sections and elevations, while 3d model are used mainly for communication purposes and general outlines but not for metrical purposes. The right texture of masonry, walls thickness, the actual uprightness of the vertical structures, as well as the deformations of the floors are often reduced to approximated information, and only if noticed. In the case of wooden structures the situation is even more complex, because of the irregularity of their sections, which makes it hard to select the correct measures in structural computation.
The usual normalization of data, adopted to make structural computation schemes, is conceived to maintain wide buffer/margin in dimensioning interventions, in order to avoid errors due to low accuracy in measure-taking.
The challenge of the survey in Cascina Linterno is to test the potentialities of TLS survey output as instant final layout, that makes available in a relatively short time all the metrical information needed by the different teams of the experts involved, and that can be detected and selected by the expert itself, during a sort of virtual on-the-spot investigation. The traditional approach consisting on providing the result of a normalization of the building, and in the case of Cultural Heritage this approach may even invalidate the utility of the survey itself. Moreover the result of traditional representation is actually a selection of information operated by the surveyor on the field first, and by the draftsman on the workstation.
In the case of Cascina Linterno, the survey has, among its tasks, to detect critical situations in static general balance of the structures. The structural engineers and the preservation experst
have to collect the data needed to design “necessary and sufficient” interventions, in order to provide a cost-effective solution and to allow the use of the building in a short time in full safety. It is necessary then to use such a powerful instrument as TLS taking advantage of all its output, also if this means to avoid traditional and appealing layout.
On the other side this test aimed to overcome another traditional aspect of wide working teams of specialists, where the workflow is divided in closed segments, each one involving one
single group of experts. It is important to underline that it is much easier for a structure engineer or for a preservation expert to work on traditional layouts, and for a topographer it is easier to put an end to its work by delivering traditional layouts. This way of working, however, does not stimulate new solutions on the border area between different branches of knowledge frequently, involved in the same activities.
In this test activity the structure engineer and the preservation experts were involved directly in the details of the survey and in the exploration of the general point cloud, and the previous survey layouts, easier to print and to read, were validated using the TLS results.
3. SURVEY ACTIVITY: ACQUISITION AND DATA PROCESSING
The survey at Cascina Linterno was carried out in 4 days (16-18th July and 11th October 2012), together with a traditional survey with total station. Two inspections had been previously made to point out the obstructing objects and wild vegetation to be removed in order to facilitate the survey. Only the vegetation was actually removed, and it is likely to forecast that this would be a very common condition in analogous situations.
The instruments used are TLS FARO Focus CAM2 3D and total station TOPCON GTS-3B.
The 170 point clouds acquired were aligned and registered with the software Leica Cyclone 7.3 using targets and natural points. Resolution and Quality for each scanning section has been recorded and evaluations were made about size of the scan data, level of detail and the effectiveness of the chosen setting. In order to control the accuracy, the correctness of the vertical direction, and the general result, a set of control points were measured with the total station with the support of a topographic traverse. As a test activity, the use of control points was necessary as independent set of measures to evaluate the accuracy of the acquisition, in order to consider: the use of the laserscanner as only instrument on the Cultural Heritage site, natural points as the only marks used to carry out the alignment between point clouds, and the choice of a key scanning session to generate a local reference system.
Once the general Modelspace including all the scans had been generated, the general point cloud has been analytically georeferenced on the topographical survey, using the coordinates of 11 well distributed targets collimated with the total station and clearly detectable in the point cloud. To carry out this calculation the barycenters of the two reference systems have been worked out and the rototraslation parameters have been applied to the local reference system of the global point cloud.
N. Punto
Coordinate poligonale Coordinate laser scanner
Scarto
Est Nord X Y X Y
(t)7 508570,992 5034527,466 -35,692 -11,307 0,008 0,008
(t)51 508581,847 5034506,127 -41,533 11,882 0,023 -0,017
(n401 )
508583,477 5034500,990 -42,008 17,258 -0,001 -0,011
(t)12 508567,268 5034530,300 -32,695 -14,896 0,002 0,008
(t)54 508576,567 5034501,963 -35,469 14,766 0,015 -0,023
n9 508565,135 5034530,006 -30,548 -15,088 0,004 0,002
n5 508532,451 5034524,421 2,552 -16,882 -0,005 0,007
n8 508558,941 5034524,093 -23,217 -10,695 -0,016 0,002
t30 508532,427 5034498,542 8,310 8,347 -0,006 0,005
t29 508528,389 5034512,471 9,161 -6,133 -0,006 0,003
(t)27 508530,206 5034493,423 11,599 12,855 -0,018 0,014
Table 1–Rototraslation between the two coordinates systems: outputs
The thickness of walls and floors, as well as uprightness of vertical structures etc. are then metrically reliable, as processed as a result of alignment of scans of contiguous spaces included in the general registration.
N. Punto
Coordinate poligonale Quota laser
Scarto
Est Nord Quota Z Diff. Q Residuo
(t)7 508570,992 5034527,466 105,880
4,651 101,229 -0,019
(t)51 508581,847 5034506,127 104,982
3,758 101,224 -0,025
(n401) 508583,477 5034500,990 102,383
1,155 101,228 -0,021
(t)12 508567,268 5034530,300 105,347
4,113 101,234 -0,015
(t)54 508576,567 5034501,963 105,165
3,930 101,235 -0,014
n9 508565,135 5034530,006 102,720
1,471 101,249 0,000
n5 508532,451 5034524,421 101,910
0,650 101,260 0,011
n8 508558,941 5034524,093 100,679
-0,583 101,262 0,014
t30 508532,427 5034498,542 101,213
-0,054 101,267 0,019
t29 508528,389 5034512,471 102,218
0,949 101,269 0,021 (t)27 508530,206 5034493,423 101,652
0,376 101,276 0,027
Table 2. Height trasformation between the two coordinates systems: outputs
4. DATA PROCESSING BY OTHER SPECIALISTS INVOLVED
From the point of view of Cultural Heritage Preservation experts, in the field of building survey there is still an open debate on the suitability and convenience of the laser scanner instrument for geometric survey, and there is general agreement on laser scanner not being a general substitute for more traditional architectural survey methods.
Laser scanner, as opposed to more traditional survey methodologies including direct or topographic survey,
represents the highest level of completeness, accuracy and speed of acquisition, however its accuracy and suitability depend both on the instrument's relative position from the scanned object and the size range of the needed measures *. The fact that it does not operate a selection is not always considered convenient, as it compels the specialist to process one more step. The main variables that need to be considered in order to choose the right survey technique are the geometric complexity of the object, the number of single measurements to acquire, the required accuracy. In the case of Cascina Linterno, however, further operational necessities were taken into consideration.
The first problem that had to be addressed is what output to provide to the end user of the survey (in this case the structural design studio), which is most likely not equipped with a workstation running the point-cloud viewing and editing software. A more traditional CAD output is usually expected, both because it is a more standard working tool and because it is easier to interpret. This implies that an intermediate step involving data selection, interpretation and partial vectorial redrawing of the point cloud slices is necessary.
The second problem is that partial point cloud slices exported are not easy to read. They can include shadowed areas that are easily visually interpolated only by an operator familiar enough with the scanned objects and places; on the other hand, a number of points including a whole structural unity is too heavy to be manipulated into CAD software running on an average workstation. This makes it necessary to previously turn the point cloud into a simplified mesh or to redraw it, both activities are time consuming operations that cannot be automatically made.
The proposed solution was to extract and catalogue information from the complete point cloud model, on a reference base constituted by a previous basic survey of the building, including plans and structural elements, to place and classify the specific slices that were required to measure structural geometries. The preliminary structural assessment had the necessity to identify the minimum section for each wooden beam, the minimum section and widest span between joists in the floor of each room, and identify the maximum deflection of each floor in order to assess the feasibility of a reinforcement intervention at the intrados level. The crossing section and the height of each wall was necessary as well, along with sections across slanted walls where issues connected with eccentric load may arise. It was finally requested to obtain measures for all visible wooden roof trusses.
The studio was provided with general crossing sections including all the bearing walls, as model slices ranging from 1 to 5 mm thickness in vector dxf files of sizes ranging from 30 to 100 MB, still viewable in CAD environment and then saved as dwg files with a considerable reduction of file size. For each room the critical structural elements could be identified in the model in orthographic view using the Elevation Map visualization, so that the needed slices could include the most critical situation and all required elements. Alongside raster pictures including a bigger number of point files were exported to be used as a visual reference when navigating the files.
*
The measurement error that may affect the correct extrapolation of geometric data from these partial point cloud sections was estimated around ±5 mm, with typical sections of the joists around 8 x 10 cm. This is considered acceptable, given that: the measured objects represented the most negative condition to be found in each structural unit and that still large margins are offered by the safety coefficients applied*.
In the analyzed case, the TLS dataset made it possible to access geometric information without waiting for a complete architectural redrawing and being sure that no details were omitted during acquisition or redrawing; on the other hand, it has later made the architectural survey easier by reducing on site work and allowing to perform surveys directly on the model, as well as obtaining anytime reference points for photographic rectification.
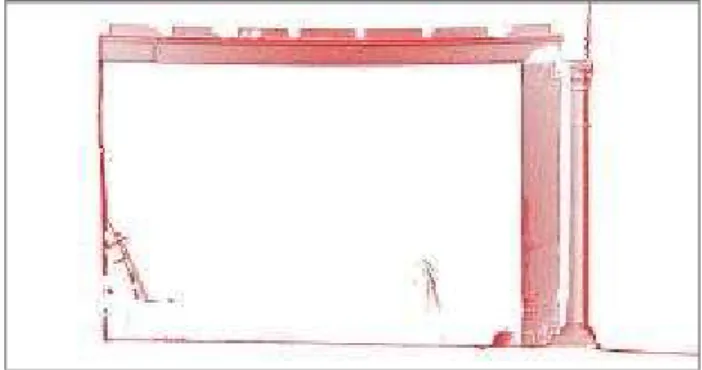
Figure 1. 2 mm slices representing a wooden beam edge, joists sections and column. The slice includes about 8000 points and can be surveyed into CAD environment.
Figure 2. 50 cm slices representing a wooden beam edge, joists sections and column. The 50 cm slice is as a raster used as a reference image.
*
According to Italian laws on the improvement of seismic response of historic structures, safety coefficients need to be applied according to the level of knowledge of the material quality – visual survey, limited instrumental analysis, extensive tests. See also: Moro 2007 (edited by),Linee guida per la valutazione e riduzione del rischio sismico del patrimonio culturale, Gangemi, Roma
Figure 3. The high number of points needed to represent the whole geometry of a floor is too large to be used in CAD environment. A high definition raster ortho-image has been superimposed on a 1 mm point cloud silhouette in CAD, for easier measuring and tracing.
Figure 4. Point cloud as a reference for the perspective rectification needed for further architectural documentation.
5. NEXT STEPS
The future engagement is meant to provide a performing web application with handy and effective tools to work on the point cloud.
The access through the web to data is necessary, first because the dataset has a huge size, and it is not reasonable to occupy the same amount of memory on more than one disk, while very performing application are now available. Second a web application may have virtually no limits in the number of users, which is very important as the different working teams are composed by several experts.
For each working team a set of tools studied during the test survey at Cascina Linterno, should be provided to enable any expert without specific skills to obtain on request the data needed.
Figure 5. Example of a horizontal section.
Figure 6. Cloud point and CAD planimetry overlapping for accuracy evaluation. Blueprints extracted from Ilaria Gelmo e
Francesco Toso’s thesis were useful as a preparatory sketch
during the survey and they were used for comparison with the new lidar survey.
Vertical sections allow to investigate construction elements and to extract information and data regarding structural element inside a unitary 3D model obtained through the unification of all scans.
Figure 7.
Figure 8.
In particular, image 7 and 8 allow the study of main and secondary load-bearing structures composing the woody roofing, together with collaborating structural elements, as chains, highlighting the presence of eventual critical areas. Moreover, it is possible to get information related to the internal height of the building in comparison to the slope of the street.
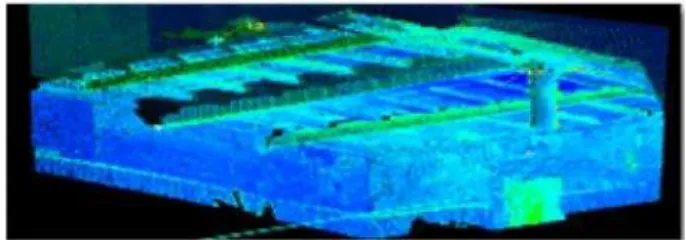
Figure 9. Image 9 allow to analyse the composition of the ceilings of each floor and the existing deformations.
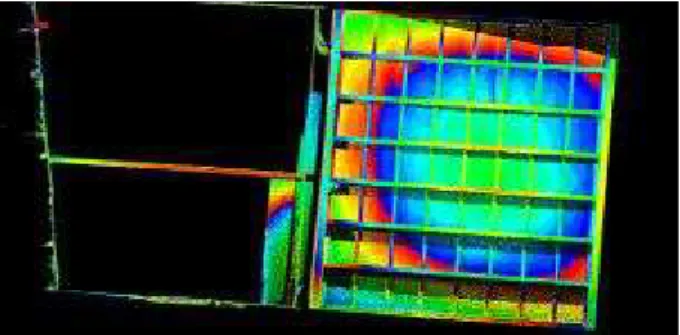
Figure 11
.
Elevation Map highlighting ceiling deformations and areas of maximum deflection.Figures 12,13,14. 3D survey of buildings allow not only the realization of planimetry but also the creation of a model showing dimensions and position of architectural elements, materials, decays and damages, as shown in fig. 13. Laser scanner survey is useful for obtaining different kind of information and for reading signs of history, meeting the needs of the different disciplinary fields dealing with the preservation of the historical heritage.
REFERENCES
Letellier 2007 (edited by), Recording, Documentation and Information Management for the Conservation of Heritage Places, The Getty Conservation Intitute, Los Angeles
Vassena G., Sgrenzaroli M., Tecniche di rilevamento tridimensionale tramite laser scanner. vol. 1, Starrylink, Brescia, 2007.
Genovese R.A. (a cura di), Il cantiere della conoscenza –
metodologie e strumenti per la conservazione e il restauro, Arte Tipografica Editrice, Napoli, 2008.
Gelmo I., Toso F.,Cascina Linterno: analisi e progetto per la
conservazione di un sistema di paesaggio agrario storico in ambito periurbano,Tesi di Laurea Politecnico di Milano, 2010.
Garnero G. et. al.,The employment of terrestrial laser scanner in cultural heritage conservation: The case study of Vallinotto Chapel in Carignano-Italy, 2010 Applied Geomatics, 2 (2), pp. 59-63. ISSN: 18669298 DOI: 10.1007/s12518-010-0018-9.
Tucci G., Nobile A., Riemma M., Laser scanner surveys and the study of the geometry and structure of the dome in the Basilica
della Madonna dell’Umiltà in Pistoia. In: Tampone G., Corazzi R., Mandelli E. (eds.), Proceedings of the International