REPRESENTATION OF ODOMETRY ERRORS ON OCCUPANCY
GRIDS
Anderson A. S. Souza, Andre M. Santana, Ricardo S. Britto, Luiz M. G. Gonalves, Aderlardo A. D. Medeiros
Depatment of Computating Engineering and Automation, UFRN, Natal, Brazil{abner, andremacedo, rbritto, lmarcos, adelardo}@dca.ufrn.br
Keywords: Mapping, Occupancy grid, Odometry.
Abstract: In this work we propose an enhanced model for mapping from sonar sensors and odometry that allows a robot to represent an environment map in a more suitable way to both the sonar sensory data and odometry system of the robot. We use a stochastic modelling of the errors that brings up reliable information. As a contribution, we obtain a final map that is more coherent with the reality of the original data provided by the robotic system. Practical experiments show the results obtained with the proposed modification to be trustable in such a way that this map can be used to provide previous knowledge to the mobile robot in order to perform its tasks in an easier and accurate way. Moreover, the map can help the robot to support unexpected situations inside of the environment
1
INTRODUCTION
In order for a robotic system to be efficient in the ac-complishment of tasks, an important requirement is a correct spatial description of its underlying space that can be constructed from its own sensorial data. This description, a trustable map, makes possible a coher-ent interaction of the robot with its environmcoher-ent, so that it can perform its tasks efficiently and also can deal with unexpected situations like dynamical obsta-cles appropriately. The process of construction of this representation is generally named as mapping and the result is a map of environment.
Two main approaches are used to represent an en-vironment in a map: the topological and the metric. In the topological approach, the environment map is rep-resented by using graphs, in which the nodes are free spaces and the edges have information about connec-tion among the nodes, for example, distance. Topo-logical mapping makes easier the accomplishment of high level tasks, as navigation, with smaller computa-tional cost.
In the metric approach, the geometry of the envi-ronment is defined in a more detailed way, presenting, accurately, the position of the objects inside of the en-vironment, for instance walls, chairs and desks.
A common method used in the construction of metric maps is the occupancy grid. In this method, the environment is represented by a matrix in which each element represents a place in the environment that can be empty or occupied, or can be a unknown area.
In this work, we propose a mapping methodology with representation using an occupancy grid with a modification proposed in the model of the sonar sen-sor that embodies the uncertainty of the odometry sys-tem.
2
RELATED WORKS
Moravec (Moravec, 1988) proposes a system, in wich the occupancy grid map is based on sonar data and stereo data. Information from a sonar sensor array and from a stereo vision system is combined to build the metric map of environment.
In a subsequent work, Moravec (Moravec, 1996) introduces the idea of a map represented in a three dimensional occupancy grid. During the mapping, a sequence of stereo images is processed and the result of the mapping stored in a three dimensional array named evidence grid. The cells are initializes with zero value, indicating that there is no occupation ev-idence. After several sensor readings, the cells are filled out so that blocks of negative cells indicate free space, while positive blocks indicate obstacle. In his work, Moravec has used the theory of evidence of Dempster-Shafer. We use here the Bayesian approach also used by Elfes (Elfes, 1987).
Konolige (Konolige, 1997) has presented a method to treat the problems relative to the sonars in a more efficient way. Example of problems are the specular reflection and redundancy of reading. The proposed method is a mathematical refinement of the method introduced by Elfes (Elfes, 1987). The method is named as MURIEL (MUltiple Representa-tion Independent Evidence Log).
In the Elfes’ works, mapping is performed without considering dependence among the cell and its neigh-bours. This implicates in inconsistent maps when the mapping is performed in cluttered environments. In a more recent work, Thrun (Thrun, 2003) has in-troduced an advanced sensor model to deal with the problem of dependence among cells presented by the standard algorithm of Elfes (Elfes, 1987). The model introduced by Thrun (Thrun, 2003) verifies the val-ues of occupation of the neighboring cells and then attributes the value of occupation to the current cell. Thrun has based his work on the Bayesian theory.
Thrun et. al. (Thrun et al., 2005) affirm that the main usefulness of the mapping with occupancy grid is in the post-processing, that is, in the map con-structed. The map can be useful in several appli-cations like, navigation, path planning, recognition of landmarks, obstacle avoidance and localization. Borenstein and Koren (Borenstein and Koren, 1991) for example, have implemented a method of obsta-cle avoidance in real time named VFF (Virtual Force Field). This method uses an occupancy grid map, ob-tained from sonar data, to define the localization of the obstacles inside of the environment.
In the Dutra’s work (Dutra et al., 2003), a robot provided with an array of 24 sonars builds an occu-pancy grid map of its surroundings and store it in its internal memory. Later, this map is used for
naviga-tion, but the results obtained by this work in both nav-igation and mapping were quite influenced by accu-mulated errors of the odometry system. In our work, we model the sonars taking into account the intrinsic errors also to the odometry system.
Other works in the literature exemplify the use of occupancy grid maps. Kong et. al. (Kong et al., 2006) has implemented a localization system based on EKF (Extended Kalman Filter) in which features inside the environment, as corners and flat surfaces, are detected. The information obtained about the fea-tures is integrated with an occupancy grid map known a priori to yield an accurate localization of the robot in the environment.
3
THE STANDARD ALGORITHM
OF OCCUPANCY GRID
MAPPING
The standard algorithm formalized by Elfes (Elfes, 1989), builds the map from both the sensorial data and the robot position (localization and orientation). The mathematical formulation of the occupancy grid map-ping is derived from Equation (1), which gives the value of occupation of the whole map (Elfes, 1987; Thrun et al., 2005; Thrun, 2003).
p(m|z1:t) (1)
In this equation m represents the obtained map, z1:t represents the set of measurements until the instant t. The continuos space of the environment is converted in a discrete space of cells, which form together an approximation of the environment. Thus, the map is defined as a finite set of cells mx,y. Each cell posses a
value, among 0 and 1, associated which corresponds to the state of the cell, occupied and empty, or can represent an unknown state. The value 0 means empty cell and 1 occupied cell. The notation p(mx,y)refers
the probability of a cell of index<x,y>to be occu-pied.
The standard algorithm divides the problem of construction of the map in a set of smaller problems of estimate of the values of each cell mx,yseparately.
p(mx,y|z1:t) (2)
Due to reasons of numerical instabilities for probabili-ties near 0 or 1, it is common to calculate the log-odds of p(mx,y|z1:t)instead of p(mx,y|z1:t). The log-odds is define for:
ltx,y=log p(mx,y|z1:t)
1−p(mx,y|z1:t)
The probabilities are easily recovered from the log-odds ratio:
p(mx,y|z1:t) =1− 1
1+elxt,y (4)
The value of the log-odds can be estimated recur-sively in any instant t by the rule of Bayes applied on p(mx,y|z1:t):
p(mx,y|z1:t) =
p(zt|z1:t−1,mx,y)p(mx,y|z1:t−1) p(zt|z1:t−1)
(5)
Supposing that we are mapping static environment, we can affirm that the current measurements of the sensors ones are independent of the last ones:
p(zt|z1:t−1,m) =p(zt|m) (6)
Because the map is decomposed in cells, this suppo-sition is also extended all. We assume, then, the inde-pendence of each cell. Without take into account the occupation of the neighboring cells, we have:
p(zt|z1:t−1,mx,y) =p(zt|mx,y) (7)
This allows us to simplify the Equation (5).
p(mx,y|z1:t) =
p(zt|mx,y)p(mx,y|z1:t−1) p(zt|z1:t−1)
(8)
Applying the Total Probability Theorem to p(zt|mx,y)
we obtain:
p(mx,y|z1:t) =
p(zt|mx,y)p(mx,y|z1:t−1)
∑mx,yp(zt|mx,y)p(mx,y|z1:t−1)
(9)
The Equation (9) provides the probability of a cell
mx,yto be occupied.
4
THE PROPOSED MODEL OF
THE SONAR
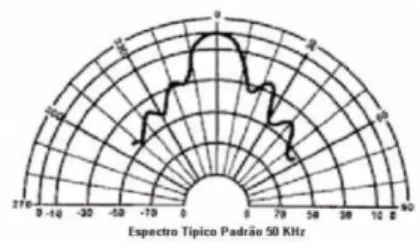
In our work, we consider that noise is intrinsic to both data sources, sonar sensor and odometry system, in the construction of the map. The sonar sensors have internal and external features which arouse errors in their measurements. Usually, these errors are pub-lished by the manufacturers and made available to the public. In Figure 1, for example, we can verify some typical features of a sonar Polaroid series 6500, that are used in our work. This sonar presents higher sen-sibility in the area near to its main axis. Besides, it presents an error of absolute measurement of +/- 1%. Besides the typical errors of the sonar, we attempt to the errors accumulated by the odometry during the motion performed by the robot. The odometry cal-culates the robot’s current pose in relation to the pre-vious pose. With this, errors accumulate in an incre-mental way.
Figure 1: Features of the Polaroid sensor.
If we neglect these two sources of error, the final map will not be kept in accordance with the data orig-inated from the robot, committing others applications like, navigation, path planning and others.
To deal whit those errors, we looked for a way of include them in the occupancy grid map representa-tion. Thus, we modified the sonar sensor model of the standard algorithm, so that, in a probabilistic way, the typical errors of the sonars and odometry are incorpo-rated to the value of occupation of the cell in the grid (Equation 10).
p(zt|mx,y) =
1 2πσztσθt
×e
"
−1 2
(Dx,y−zt)2
σ2
zt +
(θx,y−θ)2
σ2 θt
!#
(10)
Where:
ztrepresents the sensor reading in the instant t;
θtrepresents the orientation of the sensor;
σzt represents the standard deviation regarding the
er-ror in the measured distance by the sensor;
σθt represents the standard deviation regarding the
er-ror in the orientation of the sensor;
Dx,y represents the Euclidean distance between the
sensor and the cell mx,y;
θx,yrepresents the angle of orientation of the cell mx,y.
The standard deviation regarding the error in the measured distance depends the value of the odometry error of a translational movement, that is,
σzt =zt×k+f (11)
Where:
k is the factor of errors intrinsic of the sonar (in our
case, +/- 1%);
f is a function which describes the odometric
system-atic error, when the robot moves linearly.
The standard deviation regarding the error in the orientation angle of the sensor depends on the value of the odometry error of a rotational movement, that is,
σθt =
β
2+g; (12)
Where:
g is a function which describes the odometric
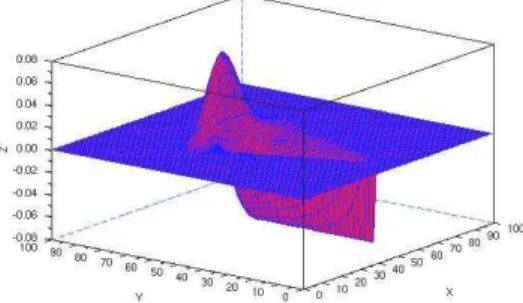
system-atic error, when the robot moves in a rotational way. Function f in Equation 11 and function g in Equa-tion 12 were experimentally deduced from several data samples. Figure 2 shows a graph of the sensor model deduced.
Figure 2: Graphics of the proposed model.
With this modification, the value of the probabil-ity of occupation of a cell passes to be weighed by the uncertainties in the real robot position, due to the odometry errors. Thus, the map is corrupted gradu-ally, representing the real error.
5
EXPERIMENTS
To validate de proposed model, we have made some experiments with the mobile robot named Galatia, model Pioneer 3-AT of the ActivMedia Robotics, pro-vided with two array sonar sensor (front and back) and odometry system (Figure 3).
Figure 3: The robot Pioneer 3-AT.
The experiments are performed inside of the De-partment of Computing Engineering and Automation - UFRN, trying to map the corridors. The first experi-ment is performed using the standard algorithm of oc-cupancy grid mapping without relying on the odome-try errors. The result of this experiment can be seen in Figure 4.
Later, we perform the same experiment again using the probabilistic sonar model proposed here, to represent the systematic errors of the sonars and odometry (Figure 5).
Figure 4: Map without representation of the errors.
Figure 5: Corrupted map.
In the maps, the white cells represents free areas or no obstacles, the black cells represents occupied areas or obstacles and the grey cells represents the unknown areas. The sketched lines show the real contour of the corridors.
6
CONCLUSIONS
In this work, we propose a modification in the sensor model used in the standard algorithms based on oc-cupancy grid mapping, including in the probabilistic model the intrinsic uncertainties of the robotic sys-tem. In order to consider these uncertainties in the mapping, we have found a way to include them in the representation of the map of the environment. Thus, we basically modify the sensor model so that, in a probabilistic way, the typical errors from sonars and odometry can be incorporated in the occupancy value of a cell. The model was tested in practice with the robot Pioneer 3-AT and demonstrated to be correct, giving the right expectation for the error
Based on the presented results, we can see that the proposed model supplies a more realistic way to rep-resent a mapped environment using occupancy grid, being known that the originated information from the robot have errors, and what are really these errors. That is, the errors corrupt the quality of the map, showing in this way coherence whit the sensorial data. As extension of this work, we will improve the treatment of the incoherent readings from the sonars, like speculate reflections and so. Furthermore, a way for relocation of the robot, when the errors grow a lot, will be studied and implemented.
ACKNOWLEDGEMENTS
REFERENCES
Borenstein, J. and Koren, Y. (1991). The vector field his-togram - fast obstacle avoidance for mobile robots.
IEEE Journal of Robotics and Automation, 7(3):278–
288.
Dutra, P. R. C., de Souza, M. M., Andriolli, G. F., lvares, A. J., and Ferreira, J. C. E. (2003). Navmap: Um sistema para navegao por mapeamento do rob mvel nomad xr4000. In VI Simpsio Brasilieiro de Automao
Inteligente (SBAI), Bauru, SP.
Elfes, A. (1987). Sonar-based real-world mapping and nav-igation. IEEE Journal of Robotics and Automation, 3(3):249–265.
Elfes, A. (1989). Occupancy Grid: A Probabilistic
Frame-work for Robot Perception and Navigation. PhD
the-sis, Carnegie Mellon University, Pittsburg, Pennsylva-nia.
Kong, F., Chen, Y., Xie, J., Zhang, G., and Zhou, Z. (2006). Mobile robot localization based on extended kalman filter. In 6th World Congress on Inteligent Control and
Automation, Dalian, China.
Konolige, K. (1997). Improved occupancy grids for map building. Autonomous Robots, (4):351–367.
Moore, R. and Lopes, J. (1999). Paper templates. In
TEM-PLATE’06, 1st International Conference on Template Production. INSTICC Press.
Moravec, H. P. (1988). Sensor fusion in certainty grids for mobile robots. AI Magazine, 9(2):61–74.
Moravec, H. P. (1996). Robot spatial perception by stereo-scopic vision and 3d evidence grid. Technical Re-port CMU-RI-TR-96-34, CMU Robotis Intitute, Pitts-burgh, Pennsylvania.
Smith, J. (1998). The Book. The publishing company, Lon-don, 2nd edition.
Thrun, S. (2003). Learning occupancy grid maps with for-ward sensor models. Autonomous Robots, (15):111– 127.
Thrun, S., Burgard, W., and Fox, D. (2005). Probabilistic