The Dutch Census 2011
1
Eric Schulte Nordholt2 | Statistics Netherlands, The Hague, Netherlands
1 h is article is based on Schulte Nordholt (2014a and 2014b).
2 Statistics Netherlands, P. O. Box 24500, 2490 HA h e Hague, h e Netherlands. E-mail: [email protected], phone:
(+31)703374931.
Abstract
h e Dutch 2011 Census tables were produced by combining existing register and sample survey data. Since the last census based on a complete enumeration was held in 1971, the willingness of the population to par-ticipate has fallen sharply. Statistics Netherlands no longer uses census questionnaires and has found an alter-native in the register-based census, using only existing data. h e register-based census is cheaper and more socially acceptable. h e table results of the Netherlands are not only comparable with earlier Dutch censuses, but also with those of the other countries in the 2011 European Census Round.
Keywords
Census, methodology, registers, Statistics Netherlands
JEL code
C18
INTRODUCTION
The 2011 European Census Round was coordinated by Eurostat for all European Union (EU) and European Free Trade Association (EFTA) member states. The EU population and housing censuses have a broad basis: they are covered by four Regulations (European Commission, 2008, 2009, 2010a and 2010b), which have served to harmonise population definitions, cen-sus variables and categories, cencen-sus hypercubes (high-dimensional tables) and metadata within the EU. Moreover, they specify the technical format (SDMX) for data delivery. All EU member states were required to conduct a census for 2011. For most national statistical institutes this was a major operation involving a lot of work and high costs. Each country had to collect census data and vali-date and protect its census output in the hypercubes. All data had to be transformed to SDMX format and put in the so-called Census Hub. Lastly, in addition to sixty mandatory hypercubes, all coun-tries had to produce a number of quality hypercubes and a metadata i le describing the methodology used.
Census experts at Statistics Netherlands started preparations for the 2011 Population and Housing Census in 2008. In 2009 they started work on the data collection procedures required to collect the census information about the 16 655 799 people living in the Netherlands on 1 Janu-ary 2011.
1 THE DUTCH POPULATION AND HOUSING CENSUS 2011 1.1 A register-based census
Data from dif erent sources were combined to produce the 2011 Census tables. h ese data were not ob-tained by interviewing inhabitants in a complete enumeration, as in traditional censuses in most other countries, but by using data from registers and sample surveys that are already available at Statistics Netherlands. h is approach has a number of advantages and disadvantages.
One of the advantages of this innovative approach is a much lower census bill for Dutch tax payers. A traditional census in the Netherlands would cost a few hundred million euros, while with this method it costs ‘only’ around 1.4 million euros. h is bill includes the costs for all preparatory work, such as ex-tending the methodology and updating and developing accompanying sot ware, as well as the analyses of the results. It does not include the costs of the registers, as these are not kept for censuses but primar-ily for other purposes. Also, under Dutch law, Statistics Netherlands may access government registers free of charge. h is low-cost census approach is only possible for countries with sui cient register in-formation. By way of example, let us compare the costs of the Dutch register-based census with those of the traditional census held in the United Kingdom in 2011. In the United Kingdom the census cost ap-proximately 565 million euros. In terms of PPP per capita (in 2011 US dollars), the census cost 11.82 in the UK, compared with 0.10 in the Netherlands (United Nations, 2014). A register-based census costing less than 1 percent of a traditional census is not exceptional. Today, the huge costs of traditional censuses are ot en justii ed by pointing out the enormous implications of the census results for regional funding distribution. But a register-based census would be impossible in the UK anyway, because of the lack of sui cient register data and access restrictions.
Apart from the i nancial aspect, there are also other important dif erences between a traditional cen-sus and the register-based cencen-sus conducted in the Netherlands. A well-known problem with traditional censuses is that participation is limited and selective. In spite of the mandatory character of a traditional census, part of the population will not participate at all (unit non-response) and those who do will not answer all questions (item non-response). Although correcting for non-response by weighting and impu-tation techniques is worth trying, traditional correction methods are inadequate to obtain reliable results. h e last traditional census in the Netherlands, in 1971, met with many privacy objections against the col-lection of integral information about the population living in the Netherlands. h is increased the non-response problem, and non-the non-response was expected to be even higher if another traditional census were to be held in the Netherlands (Corbey, 1994). h ere are almost no objections to a register-based census in the Netherlands and the non-response problem only plays a role when survey microdata are reused.
Another advantage of the register-based census is the short production time. h e register-based cen-sus in the Netherlands got of to a later start than traditional cencen-suses in other countries. It would have been pointless to start the production phase of the 2011 census project before all sources were avail-able, and some registers became available relatively late. In spite of this delay, Statistics Netherlands compiled its census tables faster than most other countries in the 2011 European Census Round. In fact, the Netherlands had one of the shortest production times for the complete set of tables required by Eurostat. Statistics Netherlands had the advantage that no incoming census forms had to be checked and corrected.
A disadvantage of the Dutch census is that for some variables only sample information is available, which meant it was impossible to meet the level of detail required in some census hypercubes. At the mo-ment, however, the Netherlands perceives the advantages of the register-based census in terms of cost and non-response problems to amply outweigh the loss of some detail compared with a traditional census.
the Nether-lands: not all variables relevant for the census can be found in registers. h ey are therefore very interested in the Dutch approach of combining registers and existing sample surveys and using modern statistical techniques and accompanying sot ware to compile the hypercubes. Obviously, it is essential that statistical bureaus are permitted to make use of registers that are relevant for the census. For Statistics Netherlands this is laid down in the statistical law that came into force in 2004. Nevertheless, Statistics Netherlands will have to maintain the good contact it has established with register holders over the last 25 years. Timely deliveries with relevant variables for Statistics Netherlands are crucial for oi cial statistics production.
Figure 1 The Kingdom of the Netherlands in Europe
Source: Statistics Netherlands
1.2 The Netherlands
h e Kingdom of the Netherlands includes the Netherlands in Europe (see Figure 1) and six islands in the Caribbean. h e Kingdom consists of four constituent countries: the Netherlands (consisting of twelve
prov-Provincial capital
Other important
inces), Aruba, Curaçao and St Maarten. h e latter three islands have an independent status as a country within the Kingdom of the Netherlands. h e other three Caribbean islands (Bonaire, Saba and St Eusta-tius) are part of the Netherlands and have had the status of ‘special municipality’ since 10 October 2010. All four countries produce their own oi cial statistics. Statistics Netherlands has a regional oi ce in the Caribbean responsible for statistics on Bonaire, Saba and St Eustatius (the Caribbean Netherlands). Al-though the Caribbean Netherlands is part of the Netherlands, statistics on the Netherlands do not include the Caribbean Netherlands. All statistics concerning the Caribbean Netherlands are published separate-ly. h e results of the Dutch 2011 Census therefore relate only to the European part of the Netherlands.
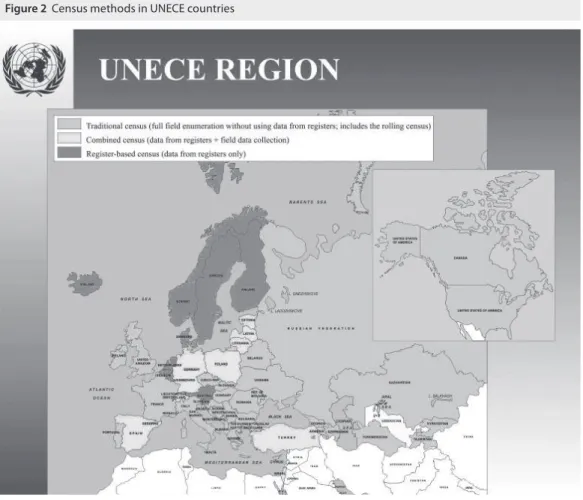
Figure 2 Census methods in UNECE countries
Source: UNECE Task Force on Census Methodology (2013)
2 CENSUS METHODS IN THE UNECE REGION 2.1 Census practices in the 2010 Census Round
the results of i t y countries on important methodological issues were analysed (UNECE Task Force on Census Methodology, 2013).
Most countries participating in the online survey had conducted a census in the 2010 Round. Four – Bosnia-Herzegovina, Georgia, Republic of Moldova and Ukraine – had not yet done so, but were still planning to conduct a traditional census during this round. h e traditional census in the Former Yu-goslav Republic of Macedonia was cancelled in 2011, and there are as yet no i rm plans to take another one. h is country has therefore been excluded from the following analyses.
As expected the countries used dif erent methods, and some countries reported a dif erent method for the population than for the housing census, ot en connected with the availability of registers for these domains. Using registers to produce oi cial statistics reduces costs and bypasses the problem of declining survey response rates. h ree main types of census method can be distinguished: the traditional census, the combined census, and the register-based census.
2.2 Traditional censuses
h e traditional census approach collects basic characteristics from all individuals and housing units (full enumeration) for a specii c point in time. More detailed characteristics can be collected either from the whole population or on a sample basis. Collection modes include personal interviews, self-completed paper questionnaires, and data collection by telephone and the internet. Across the world, this is still the most common approach to census-taking. Most UNECE countries with a traditional cen-sus use personal face-to-face interviews with paper questionnaires as their main approach. However, in the Czech Republic, France, Ireland, Italy, Luxembourg, Slovakia, the United Kingdom and the United States, the main method is self-completion of paper questionnaires by respondents. In Canada most re-spondents participate online (CAWI), while in Portugal self-completed paper questionnaires and online response were equally popular.
Just as in the census round of 2000, full i eld enumeration without register information (traditional census) is still the most popular method in the UNECE region in this census round. Almost two-thirds of countries collected data using ‘traditional’ methods. But although it is still the most common gen-eral approach in the region, it is less so than in the 2000 round, when four-i t hs of countries used this approach. A substantial minority (33 percent) of the full i eld enumeration countries used information from registers only as a frame or control. h e United States was alone in using traditional enumeration with yearly updates of characteristics on a sample basis. Another alternative approach to the traditional model was used by France: the rolling census. h is is a cumulative continuous survey covering the whole country over a period of time rather than on one particular day.
2.3 Combined censuses
Four countries (Estonia, Latvia, Liechtenstein and Lithuania) used a combination of register data with complete i eld data collection for selected population census variables, and six countries (Germany, Israel, Poland, Spain, Switzerland and Turkey) used a combination of register data with ad-hoc sample data collection for selected population census variables.
2.4 Register-based censuses
2.5 Overview
h e map of the UNECE area reveals interesting east-west and north-south tendencies in census meth-ods (see Figure 2). h ree main categories are distinguished on the map: traditional (31 countries), com-bined (10 countries) and register-based (9 countries). Register-based censuses are becoming increasingly popular in northern Europe, combined censuses are more ot en found in central Europe. Traditional censuses continue to be more popular in English-speaking and Commonwealth of Independent States (CIS) countries. All UNECE countries outside Europe conduct traditional censuses. Only Uzbekistan did not conduct a census in this round, and had no plans to do so.
3 COMPILATION METHODS IN THE NETHERLANDS
h e current census results in the Netherlands refer to 2011. h e backbone of the Dutch census is the central population register (PR), which combines all the municipal population registers. PR data for 1 January 2011 were used as the basis for the set of hypercubes. h e hypercubes focus on frequency counts, not on quantitative information. Data not available or derivable from the PR were taken from other registers. All register variables are now available from Statistics Netherlands’ system of social statistical datasets (SSD), and their quality has been improved by applying micro-integration techniques. More information about the SSD can be found in Bakker, Van Rooijen and Van Toor (2014). Micro-integration entails checking the data and adjusting those that are incorrect. It is widely assumed that micro-integrated data provide more reliable results, as they are based on a maximum amount of information. h ey also provide better coverage of subpopulations: if data are missing in one source, another source can be used.
In the 2011 Census, only two variables were not taken from a register: ‘occupation’ and ‘educational attainment’. Records from the Labour Force Survey (LFS) in a three year period around the enumeration date (1 January 2011) were used to estimate values for these two variables, which are included in 23 of the 60 hypercubes. Table consistency was guaranteed by using repeated weighting for these 23 hyper-cubes. h e method of repeated weighting, described extensively in Houbiers et al. (2003), is based on the repeated application of the regression estimator, generating a new set of weights for each table esti-mated. h e weights of the records in the microdata are adjusted in such a way that a new table estimate is consistent with all earlier table estimates.
We used the latest version of VRD sot ware developed by Statistics Netherlands for this repeated weighting. VRD stands for Vullen (= Filling) Reference Database, and the aim of the application is to i ll and manage the reference database. h e main functions of VRD are estimating tables via repeated weighting, adding these to the reference database, and withdrawing aggregates from the database. Un-der the condition of small, independent samples, variances of table values can also be estimated. Such estimated variances were used to set publication rules for cells and to calculate variation coei cients for the quality hypercubes, which serve as a quality assessment of the census hypercubes.
To maximise accuracy, all estimates are based on the largest possible number of records. Tables contain-ing only register variables are counted from the registers. Tables with at least one variable from the LFS are estimated from the largest possible combination of register and survey data. Initial weights have to be available for these estimations.
As part of the 2011 Census was compiled on the basis of sample data, margins of inaccuracy have to be taken into account for some results. A rule of thumb was applied for cell values based on a sample from the census population: only estimated table cells based on at least i ve persons are published. In addition, rare categories have been made coni dential to prevent disclosure of individual information.
CONCLUSION
play a role when survey microdata are reused, and the production time is much shorter. h ese advantages more than make up for the loss of some detail in tables based on survey variables. h e 2011 Census pro-vides data on the Netherlands that can be compared to results of earlier Dutch censuses and to results of other countries taking part in the 2011 Census Round.
Although most countries in the world still conduct traditional censuses, the Netherlands is not the only country with a register-based census. A number of countries in Europe have switched to combined and register-based censuses. h e 2011 Census was the fourth that the Netherlands conducted without census questionnaires.
Just as in the 2001 Census, the repeated weighting technique was used successfully to produce a con-sistent set of tables for the 2011 Census. A new additional method was introduced for the 23 hypercubes to be estimated. All tables that had to be estimated were based on the largest number of records possible and the resulting hypercubes are mutually consistent. It is important to apply micro-integration of the dif-ferent sources in the SSD before compiling tables using the estimation techniques. h e use of micro-integration and the applied estimation techniques guarantee the consistency between table results from dif erent hypercubes. h ere is thus no confusion for users of census information, as there is one i gure on each socio-economic phenomenon, instead of several i gures depending on which sources are used.
References
BAKKER, B. F. M., VAN ROOIJEN, J., VAN TOOR, L. h e System of social statistical datasets of Statistics Netherlands: An integral approach to the production of register-based social statistics. Statistical Journal of the IAOS, 2014, Vol. 30, pp. 411–424.
CORBEY, P. Exit the population census. Netherlands Oi cial Statistics, 1994, Vol. 9, pp. 41–44.
EUROPEAN COMMISSION. Regulation (EC) No 763/2008 of the European Parliament and of the Council of 9 July 2008 on population and housing censuses. Oi cial Journal of the European Union, 2008, L218, pp. 14–20.
EUROPEAN COMMISSION. Commission Regulation (EC) No 1201/2009 of 30 November 2009 implementing Regulation (EC) No 763/2008 of the European Parliament and of the Council on population and housing censuses as regards the tech-nical specii cations of the topics and of their breakdowns. Oi cial Journal of the European Union, 2009, L329, pp. 29–68. EUROPEAN COMMISSION. Commission Regulation (EU) No 519/2010 of 16 June 2010 adopting the programme of the statistical data and of the metadata for population and housing censuses provided for by Regulation (EC) No 763/2008 of the European Parliament and of the Council. Oi cial Journal of the European Union, 2010a, L151, pp. 1–13. EUROPEAN COMMISSION. Commission Regulation (EU) No 1151/2010 of 8 December 2010 implementing Regulation
(EC) No 763/2008 of the European Parliament and of the Council on population and housing censuses, as regards the modalities and structure of the quality reports and the technical format for data transmission. Oi cial Journal of the
European Union, 2010b, L324, pp. 1–12.
HOUBIERS, M., KNOTTNERUS, P., KROESE, A. H., RENSSEN, R. H., SNIJDERS, V. Estimating consistent table sets:
po-sition paper on repeated weighting [online]. Discussion paper 03005, Statistics Netherlands, Voorburg/Heerlen, 2003.
<http://www.cbs.nl/NR/rdonlyres/6C31D31C-831F-41E5-8A94-7F321297ADB8/0/discussionpaper03005.pdf>. SCHULTE NORDHOLT, E. Introduction to the Dutch Census 2011. In: SCHULTE NORDHOLT, E., VAN ZEIJL, J,
HOEKSMA, L. eds. Dutch Census 2011, Analysis and Methodology, Statistics Netherlands, h e Hague/Heerlen, Novem-ber, 2014a, pp. 7–18.
SCHULTE NORDHOLT, E. h e Dutch Census 2011. Paper presented at the Conference of European Statistics Stakeholders, Methodologists, Producers and Users of European Statistics (24–25 November 2014, Rome) by Eric Schulte Nordholt, 2014b. UNECE TASK FORCE ON CENSUS METHODOLOGY. Census methodology: Key results of the UNECE Survey on National
Census Practices, and i rst proposals about the CES Recommendations for the 2020 census round [online]. Paper presented
at the Fit eenth Meeting of the Group of Experts on Population and Housing Censuses (30 September–3 October 2013, Geneva) by Eric Schulte Nordholt, 2013. <http://www.unece.org/i leadmin/DAM/stats/documents/ece/ces/ge.41/2013/ census_meeting/3_E_x_15_Aug_WEB_revised_map.pdf>.