Bull Pan Am Health Organ 13(l), 1979
POPULATION AND N UTRITION PLANNING THE USEFULNESS
OF DEMOGRAPHIC DISCIPLINE FOR NUTRITION POLICY
JN LATIN AMERICA’
Charles H. Teller,’ Ivan Beghiq3 and Juan de1 Canto4
Demography can make valuable contributions to food and nu- trition planning. In this vein, preliminary results of a project being conducted by the Institute of Nutrition of Central Amer- ica and Panama (INCAP) have shown how demographic data can contribute to diagnostic and evaualtive frameworks, provide analytical indicators, refine definitions of target groups, and set target group size goals.
Introduction
The rising number of malnourished children in many Latin American countries is a striking feature of the late 20th century (I, 2, ?, 4). The magnitude and geographic distribution of this nutrition problem are often hard to estimate, however, because information is lacking in many countries, and because nutrition surveys or surveil- lance systems have not yet been applied. As a result, decision-makers in countries with increasing magnitude of malnutrition tend to be either unaware of this trend or un- willing to take strong countermeasures.
This article seeks to show how the demo- graphic discipline can effectively help in- stitutional efforts to diagnose and plan to improve the nutrition situation in Latin America. In this regard, it will cite evi- dence from a recently initiated INCAP project (5) that suggests demography can provide orientation and important infor- mation for multisectoral food and nutri-
1Als.o appearing in Spanish in the Roletin de la Oficina Sanitaria Panamericana. 1979.
ZSociologist-demographer, Division of Applied Nu- trition, Institute of Nutrition of Central America and
Panama, Apartado Postal 1188, Guatemala City, Gua- temala.
JMedical nutriologist and former chief of the Divi- sion of Applied Nutrition, INCAP.
4Agricultural economist and planner, Division of Applied Nutrition, INCAP.
tion planning efforts at both the national and local levels.
Until now, most literature and interna- tional assistance addressing the nutrition- population relationship has emphasized the “Population Problem” and population pol- icy (6-12). Our experience in Central America indicates, however, that affected governments accord greater priority and significance to the “Nutrition Problem” and nutrition policy, and that this side of the relationship therefore merits greater attention from those who work in the population field (13).
For example, considering Panama and the five Central American countries to- gether, only one of the six has a national population policy, while five of the six have or are developing national food and nutrition policies. Thus it seems that re- spect for nationally set priorities, at least in this region, demands that vital demograph- ic information be provided within the context of food and nutrition policies. Food and Nutrition Planning
In general, poor countries will attain an adequate nutritional status only when they can provide most of their people with a “minimum socioeconomic package” (per- manent employment opportunities, ade-
The rising number of malnourished
children
in many
Latin American countries is a
striking feature
of the late
20th century.
(Photo: INCAP.)
which
will be possible only when historic
conditions
permit.
In the short run, how-
ever, action programs
and projects
can be
oriented
to what might be called the “mini-
mum standards”
of food and nutrition-
a diet that satisfies
basic nutritional
re-
quirements,
especially
those of vulnerable
groups
such
as pregnant
and
lactating
women,
children
under
five, unemployed
male adults, etc.
Within
this context,
some Latin
Ameri-
can countries
have been looking
for their
own solutions
to food and nutrition
prob-
lems. One key way of doing
this that is
being employed
in Central
America
and
Panama is through
multisectoral
food and
nutrition
planning.
This centralized
plan-
ning
is accomplished
by a coordinating
body that includes
representatives
from the
most important
ministries
(i.e., health, agri-
culture,
education,
welfare,
etc.) responsi-
ble for dealing
with these problems.
This
institutional
arrangement,
in
turn,
is
linked
to the
creation
of
a national
capacity
for analyzing
the problem,
for-
mulating
plans and programs,
executing,
administering,
and evaluating
those plans
and programs,
and reformulating
them as
needed.
Regardless
of the approach
used, how-
ever, the task of confronting
these problems
has proved
neither
simple nor easy. The
first stage has usually
involved
a long and
sometimes frustrating
effort
of promotion
to make
the public
more
aware
of the
seriousness of the situation
and the close
link between malnutrition
and underdevel-
opment.
After
that, there is a continuing
need for operational
identification
of the
problems
to be attacked,
the most appro-
priate solutions,
and the best ways of pro-
curing
the financing
and manpower
re-
quired.
Demography’s
Role
Teller et al.
l DEMOGRAPHY IN NUTRITION PLANNING23
both development planning and agricul- tural planning, and numerous books, inventories, and manuals on these related subjects have been prepared (1426). These works indicate that applied population studies can make a significant contribution to food and nutrition planning in informa- tion-poor Latin American countries. In particular, such studies can help provide (1) diagnostic and evaluative frameworks, (2) analytical indicators and indices, and (3) a definition ,of the nature, size, and dis- tribution of the target groups.
The Diagnostic Framework
One reason nutrition planning has made limited use of demographic information in the past has been lack of a diagnostic model outlining possible relationships between population dynamics and nutrition. How- ever, several models of relationships be- tween population dynamics and economic development have recently been worked out
(28, 29).
In this same vein, Figure 1 presents a conceptual framework that can be used to identify certain demographic data impor- tant in diagnosing nutritional situations. While nutritional status can be viewed in terms of human capital as having impor- tant effects on the development process (school performance, productivity, etc.), here we are mainly interested in the determinants of, and constraints on, nutri- tion. The purpose of the framework is to place the demographic components in their proper perspective so that the importance of the historical, structural, and institu- tional components of the system of under- development that are, in fact, at the root of both nutrition and population problems, is not forgotten. Figure 1 postulates interac- tions of demographic processes (fertility, mortality, and migration) and structures (size, distribution, and composition) with the agro-economic structures and their effect on three critical areas: (1) family health; (2) food availability; and (3)
demand for services. The three areas, in turn, directly affect both food consumption and biological utilization of food, the most immediate determinants of nutritional status.
Analytical
Indicatorsand Indices
Nutrition planners diagnosing and eval- uating nutrition problems-and setting goals and targets for their programs-can make good use of nutritional indicators and indices that incorporate demographic data. Some indices with demographic com- ponents, such as per capita food demand projections or “food balance sheets” (1523), and some indirect indicators, such as infant and child mortality (30, 31, 3~9, have obvious importance. In addition, other analytical tools are being developed that need further refinement; among these are “nutritional density” (the amount of land cultivated in basic grains per agricul- tural worker), “rural displacement” (the rate at which farm families become unable to meet their own food needs), and the “standardized child mortality quotient” (the percentage of total deaths occurring among children 0 to 4 years of age, divided by the percentage of the whole population that is in this age range).
Clearly, social programs with nutritional goals (e.g., the World Food Program, food supplementation efforts, food stamp pro- grams, land reform actions) need such demographic data to evaluate their effec- tiveness. In addition, undertakings such as “nutritional surveillance” systems need them to set up “critical level points” and “trigger points” that allow changes to be detected early and that permit improve- ment or deterioration of the situation to be predicted (33, 34).
yk
(notional and Internotlonol]
L
Figure 1. Relation between social structure and other factors that affect nutritional status with emphasis on their demogmphic components.
. food productron
. tncome and food
I
MICRO AND DEMOGRAPHICPROCESS AND STRUCTURES
I
FAMILY HEALTH
l fomdy composltlon
l morbldlty
. lactotlon
. sanltotlon and
hygene
+ l fertlllty, mortality, mlgrotlon +
l fomlly and nottonal we,
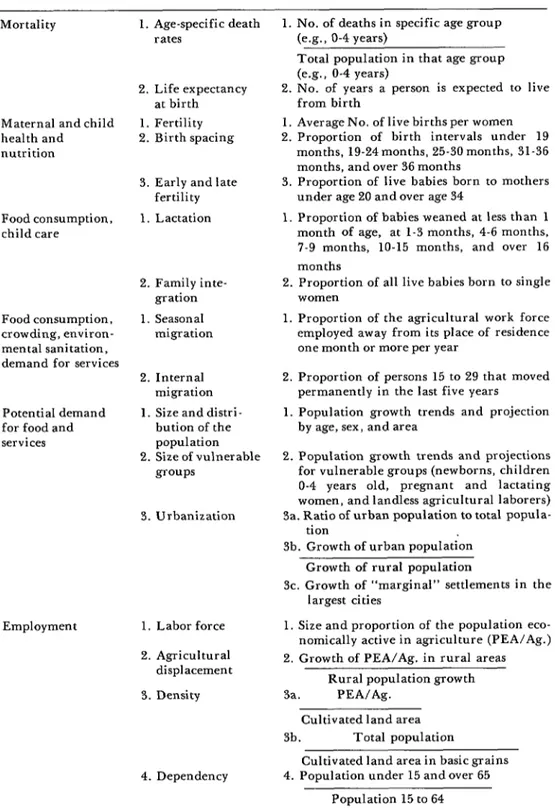
Table 1. Selected sociodemographic indicators and indices related to malnutrition. Factors related to
food and nutrition Related data Indicator or index Mortality
Maternal and child health and nutrition
Food consumption, child care
Food consumption, crowding, environ- mental sanitation, demand for services
Potential demand for food and services
Employment
1. Age-specific death 1. No. of deaths in specific age group
rates (e.g., O-4 years)
2. Life expectancy at birth 1. Fertility 2. Birth spacing
3. Early and late fertility 1. Lactation
2. Family inte- gration 1. Seasonal
migration
2. Internal migration 1. Size and distri-
bution of the population 2. Size of vulnerable
groups
3. Urbanization
1. Labor force 2. Agricultural
displacement 3. Density
Total population in that age group (e.g., O-4 years)
2. No. of years a person is expected to live from birth
1. Average No. of live births per women 2. Proportion of birth intervals under 19
months, 19-24months, 25-30 months, 31-36 months, and over 36 months
3. Proportion of live babies born to mothers under age 20 and over age 34
1. Proportion of babies weaned at less than 1 month of age, at 1-3 months, 4-6 months, 7-9 months, lo-15 months, and over 16 months
2. Proportion of all live babies born to single women
1. Proportion of the agricultural work force employed away from its place of residence one month or more per year
2. Proportion of persons 15 to 29 that moved permanently in the last five years 1. Population growth trends and projection
by age, sex, and area
2. Population growth trends and projections for vulnerable groups (newborns, children O-4 years old, pregnant and lactating women, and landless agricultural laborers) 3a. Ratio of urban population to total popula-
tion
3b. Growth of urban population Growth of rural population
3c. Growth of “marginal” settlements in the largest cities
1. Size and proportion of the population eco- nomically active in agriculture (PEA/Ag.) 2. Growth of PEA/An. in rural areas 3a.
Rural population growth PEA/Ag.
4. Dependency
Cultivated land area 3b. Total population
Cultivated land area in basic grains 4. Population under 15 and over 65
26
PAHO BULLETIN .vol. 13, no. 1, 1979
available, up-to-date, and of sufficient tributor of natural resources, as well as the quality to be applied to the particular case socializer of health and food habits and or country involved. beliefs.
Target Groups
It has been customary to define the target groups of nutrition programs biode- mographically by age and sex (children under 5 years of age, pregnant and lac- tating mothers) (31). Now it also seems im- portant to define other sociodemographic groups that can be “functionally classified” in terms of their impact on, and receptivity to, selected nutrition interventions (35). One needs to know not only who these groups’ members are (as defined by census characteristics) but also their numbers and geographic distribution. In addition, plan- ners will want to know how many members there will be in 5, 10, or even ‘20 years. For it is projections of nutritional need based on such data that can most adequately guide formulation of nutrition targets and ulti- mately promote rational resource alloca- tion.
2) Objectivity: Compared with other necessary data-such as statistics on income, diet, productivity, illness, habits, and values-demographic data are more easily quantified and comprehended. That is because most demographic concepts-such as birth, death, age, sex, and marriage- are very basic and are universally under- stood.
Advantage of Demographic Information Our recent experience with national food and nutrition planning in Central America indicates that even despite deficiencies in data quality, demographic information has several advantages over other data, such as economic, agricultural, dietary, and health information. These advantages arise both from the nature of demographic variables and from the availability of the data-its being necessary to compile Civil Registry, census, and sample demographic survey information for other purposes. The fol- lowing are among the principal benefits offered by demographic information:
3) Geographic coverage: Malnutrition has geographic dimensions as well as social, economic, and medical ones. At-risk groups-such as tenant farmers, seasonal migrants, and female-headed households- are often geographically concentrated. Nu- trition surveys, which are relatively expen- sive, cannot hope to provide nearly the same coverage as Civil Registry statistics or a national census. Furthermore, improved computer facilities and new computer pro- grams 5 now permit specified tabulation and analysis of census or Civil Registry data, organized according to’the sociopolit- ical subdivisions desired (towns, cities, dis- tricts, departments, etc.).
4) Trends and projections: Demographic data can usually be expressed in terms of trends and tendencies, because the same information has been collected periodically for many years. Thus, if certain assump- tions are made about the future, demo- graphic data can be used to make long- term projections. And such projections (for example, of the nutritional needs of certain target groups or geographic areas) permit planners to estimate program costs and alternatives.
. . . 1) Family level data: In nutrition analy-
sis, the family is a key unit. Demographic data routinely measure the structure, char- acteristics, and composition of this unit, which is often both the producer and dis-
Teller et al.
. DEMOGRAPHY IN NUTRITION PLANNING27
Of course, the quality of demographic data will have limitations related to prob- lems inherent in the information systems of developing countries. Yet this traditional complaint no longer justifies failure to consider using corrected and adjusted data. And since new models, techniques, and data processing hardware for making such corrections and adjustments are now avail- able in most countries (36, 37), the major limitations at present seem to be shortages of technical personnel with demographic training and lack of appropriate budgetary backing by government ministries, particu- larly planning ministries.
Recent Incorporation of Demography in Central American Nutrition Planning
In late 1976 the Division of Applied Nu- trition at the Institute of Nutrition of Cen- tral America and Panama (INCAP) ini- tiated a project called “The Sociodemo- graphic Dimensions of Nutrition Plan- ning.” This was done within the context of a larger program aimed at strengthening nutrition planning capacities in Central America and Panama. The project set out first to determine how the countries de- fine the importance and relevance of these sociodemographic dimensions, and then to generate a consciousness of their potential usefulness in the nutrition planning proc- ess. Work with the countries has then con- tinued in an effort to strengthen their ca- pacity to generate, organize, analyze, in- terpret, and use sociodemographic infor- mation for purposes of nutrition planning.
Three activities carried out with Cen- tral American professionals during the project’s first year demonstrated the useful- ness of this sort of demographic work. One activity involved working up a “Demo- graphic Sourcebook for Food and Nutri- tion Planning” and applying it to the plan- ning process (17); another dealt with incorporation of demographic components into a nutritional surveillance system: and
the third sought to show how analysis of census tapes can make an important con- tribution to study of the functional clas- sification of malnutrition (38).
The Demographic Sourcebook
This sourcebook was developed in re- sponse to data needs by the five Central American countries and Panama now in various stages of national nutrition plan- ning. Its basic purpose is to overcome prob- lems created by demographic data that are inaccessible, out of date, aggregated, or inconsistent in estimates of the same rates or trends-all obstacles that tend to inhibit the use of valuable sources of data. How- ever, the sourcebook is not just another demographic yearbook or bulletin: rather, it is a working document that provides the basis for its own revision, adaptation, and updating by multisectoral planning groups in accord with specific needs,
Based upon the conceptual scheme ex- plained previously (see Figure I), the sourcebook divides its demographic infor- mation into three broad categories: (1) indirect indicators of protein-energy mal- nutrition (PEM); (2) factors conditioning or determining PEM; and (3) projections of demographic structures and nutritional target groups. These data are represented as historical trends and as geographic, social, and ethnic differentials in 40 to 50 tables.
28
PAHO BULLETIN lvol. 13, no. I, 1979
have found it useful in assessing their situa- good idea of its direction and magnitude of
tions. change.
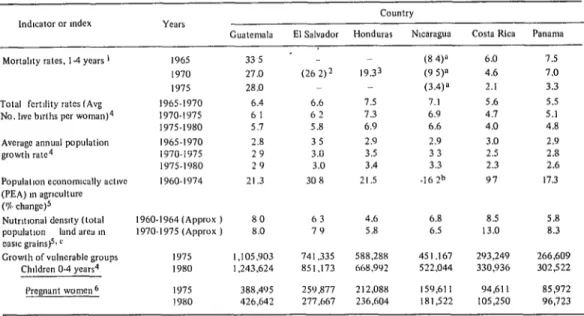
Table 2 presents a comparison of six so- ciodemographic indices and indicators for which relatively reliable data are available. Some of these figures have been affected by underregistration (e.g., mortality), or by changed census definitions (e.g., population economically active in agriculture), or by adjustments introduced by the Latin Amer-
ican Center for Demography (CELADE) to permit adequate comparison (e.g., total fer- tility rate, annual average growth rate, growth of vulnerable groups). Nevertheless, with only a few exceptions that are noted in the table, each index or indicator has been calculated in such a way as to give a fairly
Although any thorough analysis of these figures would of course require an under- standing of each country’s historical, socio- political, and economic situation; and although regional and social class differ- ences are important, the table does show several things. For one thing, it suggests that both Costa Rica and Panama are rela- tively far along in the demographic transi- tion from high to low rates of fertility, child mortality, and population growth. This is especially true with regard to child mortali- ty, the indicator most directly related to malnutrition.
In addition, as would be expected, high
Table 2. Trends in sererpl so&demographic indicators useful in food and nutrition planning-Central America and Panama, 1960-1980.
Guatemala
Country
El Salvador Honduras NlC~LlgUl Costa Rica Pa”kUlXl
Mortahty rates. l-4 years ’ 1965 33 5
1970 27.0
1975 28.0
Total fertditv rates (Ave 1965.1970 6.4
No. hve buths per worn~$~ 1970-197s 61
1975.1980 5.7
Average annual population 1965.1970 2.8
growth mtc4 1970-197s 29
1975-1980 29
Populakm economically actwc 1960.1974 21.3
(PEA) I” ~g~~lture (% change)5
Nutrltvmel dens0 (total 1960.1964 (Approx ) 80
populatwn land arcil I” 1970.1975 (Approx ) 8.0
wstc grai”sFz u
Growth of vulnerable groups 1975 1.105.903
Chddrcn 0.4 years4 1980 I ,243.624
pregnant women6 197s 388,4Y5 25Y.877
I980 426,642 277.667
(26 2)2
6.6 62 5.8 35 3.0 3.0 30 8
63 79
741,335 X51.173
(8 4)” 6.0 7.5
19.33 (9 9” 4.6 7.0
- (3.4)” 2.1 3.3
7.5 7.1 5.6 5.5
7.3 6.9 4.7 5.1
6.9 6.6 4.0 4.8
2.9 2.9 3.0 2.9
3.5 33 2.5 2.8
3.4 3.3 2.3 2.6
21 .5 .162b 97 17.3
4.6 6.8
5.8 6.5
588,28X 451.167
668.9Y2 522,044
212,088 159,611
236,604 181,522
8.5 5.8
13.0 8.3
293,249 266.609
330,936 302,522
94.61 I 85,972
105,250 96,123
Sources
lEsrod,‘sricas !‘!/ales-death rdte per 1,000 chddren l-4 yearsof age.
%-‘,ffer, R R., and C V Serrano (28) The data cited IS for d rurdl area near San Salvador The rate reported for portmns of San Sdlvador was
8.0.
30rtega A., dnd M Rm& Mortalrdud kn<ursla Ikmogrl/,~u No(wnelde Hondrrros (EDENH) Ldlm Amer~an Center for Demography
(CELADE), sdn JO&, COSC~ RICI, 1975
ZLdlm Amerxan Center for Demogrdphy (CELADE), Holerin Demogrdfu. Nos. I7 and IX. Idn , l97h. July. 1976
Calculations performed al INCAP with datd from populatmn and agr~cullurdl censuses and surveys
6~~cu1rtm”s performed dt INCAP based on fertlhty lutes from the Bokrin /IrmogrJJ~~o (K-LADE), No 17. and felal mortahty pales from
the CWII Registry.
“These figures indicate heavy under-reportmg of child deaths
bThese figures reflecl apparent under-countmg of the population currently actwe m agrjculture. m Guatemala thts W~F largely due to mismterprc-
tatmn of a change from d “de facto” census (I 964) lo a “de lure” census (1973).
Teller et al.
l DEMOGRAPHY IN NUTRITION PLANNING29
rates of fertility are related to high pro- jected absolute increases in the nutritional- ly vulnerable groups of young children and pregnant women. Nutritional density, on the other hand, does not seem as directly related to population growth rates, because other factors, such as available frontiers (in Guatemala and Nicaragua) and changing technology and social infrastructure (in Costa Rica) alter this indicator’s implica- tions for nutritional well-being.
Nutrition and Food Surveillance
Nutrition and food surveillance systems are needed that will detect change early and predict deterioration. Specifically, it should be known when the situation in a given region reaches “critical levels” or passes “trigger points” signalling that corrective action programs should begin. In this vein, demographic information can help monitor (1) changes in an event (such as mortality); (2) changes in the size and composition of the general population in the service area: and (3) changes in vulnerable or “target” population groups (e.g., children 1-4 years of age).
It is often necessary to have auxiliary or volunteer personnel collect surveillance sys- tem data periodically at the local level, using simple data collection techniques and incentives. The data can then be utilized not only for monitoring the situation, but also for purposes of programming and evaluation. We have found that when field personnel are fully aware of the importance and usefulness of such data, the quality im- proves significantly. In this way the system can help to improve the quality of surveil- lance, to improve program relevance, and to reduce the time lost between data collection and analysis.
Costa Rica, El Salvador, and Guatemala have expressed interest in implementing this kind of system; Nicaragua has collected its base-line data; and Honduras has estab-
lished such a system in one department on an experimental basis.
Functional Classification
ofMalnutrition
@CM)
The goal of FCM is to identify specific population subgroups in regions that are administratively, economically, and ecolog- ically unified for purposes of program plan- ning (35). One pilot FCM study recently carried out in El Salvador emphasized the role of detailed census data. The study identified distinct sets of vulnerable people in a given region and quantified the size of the groups involved and their respective problems. A variety of other data sources and collection methodologies were used too-including anthropometric and socio- economic surveys, and anthropological studies.
In addition, copies of population and housing census tapes were used to obtain sociodemographic data on each of the more than
2,000 cantones
(local political subdivi- sions) of El Salvador. This permitted the manipulation of variables relating to iden- tification of small subregions and subgroups and their elaboration according to research needs. These census tape data were required early in the project for selection of regional samples used to evaluate nutritional status and the socioeconomic characteristics of families, and also to help orient selection of communities and families for social anthro- pologists’ later in-depth studies.Final Remarks
30
PAHO BULLETIN lvol. 13, no. 1, 1979
also provides evidence that can motivate ac- problems are likely to be given greater im- tions capable of bringing about more portance in development planning (39). permanent improvements. Awareness of the fact that the number of
In the same way, if more attention is malnourished children may be increasing given to demographic factors relating to in certain countries, for instance, could specific social and economic development stimulate significant actions in both the problems like malnutrition, then such nutrition and population fields.
SUMMARY This paper reflects preliminary experience with a project on the sociodemographic dimen- sions of national food and nutrition planning.
In general, Central American planners and policy-makers responsible for development stra- tegy have tended to place greater emphasis on the “Nutrition Problem” than on the “Popula- lation Problem.” Nevertheless, there is wide- spread recognition of the need for demographic information in the various stages of the multi- sectoral nutrition planning process, particularly in the areas of diagnosis, goal-setting, and evalu- tion,
Our experience to date indicates that demo- graphy can make particularly important contri- butions to nutrition planning by helping to pro- vide a diagnostic framework, analytical indi- cators and indices, and definition of target
groups’ nature, size, and distribution. In addi- tion, demographic information appears to be more useful than some other types of data ip some areas of nutrition planning-partly be- cause of its nature and partly because large quantities of demographic data are available- having been collected to meet other governmen- tal needs.
To date, three projects carried out in Central America in connection with our work have pro- vided good examples of the potential value of demography in nutrition planning. In particu- lar, interest expressed in a “demographic source- book” of indicators and indices seems to demon- strate a felt need to improve national planning capacity with local demographic data that is available and not dependent upon external sources of information.
REFERENCES (I) SecretarIa del Consejo National de Plani- ficacibn Economica-Instituto de NutriciBn de Centro America y Panama (ZNCAP). Andlisis de1 problema nutritional de la poblacio’n de Guate- mala, sector salud. INCAP, Guatemala, 1977. 94 PP.
(2) Ministerio de Salud Publica y Asistencia Social de El Salvador - Instituto de Nutrition de Centro America y Panama (INCAP). Clasz’fica- cirin funcional de problemas nutricionales en El Salvador: Reportefinal, resumen y conclusiones. INCAP, Guatemala, 1977. 11 pp.
(3) Teller, C., and V. Bent. “Demographic factors and their food and nutrition policy rele- vance: the Central America Situation.” Paper presented at the Annual Meeting of the Popula- tion Association of America held in Atlanta,
Georgia, 13-15 April 1978.
(4) Teller, C., R. Sibridn, C. Talavera, V. Bent, J. de1 Canto, and L. Sdenz. “Population and nutrition: the implications of sociodemo- graphic dynamics for food and nutrition poli-
cy." Paper presented at the XI International Nutrition Congress held in Rio de Janeiro, Bra- zil, 25 August-l September 1978.
(5) Teller, C. H., I. Beghin, J. del Canto, and H . Delgado. “Developing Governmental Capaci- ty to Generate, Interpret and Utilize Sociodemo- graphic Information in National Nutritional
Planning: A New Priority for Research and Action in the Nutrition’ Area.” Paper presented at the meeting of the World Population Society held in Washington, D.C., on 5-7 December 1976.
(6) National Academy of Sciences. Rapid Population Growth: Consequences and Policy Implications Johns Hopkins University, Balti- more, 1971.
(7) Taylor, C. Nutrition and population. In: A. Berg, N. Scrimshaw, and D. Call (eds.), Nutrition, National Development and Plan- ning. MIT Press, Cambridge, Mass., 1975, pp. 74-80.
Teller et al.
l DEMOGRAPHY IN NUTRITION PLANNING 31tion and nutrition: A case for integration. Milbank Mem Fund Q, Spring 1974, pp. 168- 184.
(9) Correa, H. Population, Health, Nutri- trition and Development: Theory and Planning. Lexington Books, Lexington, Mass., 1975.
(10) National Academy of Sciences. Nutrition and Fertility Interrelationships: Implications for Policy and Action. Washington, 1975. 60 pp.
(11) Manocha, S. L. Nutrition and Our Over- populated Planet. Thomas, Springfield, Ill., 1975.
(12) Berg, A. Nutrition, development and population growth. Population Bulletin 29(l):
l-36, 1973.
(13) Beghin, I., J. de1 Canto, and C. H. Teller. “Malnutrition, National Development and Planning.” Paper presented at the Interna- tional Conference on Practical Approaches to Combat Malnutrition, with Special Reference to Mothers and Children, held in Cairo, Egypt, on 25-29 May 1977. 19 pp.
(14) Bilsborrow, R. E. The Preparation ofan Inventory of Demographic Data for Social and Economic Planning (L.R.S. Manual No. 5). University of North Carolina, Laboratories for Population Statistics, Chapel Hill, 1974. 39 pp. (15) Baldwin, K.D.S. Demography for Agri- cultural Planners. FAO, Development Research Training Service, Policy Analysis Division, Rome, 1975.
(16) Robinson, W. C. (ed.). Population and Development Planning. The Population Coun- cil, New York, 1975.
(17) Teller, C. H., and E. Diaz. Cutdlogo demografico para la utilizacidn en la planifica- cion nutritional en Centroamerica y Panama. Instituto de Nutrition de Centro America y Panama (INCAP), Guatemala, 1977. 405 pp.
(18) Stamper, M. Population and Planning in Developing Nations: A Review of Sixty Develop- ment Plansfor the 1970s. The Population Coun- cil, New York, 1977. 265 pp.
(19) McGreevey et al. Population and Devel- opment Policy. McGreevey Associates, Washing ton, 1977. 169 pp.
(20) Ridker, Ronald. Population and Devel- opment: The Search for Selective Interventions. Johns Hopkins University, Baltimore, 1976. (21) Unikel, L., and P. Perez (eds.). Potential Contribution of Demographic Analysis: The Policy Planner’s View. In: IUSSP, International Population Conference (Vol. 2). Mexico City, 1977, pp. 195-210.
(22) Elizaga, Juan. “Inversion de las variables demograficas en la programacidn econ6mica y social.” Paper presented at the Reunion Paralela
sobre Poblacion y Desarrollo en America Latina held at Mexico City on 4-6 August, 1977.
(23) Alexandratos, N., L. Naiker, and W. Schulte. Demographic Variables in Seetoral Pol- icies: The Case of Agricultural Development. In: IUSSP, International Population Conference (Vol. 2). Mexico City, 1977, pp. 111:13Q.
(24) United Nations. “National Programmes of Analysis of Population Census Data, as an Aid to Planning and Policy Making.” Population Studies, No. 36, ST/SOA/Series A/36, New York, 1964.
(25) United Nations. “General Principles for National Programs of Population Projections as Aids to Development Planning.” Papulation Studies, No. 38, ST/SOA/Series A/38. New York, 1965.
(26) United Nations. Population and Food. In: The Determinants and Consequences of Population Trends (Vol. 1, Chap. 12). New York, 1973.
(27) Teller, C. H., W. Butz, J. de1 Pinal, H. Delgado, and R. Klein. “Urbanization, Breast- feeding and Birth Spacing in Guatemala: lmpli- cations for Nutrition Policy.” Paper presented at the Annual Meeting of the Population Associa- tion of America held in St. Louis, Missouri, on 20-22 April 1977. 31 pp.
(28) Blandy, R., and R. Wery. BACHUE-1. In: International Union for the Study of Popu- lation, International Population Conference (Vol. 1). Liege, 1973.
(29) Corporation Centro Regional de Pobla- c&-r. Modelo seres: Estructura y usos (Area socioeconomica, monografia No. 3). Bogoci, Colombia, 1974.
(30) Puffer, R. R., and C. V. Serrana. Pat. terns of Mortality in Childhood. PAHO Scienti- fic Publication No. 262. Pan American Health Organization, Washington, 1973.
(31) Aranda-Pastor, J., G. Arroyave, M. F~Q- res, M. A. GuzmLn, and R. Martorell. Indica- dores minimos de1 estado nutritional. Rev&u de1 Colegio Medico (Guatemala) 26: 5-27, 1975.
(32) Enderica, V. R. “Cuociente entre por- centajes de mortalidad y poblacidn menores de cinco aiios, coma indicador demografico de1 es- tado nutritional.” Arch Latinoam Nutr 24(l): 423-429, 1974.
(33) World Health Organization. Msthod- ology of Nutritional Surveillance: Report of a
Joint FAO/UNICEF/WHO Expert Committee. WHO Technical Report Series No. 593, Geneva, 1976.
32
PAHO BULLETIN ”vol. 13, no. 1, 1979
salud.” Paper presented at the 8= Reunion Cientifica International de la Asociacion Inter- national de Epidemiologia held in San Juan, Puerto Rico, on 18-23 September 1977. (In press.)
(35) Joy, L., and P. R. Payne. Nutrition and national development planning. Food Nutr l(4):%10, 1975.
(36) Fox, R. “La evaluation de1 cambio demografico y social en America Latina: Fundamentos estadisticos.” Paper presented at the Primera Reunion Tecnica de Intercambio entre Organismos Gubernamentales Responsa- bles de las PolIticas de Poblacidn en America
November 1976. 38 pp.
(37) Lopes, V. Las fuentes tradicionales e datos demograficos en America Latina. Notas e Poblaci6n 1(2):17-22, 1973.
\ (38) Valverde, V., F. Trowbridge, I. Beghi , B. Pillet, I. Nieves, N, Sloan, T. Farrell, I’. Payne, L. Joy, and R. Klein, Functional Clas-
szyication of Undernourished Po$ulatk’ans in the Republic of El Salvador: Methodological Deuel- opment. Institute of Nutrition of Central America and Panama, Guatemala, (In press.) 30 PP.
(39) Johnston, B. Food, health and popula- tion in development strategies. Journal of Eco-
Latina held in San Jose, Costa Rica, on 7-12 nomic Integration, September 1977.
DRUG-RESLSTANT TUBERCULOSIS*
The U.S. Center for Disease Control reported (23 December 1977) an outbreak of drug-resistant tuberculosis in a rural northern Mississippi county. Since then, five more cases of tuberculosis due to organisms with confirmed primary resistance to isoniazid, para-aminosalicylic acid, and streptomycin (INH *PAS-SM) have been reported, bringing to 19 the total number of such cases since 1964. These 19 patients have been under alternative drug regimens, and all but one have responded favor- ably. One patient who was under treatment relapsed due to poor compliance, but her two-year old son was clinically diagnosed as having tuberculosis with negative bacteriology.
Four of the 19 cases occurred since 1976 in individuals who had received INH as preventive therapy. Records show that three of the four took INH irregularly; the fourth patient had taken 10 months of INH medication over a 12.month period. Nevertheless, it is possible that this patient had not been infected with Mycabacte- rium tuberculosis at the time he received INH, since the results of his tuberculin tests were questionable (5-mm reaction to tuberculin, PPD).
This outbreak is unusual because it is the first documented community outbreak of drug-resistant tuberculosis. Another unusual fact is that this strain exhibits con- siderable catalase activity. The catalase activity of INH-resistant strains of tubercu- losis is usually absent or weak, and such strains exhibit diminished virulence in laboratory animals. The fact that the present strain retains its catalase activity may explain its apparent virulence. Officials from the Mississippi State Board of Health and from CDC are conducting ongoing surveillance and containment activities in relation to this outbreak, and special long-term follow-up activities are being ini- tiated for cases and contacts thought to be infected with this drug-resistant strain.