TCD
7, 343–371, 2013InSAR rock glaciers
Lin Liu et al.
Title Page
Abstract Introduction
Conclusions References
Tables Figures
◭ ◮
◭ ◮
Back Close
Full Screen / Esc
Printer-friendly Version Interactive Discussion
Discussion
P
a
per
|
Dis
cussion
P
a
per
|
Discussion
P
a
per
|
Discussio
n
P
a
per
|
The Cryosphere Discuss., 7, 343–371, 2013 www.the-cryosphere-discuss.net/7/343/2013/ doi:10.5194/tcd-7-343-2013
© Author(s) 2013. CC Attribution 3.0 License.
The Cryosphere Discussions
This discussion paper is/has been under review for the journal The Cryosphere (TC). Please refer to the corresponding final paper in TC if available.
Surface motion of active rock glaciers in
the Sierra Nevada, California, USA:
inventory and a case study using InSAR
Lin Liu1, C. I. Millar2, R. D. Westfall2, and H. A. Zebker1
1
Department of Geophysics, Stanford University, Stanford, CA, USA
2
USDA Forest Service, Pacific Southwest Research Station, Albany, CA, USA
Received: 27 December 2012 – Accepted: 2 January 2013 – Published: 23 January 2013
Correspondence to: Lin Liu ([email protected])
TCD
7, 343–371, 2013InSAR rock glaciers
Lin Liu et al.
Title Page
Abstract Introduction
Conclusions References
Tables Figures
◭ ◮
◭ ◮
Back Close
Full Screen / Esc
Printer-friendly Version Interactive Discussion
Discussion
P
a
per
|
Dis
cussion
P
a
per
|
Discussion
P
a
per
|
Discussio
n
P
a
per
|
Abstract
Despite the abundance of rock glaciers in the Sierra Nevada of California, USA, few efforts have been made to measure their surface flow. Here we use the interferometric synthetic aperture radar (InSAR) technique to compile a benchmark inventory describ-ing the kinematic state of 59 active rock glaciers in this region. Statistically, these rock 5
glaciers moved at speeds range from 15 cm yr−1 to 88 cm yr−1 with a mean value of 55 cm yr−1in the late summer of 2007. We also find a spatial gradient: rock glaciers in the southern Sierra Nevada moved faster than the ones in the central Sierra Nevada. In addition to the inventory mapping, we also conduct a case study to measure the surface flow of the Mount Gibbs rock glacier in fine spatial and temporal detail. The 10
InSAR measurements over this target reveal (1) that the spatial pattern of surface flow is influenced by surface geomorphological features and (2) a significant seasonal vari-ation of flow speed whose peak value was 48 cm yr−1 in the fall, more than twice the minimum value observed in the spring. The seasonal variation lagged air temperatures by three months and likely results from temporal changes in mechanical strength of 15
mixing debris and ice, internal melting of ice, and surface snow cover. Our finding on the seasonal variation of surface speed reinforces the importance of a long time series with high temporal sampling rates to detect possible long-term changes of rock glaciers in a warming climate.
1 Introduction
20
Rock glaciers are tongue- or lobate-shaped landforms on high mountain slopes, typi-cally consisting of mixtures of unconsolidated rock debris and ice. Rock glaciers are of geomorphological, climatic, and hydrological importance in alpine periglacial environ-ments. They are visible indicators of permafrost and contribute to a major portion of mass transport of the alpine landforms (Barsch, 1977; Humlum, 2000; Brenning, 2005; 25
TCD
7, 343–371, 2013InSAR rock glaciers
Lin Liu et al.
Title Page
Abstract Introduction
Conclusions References
Tables Figures
◭ ◮
◭ ◮
Back Close
Full Screen / Esc
Printer-friendly Version Interactive Discussion
Discussion
P
a
per
|
Dis
cussion
P
a
per
|
Discussion
P
a
per
|
Discussio
n
P
a
per
|
and thus provide information and insights on paleoclimate (Clark et al., 1994; Humlum, 1998; Haeberli et al., 1999; Konrad et al., 1999; Harrison et al., 2008). Finally, they prolong ice melt and sustain surface runoff in a warming climate, acting as water re-serves that are especially important in semi-arid mountain areas (Burger et al., 1999; Brenning, 2005; Croce and Milana, 2002; Millar et al., 2012).
5
Surface kinematics is a fundamental physical state of rock glaciers. Active rock glaciers creep downslope cohesively as a consequence of the deformation of inter-nal ice. Surface flow is related to regiointer-nal forcing including climatic conditions and local factors such as thickness, slope, and internal structures. Therefore, temporal variation in surface kinematics sheds light into changes in regional and local conditions.
10
Possible change of rock glacier flow in response to ongoing climate warming is also an intriguing and important problem. Compared to ice glaciers, rock glaciers are be-lieved to be less sensitive to rising temperature due to isolation of rock mantles (Clark et al., 1994; Barsch, 1996). However, there are also emerging observations suggest-ing that rock glaciers in the European Alps have increased flow rates since circa 1990 15
(e.g. K ¨a ¨ab et al., 1997; Krainer and Mostler, 2000; Delaloye et al., 2008; N ¨oetzli and Vonder M ¨uehll, 2010).
Both field and remote sensing methods have been used to measure rock glacier surface flow. Repeat geodetic surveys map surface displacement at selected ground markers, usually a few years apart (e.g. Wahrhaftig and Cox, 1959; Barsch, 1996; 20
Berthling et al., 1998; Konrad et al., 1999; Lambiel and Delaloye, 2004). Due to the re-mote locations of rock glaciers in high mountains, field observations are usually scarce and do not provide a complete view of rock glacier movement and processes. Remote sensing techniques such as repeat photogrammetry (e.g. K ¨a ¨ab et al., 1997; K ¨a ¨ab, 2002) and terrestrial laser scanning (Avian et al., 2009) have proved to be especially 25
useful to fill the spatial gaps.
TCD
7, 343–371, 2013InSAR rock glaciers
Lin Liu et al.
Title Page
Abstract Introduction
Conclusions References
Tables Figures
◭ ◮
◭ ◮
Back Close
Full Screen / Esc
Printer-friendly Version Interactive Discussion
Discussion
P
a
per
|
Dis
cussion
P
a
per
|
Discussion
P
a
per
|
Discussio
n
P
a
per
|
hundreds of km long. And most InSAR deformation maps have a spatial resolution as fine as 10 m. These merits make InSAR a unique tool for measuring rock glaciers flow kinematics including (1) inventory mapping and (2) detailed case studies on individual rock glaciers. The latter capability has been demonstrated at targets around the world (Rott and Siegel, 1999; Nagler et al., 2002; Rignot et al., 2002; Kenyi and Kaufmann, 5
2003; Strozzi et al., 2004).
In this study we use the InSAR technique to map surface motion of rock glaciers in the Sierra Nevada of California, USA. Despite their abundance in this region, rock glaciers are largely overlooked. They have been recently brought to wider attention partly thanks to the inventory compiled by Millar and Westfall (2008) based on their field 10
studies (hereafter referred to as the “MW database”, which is available at the National Snow and Ice Data Center http://nsidc.org/data/ggd652.html). Still, little is known about their kinematic states, let alone the long-term changes in surface flow.
Our first objective is to conduct a quantitative and nearly spatially-complete assess-ment on the kinematic behaviors of the active rock glaciers in the Sierra Nevada. Us-15
ing space-borne InSAR data, we compile a georeferenced inventory to describe flow speed, aspect direction, and area of active motion of active rock glaciers in the region. To our knowledge, this is the first InSAR study on rock glaciers in the Sierra Nevada. Our regional-scale mapping effort on rock glaciers is the only one outside the Swiss Alps (Delaloye et al., 2010). Regional survey is difficult to accomplish logistically by 20
field measurements. As a secondary product of the InSAR study, we are also able to identify rock glaciers based on their distinct kinematic behaviors from stable surround-ings. Some of these rock glaciers have been overlooked in field studies due to their remoteness and their similar appearance to moraines and scree slopes (Millar and Westfall, 2008). For the latter reason, it is also difficult to spot many rock glaciers on 25
optical remote sensing images.
TCD
7, 343–371, 2013InSAR rock glaciers
Lin Liu et al.
Title Page
Abstract Introduction
Conclusions References
Tables Figures
◭ ◮
◭ ◮
Back Close
Full Screen / Esc
Printer-friendly Version Interactive Discussion
Discussion
P
a
per
|
Dis
cussion
P
a
per
|
Discussion
P
a
per
|
Discussio
n
P
a
per
|
snapshot of surface motion over periods ranging from one day to a few years. Our case study on the Mount Gibbs rock glacier for the first time detects a significant seasonal variability of surface motion from space.
2 Rock glaciers in the Sierra Nevada of California
2.1 Overview
5
The Sierra Nevada is a major mountain range located between the Central Valley and the Basin and Range province in California. It has warm Mediterranean and semi-arid climates, characterized by warm dry summers and cool wet winters. The entire region was heavily glaciated during the Pleistocene (Clark and Gillespie, 1997). A few small ice glaciers and persistent snow fields are scattered at cirques in the high mountains. 10
The glaciers are of Late Holocene origin and not relicts from the Pleistocene. De-composed rock is abundant, especially along metamorphic exposures of the eastern escarpment.
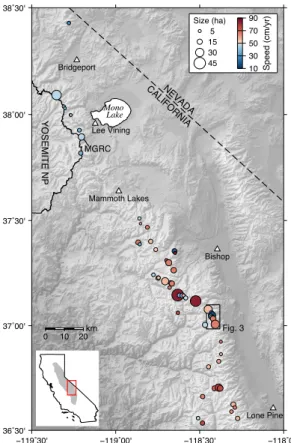
Rock glaciers and related landforms are common throughout cirques and valleys of the central and southern parts of the range. Our study area extends from north of 15
Bridgeport to Lone Pine as shown in Fig. 1. Millar and Westfall (2008) mapped more than 280 rock glaciers in this area. According to their different locations, origins, and shapes, Millar and Westfall (2008) further grouped the rock glaciers into two classes: cirque rock glaciers and valley wall rock glaciers. Cirque rock glaciers originate in high cirques and flow parallel to the valley axis as long-lobed debris bodies. They often have 20
an ice or snow field at the cirque wall and arcuate flow lines on the debris surface. The MW database lists 184 cirque rock glaciers, 67 % of which are active and have a mean elevation of 3390 m and a mean size of 20 ha. Valley wall rock glaciers occur on valley walls and are characterized by wide wedge-shaped structures. The MW database in-cludes 105 valley rock glaciers, 61 % of which are active and have a mean elevation of 25
TCD
7, 343–371, 2013InSAR rock glaciers
Lin Liu et al.
Title Page
Abstract Introduction
Conclusions References
Tables Figures
◭ ◮
◭ ◮
Back Close
Full Screen / Esc
Printer-friendly Version Interactive Discussion
Discussion
P
a
per
|
Dis
cussion
P
a
per
|
Discussion
P
a
per
|
Discussio
n
P
a
per
|
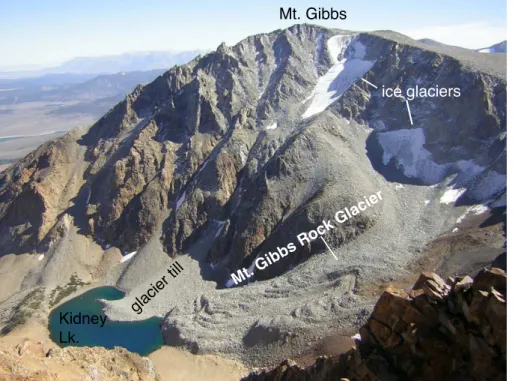
2.2 Mount Gibbs rock glacier
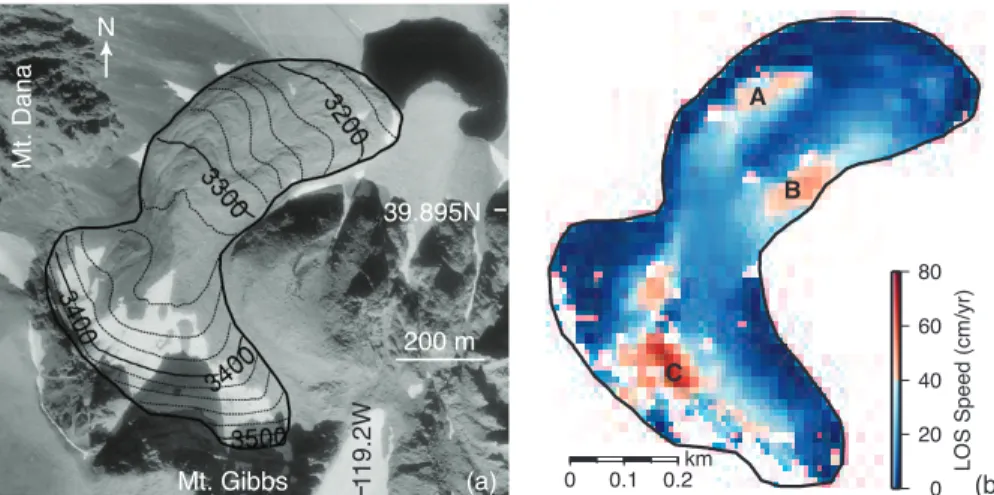
The Mount Gibbs rock glacier is centered at 37◦53′44′′N, 119◦12′13′′W and is located in Gibbs Canyon along the eastern escarpment of the Sierra Nevada. Its ground and aerial photos are shown in Figs. 2 and 4a, respectively. This tongue-shaped rock glacier is approximately 700 m long in its flow direction and 300 m wide. Its geometry suggests 5
that the rock glacier flows downslope initially in a NNE direction and then bends to-ward the NE and ENE. Its head is a bowl-shaped cirque wall surrounded by Mount Gibbs (3893 m a.s.l.) and Mount Dana (3980 m a.s.l.). A small ice glacier is perched in the adjacent and hanging cirque to the east of the rock glacier. Complex meta-volcanic and meta-sedimentary rocks form mountains of this region (Kistler, 1966). 10
The rock glacier surface is covered by angular and poorly-sorted graywackes that are gray-colored meta-sedimentary rocks. Transverse furrows and longitudinal ridges are visible along two lobes in the middle and lower parts. The terminus of the rock glacier is an over-steepened face and forms the southwest shore of Kidney Lake. The till flowing into lake origins from the ice glacier at the peak of Mount Gibbs.
15
We choose the Mount Gibbs rock glacier for a detailed kinematic study due to several reasons. Although it is similar to other active cirque rock glacier in the MW database in elevation and size, the Mount Gibbs rock glacier has a complex geometry and thus an interesting target for mapping surface flow at fine spatial resolution. From the perspec-tive of InSAR processing (see more in Sect. 3.2), this rock glacier is ideal because of 20
its NE flow direction, moderate flow speed, and large debris-covered area. Practically, radar images from two satellite tracks were acquired continuously over this rock glacier (see Sect. 3.1), making a detailed time series study possible.
3 Methods
In this section, we first present technical details of InSAR processing for the case study 25
TCD
7, 343–371, 2013InSAR rock glaciers
Lin Liu et al.
Title Page
Abstract Introduction
Conclusions References
Tables Figures
◭ ◮
◭ ◮
Back Close
Full Screen / Esc
Printer-friendly Version Interactive Discussion
Discussion
P
a
per
|
Dis
cussion
P
a
per
|
Discussion
P
a
per
|
Discussio
n
P
a
per
|
strategy for the regional survey and also list criteria for including an active rock glacier in our inventory in Sect. 3.2.
3.1 InSAR data and processing for case study
For the case study on the Mount Gibbs rock glacier, we apply InSAR processing using a motion-compensation strategy (Zebker et al., 2010) to the Phased Array type L-band 5
Synthetic Aperture Radar (PALSAR) data acquired by the Japanese Advanced Land Observing Satellite (ALOS). By measuring phase differences between two radar im-ages taken at different times, InSAR constructs an interferogram that shows ground surface displacement along the line-of-sight (LOS) direction during the time interval of the two images. To maximize the temporal sampling rates of ground deformation from 10
spring 2007 to spring 2008, we use the PALSAR data acquired along two ascending paths: Path 216/Frame 750 and Path 217/Frame 740. Unfortunately, no descending path PALSAR scenes were acquired by the ALOS satellite over this area. We take spatial average of every two pixels in the azimuth direction on each interferogram to achieve a ground resolution of approximately 10 m by 10 m. Accordingly, we use a 10-15
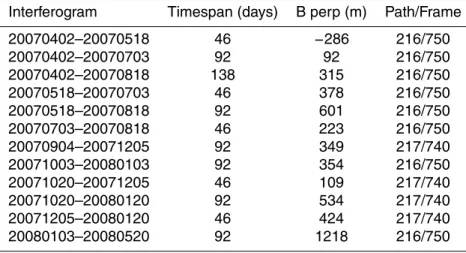
m digital elevation model (DEM) from the USGS National Elevation Database (Gesch et al., 2002) to remove the topographic contribution. We produce a total of 12 inter-ferograms and list them in Table 1. All interinter-ferograms have a short time span as we want to minimize InSAR phase decorrelation due to fast ground motion and to better detect seasonal variability of ground motion. The repeat orbit cycle of the ALOS satel-20
lite limits the shortest time span to 46 days. We use the SNAPHU software (Chen and Zebker, 2002) for phase unwrapping, i.e. reconstructing the absolute phase from the InSAR observable: the 2π modulus of the absolute phase. We also choose a refer-ence point (37◦54′0′N, 119◦11′44′′W) outside the rock glacier where we assume zero displacement.
25
TCD
7, 343–371, 2013InSAR rock glaciers
Lin Liu et al.
Title Page
Abstract Introduction
Conclusions References
Tables Figures
◭ ◮
◭ ◮
Back Close
Full Screen / Esc
Printer-friendly Version Interactive Discussion
Discussion
P
a
per
|
Dis
cussion
P
a
per
|
Discussion
P
a
per
|
Discussio
n
P
a
per
|
determined by two angles: the heading angle of satellite flight path, denoted asα, and the incidence angleθinc(i.e. the angle between the incident radar waves and the direc-tion normal to the ground surface). Along both paths, the heading angles are the same 13.5◦ counter-clockwise from north. Within the rock glacier area, the incidence angles are 37.5◦and 40.3◦ for Paths 216 and 217, respectively. We use the DEM to calculate 5
local slope angleθslpand azimuth angleβand then use the following mapping function to convert the LOS displacement (DLOS) to the downslope displacement (D):
D= DLOS
sin(α−β) sinθinccosθslp+cosθincsinθslp. (1)
For each interferogram, we divide the InSAR-estimated downslope displacement by 10
the time interval and obtain the annual equivalent speed.
We also calculate time series of surface speed at selected high coherence points. From each set of geocoded interferograms grouped according to their paths, we use the small baseline subset inversion method (Berardino et al., 2002) to estimate surface speed during two consecutive acquisition times. We then combine these two sets of 15
speed estimates to obtain a continuous time series from spring 2007 to spring 2008. Because the tropospheric artifacts are uniform within this small area, we do not apply any atmospheric filtering in the time series inversion.
3.2 Inventory mapping using InSAR
For regional mapping, we spot the rock glaciers by a manual inspection. Instead of 20
time series analysis using multiple interferograms, we only construct one interferogram from each ALOS PALSAR frame (roughly 100 km by 70 km). Our study area (Fig. 1) is approximately 240 km by 150 km and is completely covered by five frames: Frames 720, 730, and 740 in Path 216 and Frames 740 and 750 in Path 217. For each frame in Path 216, we construct one interferogram by applying the same InSAR processing 25
TCD
7, 343–371, 2013InSAR rock glaciers
Lin Liu et al.
Title Page
Abstract Introduction
Conclusions References
Tables Figures
◭ ◮
◭ ◮
Back Close
Full Screen / Esc
Printer-friendly Version Interactive Discussion
Discussion
P
a
per
|
Dis
cussion
P
a
per
|
Discussion
P
a
per
|
Discussio
n
P
a
per
|
using the data acquired on 4 September 2007 and 20 October 2007. Figure 3a shows a portion of the Path 216/Frame 730 interferogram as an example that reveals moving rock glaciers standing out from surrounding landforms. For comparison, we also show optical images taken in the summer of 1999 in Fig. 3b–d, in which rock glaciers appear similar to their surroundings.
5
Constrained by the capability of InSAR for mapping small targets in mountain areas, there are a few limitations on the size, flow speed, and location of a rock glacier to be included in our inventory. First, InSAR can only measure surface flow over the debris-covered area where the interferometric coherence is sufficiently high. Decorrelation in interferometry phase is common at the head due to fast motion of glacier ice. Second, 10
the debris-covered area of a rock glacier must be larger than 2 ha to be reliably iden-tified. For instance, the Fig. 3a interferogram barely resolves surface motion over the small rock glacier outlined by the red box in Fig. 3c. Third, at each rock glacier, the displacement component of the total phase must be significantly larger than decorre-lation noise, here assumed 1 cm. For a 46-day-span interferogram, this lower bound 15
on the flow speed is equivalent to 10 cm yr−1. Fourth, we are unable to map any rock glaciers located within the radar shadow and layover zones that facing the radar illumi-nation. In the viewing geometry of ascending frames used in this study, layover zones are on the western slopes and appear as bright stripes (outlined by the dashed white lines in Fig. 3a). Lastly, also limited by the viewing geometry, we are unable to identify 20
any rock glaciers moving parallel to the satellite flight direction using the conventional cross-track InSAR technique. This is likely the reason that the rock glacier outlined by the red box in Fig. 3d appears not moving in the interferogram and thus is excluded in our inventory.
For each identified active rock glacier, out inventory lists the size, flow speed and 25
TCD
7, 343–371, 2013InSAR rock glaciers
Lin Liu et al.
Title Page
Abstract Introduction
Conclusions References
Tables Figures
◭ ◮
◭ ◮
Back Close
Full Screen / Esc
Printer-friendly Version Interactive Discussion
Discussion
P
a
per
|
Dis
cussion
P
a
per
|
Discussion
P
a
per
|
Discussio
n
P
a
per
|
of each active rock glacier, whose area is not always the same as the area of apparently active moraines shown on optical images. Similar to the Mount Gibbs rock glacier study, the InSAR-mapped LOS displacement is converted to downslope displacement using Eq. (1), except that we assume an incidence angle of 38◦and a surface slope of 15◦for all rock glaciers. We use the equivalent annual speed at the center of each rock glacier 5
to represent its kinematic state.
4 Results
4.1 Regional inventory
Our database describes the kinematic states of 59 active rock glaciers in central and southern Sierra Nevada. Their size and surface flow speed in the late summer of 2007 10
are plotted in Fig. 1. We provide the complete inventory in the Supplement, including a Google Earth KMZ file and a spreadsheet of rock glacier location, elevation, size, flow speed and aspect direction. Table 2 summarizes their mean values. The mean flow speed was 55 cm yr−1, with the fastest one moving at 84 cm yr−1 and the slowest one moving at 15 cm yr−1. They have a mean elevation of 3551 m and a mean size 15
of 13 ha. We find no significant correlation between the flow speed and elevation or size of the rock glaciers. Their speeds are of the same order of magnitude as the flow speed of rock glaciers in other regions around the world, such as the European Alps (e.g. Berger et al., 2004; Delaloye et al., 2008, 2010; Lugon and Stoffel, 2010) and the Pyrenees (Serrano et al., 2006), Svalbard (Isaksen et al., 2000), and Wyoming, USA 20
(Potter et al., 1998; Konrad et al., 1999), although none of these mapping efforts is as extensive and inclusive as this study.
Our complete regional survey reveals several important spatial patterns of rock glacier kinematics in the Sierra Nevada. Active rock glaciers tend to cluster to each other, implying a significant influence of regional conditions such as climate and topog-25
TCD
7, 343–371, 2013InSAR rock glaciers
Lin Liu et al.
Title Page
Abstract Introduction
Conclusions References
Tables Figures
◭ ◮
◭ ◮
Back Close
Full Screen / Esc
Printer-friendly Version Interactive Discussion
Discussion
P
a
per
|
Dis
cussion
P
a
per
|
Discussion
P
a
per
|
Discussio
n
P
a
per
|
Lake where elevation is lower than 3000 m. Rock glaciers in the southern Sierra Nevada moved at a mean speed of 57 cm yr−1, faster than the ones in the central Sierra Nevada whose mean speed was 39 cm yr−1. This di
fference is largely due to the fact that the southern rock glaciers are higher in elevation and deeper in cirques. Another spatial contrast is that rock glacier speeds were less uniform in the southern area than in 5
the central Sierra Nevada. Within some valleys in the southern area, such as the ones shown in Fig. 3, we observe a significant spatial variation in kinematic behaviors. It sug-gests strong influences of local physical factors such as slope, thickness, ice content, and hydrological conditions on surface speed.
We compare our inventory with the MW database in terms of rock glacier classes 10
and locations. All of our identified active features fall into the cirque rock glacier class defined by Millar and Westfall (2008). However, only 14 (or 24 %) of them are collocated with the “active” ones in the MW database. Millar and Westfall (2008) used the term “active” based on the geomorphological and hydrological features, which may not all be actively moving. Our mapping method using InSAR is a direct measurement of surface 15
flow motion and thus ensures that the identified targets are moving at a minimum speed of 10 cm yr−1. In addition, 16 “active” cirque rock glaciers in the MW database are not included in our inventory because they are smaller than 2 ha. We exclude 12 of MW’s “active” rock glaciers, for instance, 7 in the Piute Pass Glacier divide (37.23◦N, 118.75◦W), because they are either in the radar shadow zones or almost completely 20
covered by ice. However, on the positive side, our inventory includes 44 active rock glaciers that not identified in the MW database from field work. For instance, within the region of Fig. 3, the MW database only includes one rock glacier (i.e. the South Fork rock glacier as shown in Fig. 3b). Overall, we conclude that our inventory based on InSAR and the MW database are complementary to each other; and together they 25
TCD
7, 343–371, 2013InSAR rock glaciers
Lin Liu et al.
Title Page
Abstract Introduction
Conclusions References
Tables Figures
◭ ◮
◭ ◮
Back Close
Full Screen / Esc
Printer-friendly Version Interactive Discussion
Discussion
P
a
per
|
Dis
cussion
P
a
per
|
Discussion
P
a
per
|
Discussio
n
P
a
per
|
4.2 Surface flow of the Mount Gibbs rock glacier
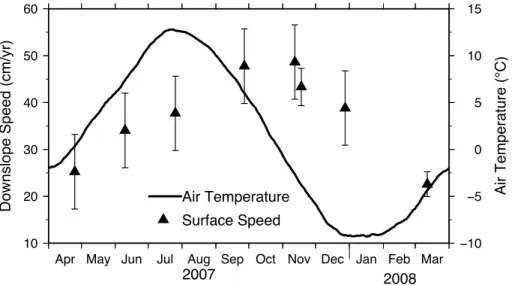
In this subsection, we present the InSAR results on the surface flow at the Mount Gibbs rock glacier. We first show the spatial variability that is correlated with surface geomor-phological features. We then provide a time series of surface flow speed showing its seasonal variation and its delay behind air temperature. Such a seasonal variability has 5
not been observed previously using remote sensing methods.
On individual targets, InSAR provides a more spatially complete assessment of the surface flow than field measurements. Figure 4b shows the InSAR LOS speed over the Mount Gibbs rock glacier between 4 September 2007 and 5 December 2007. It clearly maps out two rapidly-flowing lobes (centered at “A” and “B”) at speeds of∼50 cm yr−1 10
starting from the middle section of the rock glacier. Along both lobes, InSAR LOS speed decreases towards the rock glacier snout. Such gradients in speed correlates well with surface ridges and furrows and suggest that these are geomorphological fea-tures caused by longitudinal compression. Figure 4b also shows rapid surface motion (>60 cm yr−1) near the head of the rock glacier (centered at “C”), although we cannot 15
distinguish if this is motion of the glacier ice or rock debris. This InSAR map also re-veals stable areas such as the southeast flank and the depression area between the two flowing branches. Other InSAR maps using different interferograms show a similar pattern but vary in magnitude.
Figure 5 shows a time series of surface speed at the marker “A” in Fig. 4b. Each 20
triangle shows the mean downslope speed during the two consecutive PALSAR im-ages in the same path, with the error bar showing the 1-σuncertainty. The time series shows that the surface flow was slow in the spring, gradually increased throughout the summer, peaked in the fall at 48 cm yr−1, and then abruptly slowed in the winter, reaching to the minimum of 22 cm yr−1in the following spring. This seasonal variation 25
TCD
7, 343–371, 2013InSAR rock glaciers
Lin Liu et al.
Title Page
Abstract Introduction
Conclusions References
Tables Figures
◭ ◮
◭ ◮
Back Close
Full Screen / Esc
Printer-friendly Version Interactive Discussion
Discussion
P
a
per
|
Dis
cussion
P
a
per
|
Discussion
P
a
per
|
Discussio
n
P
a
per
|
and a temperature lapse rate of−6.5◦C km−1(Lundquist and Cayan, 2007; Millar and Westfall, 2008) to account for the elevation difference. This estimated temperature is consistent with the field measurements (Millar et al., 2012) and the Parameter-elevation Regressions on Independent Slopes Model (PRISM) outputs (Daly et al., 1994).
5 Discussion
5
5.1 Strengths and weaknesses of InSAR-based rock glacier inventory
We have demonstrated that InSAR provides quantitative information on the surface flow of rock glaciers in a spatial scale of a major mountain range. The InSAR survey is unique: it quantifies rock glacier speed, which is difficult to measure in the field. Inventory mapping using InSAR is also more complete than optical studies that are 10
limited by cloud covers. The InSAR survey is valuable: it reveals spatial patterns of rock glacier kinematics and provides benchmark information for studying the relationship between regional and local forcing conditions and rock glacier speed and for long-term monitoring efforts.
However, our InSAR-based inventory is still incomplete. Explained in Sect. 3.2, our 15
inventory only includes rock glaciers that are larger than 2 ha, moving faster than 10 cm yr−1, flowing non-parallel to the satellite flight direction, and located outside radar layover (western slopes) or shadow zones. The lower bound on flow speed could be relaxed using interferograms spanning longer periods, provided that good coherence is maintained. The location constraints are not severe in the Sierra Nevada because 20
most active rock glaciers are located on the eastern (leeward) slopes, where snow pre-cipitation is substantially less than the western slopes. Realistically, in the Mount Gibbs rock glacier case, we find that snow cover in winters has little impact on the InSAR measurements, as the L-band radar waves can easily penetrate through thin and dry snow.
TCD
7, 343–371, 2013InSAR rock glaciers
Lin Liu et al.
Title Page
Abstract Introduction
Conclusions References
Tables Figures
◭ ◮
◭ ◮
Back Close
Full Screen / Esc
Printer-friendly Version Interactive Discussion
Discussion
P
a
per
|
Dis
cussion
P
a
per
|
Discussion
P
a
per
|
Discussio
n
P
a
per
|
Our InSAR-based flow speed estimates are not free of errors. Deformation signals in one interferogram are contaminated by decorrelation noises, atmospheric artifacts, and DEM errors. However, these errors are not correlated in time could be reduced using multiple interferograms. We may also over-estimate the annul rock glacier speeds by using late-summer interferograms, as the case study on the Mount Gibbs rock glacier 5
suggests that the annual speed is likely smaller than the late-summer speed. Moreover, we introduce errors by assuming the same surface slope angle for all rock glaciers to simply the conversion from the InSAR LOS speed to downslope speed. This could be improved by carefully retrieving slopes from high-resolution DEM data.
5.2 Causes of seasonal variation in flow speed
10
According to the InSAR observations at the Mount Gibbs rock glacier (Fig. 5), seasonal variation of surface flow speed is significant, more than double from the minimum in the spring to the maximum in the fall. Our study adds one more finding to the few observations on seasonal variation of rock glacier speed (Haeberli, 1985; Arenson et al., 2002; K ¨a ¨ab et al., 2007; Perruchoud and Delaloye, 2007; Ikeda et al., 2008). Both 15
the magnitude and the temporal delay of seasonal variability behind air temperature are comparable with the ground-based measurements at the Muragl (Arenson et al., 2002) and the Becs-de-Bosson rock glaciers (Perruchoud and Delaloye, 2007) in the Swiss Alps.
The exact cause(s) of the speed seasonal variations at the Mount Gibbs rock glacier 20
is unclear. It might be partly due to the changes of rock glacier mechanical strength and rheology with ground temperature. We model the thermal diffusion of ground warm-ing and the increase of the creep parameter of rock glacier materials uswarm-ing the same method of K ¨a ¨ab et al. (2007). Similar to K ¨a ¨ab et al.’s results, we find that the modeled seasonal variation in surface speed is approximately 5 % of the annual mean value, 25
TCD
7, 343–371, 2013InSAR rock glaciers
Lin Liu et al.
Title Page
Abstract Introduction
Conclusions References
Tables Figures
◭ ◮
◭ ◮
Back Close
Full Screen / Esc
Printer-friendly Version Interactive Discussion
Discussion
P
a
per
|
Dis
cussion
P
a
per
|
Discussion
P
a
per
|
Discussio
n
P
a
per
|
Other possible mechanisms for seasonal variations include internal melting, basal sliding, and winter snow cover. Field investigations and water temperature measure-ments in the rock glacier talus outlet springs suggest persistent flow of water through-out the year (Millar et al., 2012). It takes time for temperature rising at depth to melt internal ice and for sufficient water to accumulate at the bottom of the rock glacier to 5
act as a lubricant for basal sliding. Nonetheless, only a few studies have discussed the idea of basal sliding (Haeberli, 1985; Whalley and Martin, 1992) and it is unclear how commonly this mechanism occurs under rock glaciers. Ikeda et al. (2008) pro-posed that snowmelt water could infiltrate into the frozen debris and modulate surface motion of rock glaciers. However, their model predicts an increase in surface speed in 10
early summer (May and June), different from our observations at the Mount Gibbs rock glacier. The delay of seasonal minimum speed that occurred in spring is likely caused by the refreezing of pore water and the winter snow cover, which insulates the ground from cold air and thus maintains surface speed. Modeling these mechanical and hy-drological effects on rock glacier motion and its seasonal variation is a subject of future 15
work.
5.3 Response of rock glaciers to climate warming: perspectives from InSAR
The kinematic response of rock glaciers to climate warming is contentious. The annual temperature in the Sierra Nevada is projected to rise by 2 to 4◦C by the end of the 21st century (Maurer, 2007). However, it is unclear whether rock glaciers will speed up due 20
to accelerated degradation and melting and higher erosion rates (Gruber and Haeberli, 2007) or remain stable due to thermal insulation by the protective rock debris matrix (Clark et al., 1994; Barsch, 1996; Millar et al., 2012) and the local cooling effects caused by air circulation within rock matrix (Juliussen and Humlum, 2008; Leopold et al., 2011). Flow speed of some rock glaciers in the European Alps have accelerated in the last two 25
TCD
7, 343–371, 2013InSAR rock glaciers
Lin Liu et al.
Title Page
Abstract Introduction
Conclusions References
Tables Figures
◭ ◮
◭ ◮
Back Close
Full Screen / Esc
Printer-friendly Version Interactive Discussion
Discussion
P
a
per
|
Dis
cussion
P
a
per
|
Discussion
P
a
per
|
Discussio
n
P
a
per
|
longer than 30 yrs show no significant changes in rock glacier speed (Potter et al., 1998; Janke, 2005).
Practically, the ALOS PALSAR data are too short for monitoring long-terms changes in rock glacier flow as the satellite was in operation for only five years from late 2006 to early 2011. Nonetheless, our study strongly suggests the necessity of consider-5
ing possible aliasing due to seasonal variation when estimating long-term changes in flow speed. Possible inter-annual variation in surface flow, which has been observed in the European Alps (N ¨oetzli and Vonder M ¨uehll, 2010), further complicates the esti-mate of long-term trends. In general, it requires a long time series with high temporal sampling rates to separate possible long-term changes in rock glacier kinematics from 10
seasonal and inter-annual variability. Other satellites such as ERS-1/2 and Envisat ac-quired longer time series of SAR data that are of potential for investigating response of rock glaciers in the Sierra Nevada to climate changes in the last two decades. The major challenge of using C-band data for rock glacier studies, however, is the prob-lem of InSAR phase decorrelation due to fast surface flow. We suggest a strategy to 15
form a long time series of interferograms that have short time spans (e.g. 35 days for ERS-1/2). The ERS-1/2 tandem (1-day intervals) and ice-phase (3-day intervals) data that are commonly used for ice glacier studies may not be useful because rock glacier motion within one day is of the order of 1 mm, too small to be reliably detected by In-SAR. A few recently launched and future InSAR missions such as the TerraSAR-X, the 20
Cosmo-Skymed, and the Sentinel Satellites will continue the observation period and provide denser temporal sampling rates (e.g. 11 days of TerraSAR-X) for monitoring rock glaciers.
6 Conclusions
In summary, we use InSAR data to compile an inventory of the flow speed, direction, 25
TCD
7, 343–371, 2013InSAR rock glaciers
Lin Liu et al.
Title Page
Abstract Introduction
Conclusions References
Tables Figures
◭ ◮
◭ ◮
Back Close
Full Screen / Esc
Printer-friendly Version Interactive Discussion
Discussion
P
a
per
|
Dis
cussion
P
a
per
|
Discussion
P
a
per
|
Discussio
n
P
a
per
|
glaciers in the Southern Sierra Nevada moved faster than those in the central area. Our regional-scale InSAR study provides important baseline map of the kinematic states and useful guidance for field investigations and will be valuable for assessing the rela-tionship of rock glaciers flow with regional climate and local conditions.
We also conduct a detailed InSAR study to map the surface flow of the Mount Gibbs 5
rock glacier. We find two fast-moving branches in the lower part of the rock glacier, collocated with surface flow lines. More interestingly, we observe a significant seasonal variability of surface speed, more than double in the fall from its minimum in the spring. Our findings suggest the necessity of a long time series with dense sampling to sep-arate long-terms changes in rock glacier kinematics associated with climate change 10
from seasonal variations.
Supplementary material related to this article is available online at:
http://www.the-cryosphere-discuss.net/7/343/2013/tcd-7-343-2013-supplement. zip.
Acknowledgements. The ALOS PALSAR data are copyrighted by the Japan Aerospace
Ex-15
ploration Agency and provided by the Alaska Satellite Facility, University of Alaska Fairbanks. Climatic data at Lee Vining, CA are provided by the Western Regional Climate Center, NOAA. This research was supported primarily by the George Thompson Postdoctoral Fellowship to Lin Liu from the Department of Geophysics, Stanford University. Matlab and Generic Mapping Tools (Wessel and Smith, 1998) were used to make the figures.
20
References
TCD
7, 343–371, 2013InSAR rock glaciers
Lin Liu et al.
Title Page
Abstract Introduction
Conclusions References
Tables Figures
◭ ◮
◭ ◮
Back Close
Full Screen / Esc
Printer-friendly Version Interactive Discussion
Discussion
P
a
per
|
Dis
cussion
P
a
per
|
Discussion
P
a
per
|
Discussio
n
P
a
per
|
Avian, M., Kellerer-Pirklbauer, A., and Bauer, A.: LiDAR for monitoring mass movements in permafrost environments at the cirque Hinteres Langtal, Austria, between 2000 and 2008, Nat. Hazards Earth Syst. Sci., 9, 1087–1094, doi:10.5194/nhess-9-1087-2009, 2009. 345 Barsch, D.: Nature and importance of mass-wasting by rock glaciers in alpine permafrost
envi-ronments, Earth Surf. Processes, 2, 231–245, doi:10.1002/esp.3290020213, 1977. 344
5
Barsch, D.: Rockglaciers: Indicators for the Present and Former Geoecology in High Mountain Environments, Springer, Berlin, 1996. 345, 357
Berardino, P., Fornaro, G., Lanari, R., and Sansosti, E.: A new algorithm for surface deformation monitoring based on small baseline differential SAR interferograms, IEEE T. Geosci. Remote, 40, 2375–2383, doi:10.1109/TGRS.2002.803792, 2002. 350
10
Berger, J., Krainer, K., and Mostler, W.: Dynamics of an active rock glacier ( ¨Otztal Alps, Austria), Quaternary Res., 62, 233–242, doi:10.1016/j.yqres.2004.07.002, 2004. 352
Berthling, I., Etzelm ¨uller, B., Eiken, T., and Sollid, J. L.: Rock glaciers on Prins Karls For-land, Svalbard. I: internal structure, flow velocity and morphology, Permafrost Periglac., 9, 135–145, doi:10.1002/(SICI)1099-1530(199804/06)9:2<135::AID-PPP284>3.0.CO;2-R,
15
1998. 345
Bodin, X., Thibert, E., Fabre, D., Ribolini, A., Schoeneich, P., Francou, B., Reynaud, L., and Fort, M.: Two decades of responses (1986–2006) to climate by the Laurichard rock glacier, French Alps, Permafrost Periglac., 20, 331–344, doi:10.1002/ppp.665, 2009. 357
Brenning, A.: Geomorphological, hydrological and climatic significance of rock glaciers in the
20
Andes of Central Chile (33–35◦S), Permafrost Periglac., 16, 231–240, doi:10.1002/ppp.528,
2005. 344, 345
Burger, K. C., Degenhardt Jr., J. J., and Giardino, J. R.: Engineering geomorphology of rock glaciers, Geomorphology, 31, 93–132, doi:10.1016/S0169-555X(99)00074-4, 1999. 345 Chen, C. and Zebker, H.: Phase unwrapping for large SAR interferograms: statistical
seg-25
mentation and generalized network models, IEEE T. Geosci. Remote, 40, 1709–1719, doi:10.1109/TGRS.2002.802453, 2002. 349
Clark, D. H. and Gillespie, A. R.: Timing and significance of Late-glacial and Holocene cirque glaciation in the Sierra Nevada, California, Quatern. Int., 38–39, 21–38, doi:10.1016/S1040-6182(96)00024-9, 1997. 347
30
TCD
7, 343–371, 2013InSAR rock glaciers
Lin Liu et al.
Title Page
Abstract Introduction
Conclusions References
Tables Figures
◭ ◮
◭ ◮
Back Close
Full Screen / Esc
Printer-friendly Version Interactive Discussion
Discussion
P
a
per
|
Dis
cussion
P
a
per
|
Discussion
P
a
per
|
Discussio
n
P
a
per
|
Croce, F. A. and Milana, J. P.: Internal structure and behaviour of a rock glacier in the Arid Andes of Argentina, Permafrost Periglac., 13, 289–299, doi:10.1002/ppp.431, 2002. 345 Daly, C., Neilson, R. P., and Phillips, D. L.: A statistical-topographic model for mapping
climatological precipitation over mountainous terrain, J. Appl. Meteorol., 33, 140–158, doi:10.1175/1520-0450(1994)033<0140:ASTMFM>2.0.CO;2, 1994. 355
5
Degenhardt Jr., J. J.: Development of tongue-shaped and multilobate rock glaciers in alpine environments – interpretations from ground penetrating radar surveys, Geomorphology, 109, 94–107, doi:10.1016/j.geomorph.2009.02.020, 2009. 344
Delaloye, R., Perruchoud, E., Avian, M., Kaufmann, V., Bodin, X., Hausmann, H., Ikeda, A., K ¨a ¨ab, A., Kellerer-Pirklbauer, A., Krainer, K., et al.: Recent Interannual variations of
rock-10
glaciers creep in the European Alps, in: Proceedings of the 9th International Conference on Permafrost, Fairbanks, Alaska, 2008. 345, 352, 357
Delaloye, R., Lambiel, C., and G ¨artner-Roer, I.: Overview of rock glacier kinematics research in the Swiss Alps: seasonal rhythm, interannual variations and trends over several decades, Geogr. Helv., 65, 135–145, 2010. 346, 352
15
Gesch, D., Oimoen, M., Greenlee, S., Nelson, C., Steuck, M., and Tyler, D.: The national eleva-tion dataset, Photogramm. Eng. Rem. S., 68, 5–11, 2002. 349
Gruber, S. and Haeberli, W.: Permafrost in steep bedrock slopes and its temperature-related destabilization following climate change, J. Geophys. Res., 112, F02S18, doi:10.1029/2006JF000547, 2007. 357
20
Haeberli, W.: Creep of mountain permafrost: internal structure and flow of alpine rock glaciers, Mit. Vers. Was., 77, 5–142, 1985. 356, 357
Haeberli, W., K ¨a ¨ab, A., Wagner, S., M ¨uhll, D., Geissler, P., Haas, J., Glatzel-Mattheier, H., and Wagenbach, D.: Pollen analysis and14C age of moss remains in a permafrost core recovered from the active rock glacier Murt `el-Corvatsch, Swiss Alps: geomorphological and
glaciologi-25
cal implications, J. Glaciol., 45, 1–8, 1999. 345
Harrison, S., Whalley, B., and Anderson, E.: Relict rock glaciers and protalus lobes in the British Isles: implications for Late Pleistocene mountain geomorphology and palaeoclimate, J. Qua-ternary Sci., 23, 287–304, doi:10.1002/jqs.1148, 2008. 345
Humlum, O.: The climatic significance of rock glaciers, Permafrost Periglac., 9, 375–395,
30
TCD
7, 343–371, 2013InSAR rock glaciers
Lin Liu et al.
Title Page
Abstract Introduction
Conclusions References
Tables Figures
◭ ◮
◭ ◮
Back Close
Full Screen / Esc
Printer-friendly Version Interactive Discussion
Discussion
P
a
per
|
Dis
cussion
P
a
per
|
Discussion
P
a
per
|
Discussio
n
P
a
per
|
Humlum, O.: The geomorphic significance of rock glaciers: estimates of rock glacier debris volumes and headwall recession rates in West Greenland, Geomorphology, 35, 41–67, doi:10.1016/S0169-555X(00)00022-2, 2000. 344
Ikeda, A., Matsuoka, N., and K ¨a ¨ab, A.: Fast deformation of perennially frozen debris in a warm rock glacier in the Swiss Alps: an effect of liquid water, J. Geophys. Res., 113, F01021,
5
doi:10.1029/2007JF000859, 2008. 356, 357
Isaksen, K., Ødeg ˚ard, R. S., Eiken, T., and Sollid, J. L.: Composition, flow and development of two tongue-shaped rock glaciers in the permafrost of Svalbard, Permafrost Periglac., 11, 241–257, doi:10.1002/1099-1530(200007/09)11:3<241::AID-PPP358>3.0.CO;2-A, 2000. 352
10
Janke, J.: Long-term flow measurements (1961–2002) of the Arapaho, Taylor, and Fair rock glaciers, Front Range, Colorado, Phys. Geogr., 26, 313–336, doi:10.2747/0272-3646.26.4.313, 2005. 358
Juliussen, H. and Humlum, O.: Thermal regime of openwork block fields on the moun-tains Elg ˚ahogna and Sølen, central-eastern Norway, Permafrost Periglac., 19, 1–18,
15
doi:10.1002/ppp.607, 2008. 357
K ¨a ¨ab, A.: Monitoring high-mountain terrain deformation from repeated air- and spaceborne optical data: examples using digital aerial imagery and ASTER data, ISPRS J. Photogramm., 57, 39–52, doi:10.1016/S0924-2716(02)00114-4, 2002. 345
K ¨a ¨ab, A., Haeberli, W., and Gudmundsson, G. H.: Analysing the creep of mountain
per-20
mafrost using high precision aerial photogrammetry: 25 years of monitoring Gruben rock glacier, Swiss Alps, Permafrost Periglac., 8, 409–426, doi:10.1002/(SICI)1099-1530(199710/12)8:4<409::AID-PPP267>3.0.CO;2-C, 1997. 345, 357
K ¨a ¨ab, A., Frauenfelder, R., and Roer, I.: On the response of rockglacier creep to surface temper-ature increase, Global Planet. Change, 56, 172–187, doi:10.1016/j.gloplacha.2006.07.005,
25
2007. 356
Kenyi, L. and Kaufmann, V.: Estimation of rock glacier surface deformation using SAR inter-ferometry data, IEEE T. Geosci. Remote, 41, 1512–1515, doi:10.1109/TGRS.2003.811996, 2003. 346
Kistler, R. W.: Geologic map of the Mono Craters quadrangle, Mono and Tuolumne counties,
30
California, Map GQ-462, Tech. rep., US Geological Survey, 1966. 348
TCD
7, 343–371, 2013InSAR rock glaciers
Lin Liu et al.
Title Page
Abstract Introduction
Conclusions References
Tables Figures
◭ ◮
◭ ◮
Back Close
Full Screen / Esc
Printer-friendly Version Interactive Discussion
Discussion
P
a
per
|
Dis
cussion
P
a
per
|
Discussion
P
a
per
|
Discussio
n
P
a
per
|
Krainer, K. and Mostler, W.: Reichenkar rock glacier: a glacier derived debris-ice system in the western Stubai Alps, Austria, Permafrost Periglac., 11, 267–275, doi:10.1002/1099-1530(200007/09)11:3<267::AID-PPP350>3.0.CO;2-E, 2000. 345, 357
Lambiel, C. and Delaloye, R.: Contribution of real-time kinematic GPS in the study of creeping mountain permafrost: examples from the Western Swiss Alps, Permafrost Periglac., 15, 229–
5
241, doi:10.1002/ppp.496, 2004. 345
Leopold, M., Williams, M., Caine, N., V ¨olkel, J., and Dethier, D.: Internal structure of the Green Lake 5 rock glacier, Colorado Front Range, USA, Permafrost Periglac., 22, 107–119, doi:10.1002/ppp.706, 2011. 357
Lugon, R. and Stoffel, M.: Rock-glacier dynamics and magnitude-frequency relations of debris
10
flows in a high-elevation watershed: Ritigraben, Swiss Alps, Glob. Planet. Change, 73, 202– 210, doi:10.1016/j.gloplacha.2010.06.004, 2010. 352
Lundquist, J. D. and Cayan, D. R.: Surface temperature patterns in complex terrain: daily varia-tions and long-term change in the central Sierra Nevada, California, J. Geophys. Res., 112, D11124, doi:10.1029/2006JD007561, 2007. 355
15
Maurer, E.: Uncertainty in hydrologic impacts of climate change in the Sierra Nevada, California, under two emissions scenarios, Climatic Change, 82, 309–325, doi:10.1007/s10584-006-9180-9, 2007. 357
Millar, C. I. and Westfall, R. D.: Rock glaciers and related periglacial landforms in the Sierra Nevada, CA, USA; inventory, distribution and climatic relationships, Quatern. Int., 188, 90–
20
104, doi:10.1016/j.quaint.2007.06.004, available at: http://nsidc.org/data/ggd652.html, 2008. 346, 347, 353, 355, 366
Millar, C. I., Westfall, R. D., and Delany, D. L.: Thermal and hydrologic attributes of rock glaciers and periglacial talus landforms, Sierra Nevada, California, USA, Quatern. Int., doi:10.1016/j.quaint.2012.07.019, in press, 2012. 345, 355, 357
25
Nagler, T., Mayer, C., and Rott, H.: Feasibility of DINSAR for mapping complex motion fields of alpine ice- and rock-glaciers, in: Retrieval of Bio- and Geo-Physical Parameters from SAR Data for Land Applications, edited by: Wilson, A. and Quegan, S., Vol. 475 of ESA Special Publication, 377–382, 2002. 346
N ¨oetzli, J. and Vonder M ¨uehll, D. (Eds.): Permafrost in Switzerland 2006/2007 and 2007/2008,
30
TCD
7, 343–371, 2013InSAR rock glaciers
Lin Liu et al.
Title Page
Abstract Introduction
Conclusions References
Tables Figures
◭ ◮
◭ ◮
Back Close
Full Screen / Esc
Printer-friendly Version Interactive Discussion
Discussion
P
a
per
|
Dis
cussion
P
a
per
|
Discussion
P
a
per
|
Discussio
n
P
a
per
|
Perruchoud, E. and Delaloye, R.: Short-term changes in surface velocities on the Becs-de-Bosson rock glacier (western Swiss Alps), in: Proceedings of the 9th International Sympo-sium on High Mountain Remote Sensing Cartography (HMRSC-IX), vol. 43, 14–15, 2007. 356
Potter, N. J., Steig, E. J., Clark, D. H., Speece, M. A., Clark, G. M., and Updike, A. B.: Galena
5
Creek rock glacier revisited: new observations on an old controversy, Geogr. Ann. A, 80, 251–265, 1998. 352, 358
Rignot, E., Hallet, B., and Fountain, A.: Rock glacier surface motion in Beacon Valley, Antarctica, from synthetic-aperture radar interferometry, Geophys. Res. Lett., 29, 1607, doi:10.1029/2001GL013494, 2002. 346
10
Rott, H. and Siegel, A.: Analysis of mass movements in alpine terrain by means of SAR interfer-ometry, in: Geoscience and Remote Sensing Symposium, 1999, IGARSS ’99 Proceedings, IEEE 1999 International, vol. 4, 1933–1936, doi:10.1109/IGARSS.1999.774991, 1999. 346 Serrano, E., San Jose, J., and Agudo, C.: Rock glacier dynamics in a marginal periglacial
high mountain environment: flow, movement (1991–2000) and structure of the Argualas rock
15
glacier, the Pyrenees, Geomorphology, 74, 285–296, doi:10.1016/j.geomorph.2005.08.014, 2006. 352
Strozzi, T., K ¨a ¨ab, A., and Frauenfelder, R.: Detecting and quantifying mountain permafrost creep from in situ inventory, space-borne radar interferometry and airborne digital pho-togrammetry, Int. J. Remote Sens., 25, 2919–2931, doi:10.1080/0143116042000192330,
20
2004. 346
Wagner, S.: Creep of alpine permafrost, investigated on the murtel rock glacier, Permafrost Periglac., 3, 157–162, doi:10.1002/ppp.3430030214, 1992. 356
Wahrhaftig, C. and Cox, A.: Rock glaciers in the Alaska range, Geol. Soc. Am. Bull., 70, 383– 436, 1959. 345
25
Wessel, P. and Smith, W. H. F.: New, improved version of generic mapping tools released, EOS T. Am. Geophys. Un., 79, 579–579, doi:10.1029/98EO00426, 1998. 359
Whalley, W. B. and Martin, H. E.: Rock glaciers: II Models and mechanisms, Prog. Phys. Geogr., 16, 127–186, 1992. 357
Zebker, H., Hensley, S., Shanker, P., and Wortham, C.: Geodetically Accurate InSAR Data
Pro-30
TCD
7, 343–371, 2013InSAR rock glaciers
Lin Liu et al.
Title Page
Abstract Introduction
Conclusions References
Tables Figures
◭ ◮
◭ ◮
Back Close
Full Screen / Esc
Printer-friendly Version Interactive Discussion
Discussion
P
a
per
|
Dis
cussion
P
a
per
|
Discussion
P
a
per
|
Discussio
n
P
a
per
|
Table 1.Interferograms made from the case study on the Mount Gibbs rock glacier. Names of interferograms are in the format “yyyymmdd–yyyymmdd”, after the dates of the two SAR scenes used. Column “B perp” lists the perpendicular baselines of the interferograms.
Interferogram Timespan (days) B perp (m) Path/Frame
20070402–20070518 46 −286 216/750
TCD
7, 343–371, 2013InSAR rock glaciers
Lin Liu et al.
Title Page
Abstract Introduction
Conclusions References
Tables Figures
◭ ◮
◭ ◮
Back Close
Full Screen / Esc
Printer-friendly Version Interactive Discussion
Discussion
P
a
per
|
Dis
cussion
P
a
per
|
Discussion
P
a
per
|
Discussio
n
P
a
per
|
Table 2.Summary of the active rock glaciers in the Sierra Nevada based on InSAR and com-parisons with the “active” cirque rock glaciers in the Millar and Westfall (2008) (MW) database. The term “active” used by the MW database is based on the geomorphological and hydrological features.
InSAR MW
Number 59 67
Mean elevation (m) 3551 3390 Elevation range (m) 3077–3787 2673–3901 Mean size (ha) 13 20
Size range (ha) 3–46 N/A Mean length (m) 624 N/A Mean width (m) 201 N/A Mean length-to-width ratio 3.3 N/A Mean flow speed (cm yr−1) 55 N/A
TCD
7, 343–371, 2013InSAR rock glaciers
Lin Liu et al.
Title Page
Abstract Introduction
Conclusions References
Tables Figures
◭ ◮
◭ ◮
Back Close
Full Screen / Esc
Printer-friendly Version Interactive Discussion
Discussion
P
a
per
|
Dis
cussion
P
a
per
|
Discussion
P
a
per
|
Discussio
n
P
a
per
|
−119˚30' −119˚00' −118˚30' −118˚00' 36˚30'
37˚00' 37˚30' 38˚00' 38˚30'
0 10 20km
CALIFORNIANEVADA
YOSEMITE NP
MGRC
Fig. 3
Mono Lake
Bishop Mammoth Lakes
Lee Vining
Lone Pine Bridgeport
Size (ha) 5 15 30 45
10 30 50 70 90
Speed (cm/yr)
TCD
7, 343–371, 2013InSAR rock glaciers
Lin Liu et al.
Title Page
Abstract Introduction
Conclusions References
Tables Figures
◭ ◮
◭ ◮
Back Close
Full Screen / Esc
Printer-friendly Version Interactive Discussion
Discussion
P
a
per
|
Dis
cussion
P
a
per
|
Discussion
P
a
per
|
Discussio
n
P
a
per
|
Mt. Gibbs
Kidney Lk.
ice glaciers
glacier till
Mt. Gibbs Rock Glacier
TCD
7, 343–371, 2013InSAR rock glaciers
Lin Liu et al.
Title Page
Abstract Introduction
Conclusions References
Tables Figures
◭ ◮
◭ ◮
Back Close
Full Screen / Esc
Printer-friendly Version Interactive Discussion
Discussion
P
a
per
|
Dis
cussion
P
a
per
|
Discussion
P
a
per
|
Discussio
n
P
a
per
|
(a)
(d) (c) (b)
(d) (c)
(b)
500 m N
500 m
0 12 cm
Rock Glaciers
Layover Zones
Fl igh t
LOS
TCD
7, 343–371, 2013InSAR rock glaciers
Lin Liu et al.
Title Page
Abstract Introduction
Conclusions References
Tables Figures
◭ ◮
◭ ◮
Back Close
Full Screen / Esc
Printer-friendly Version Interactive Discussion
Discussion
P
a
per
|
Dis
cussion
P
a
per
|
Discussion
P
a
per
|
Discussio
n
P
a
per
|
Mt. Dana
Mt. Dana
N
Mt. Gibbs 119.2W
39.895N
200 m
(a) 0
20 40 60 80
LOS Speed (cm/yr)
A
B
C
0 0.1 0.2 km
(b)
TCD
7, 343–371, 2013InSAR rock glaciers
Lin Liu et al.
Title Page
Abstract Introduction
Conclusions References
Tables Figures
◭ ◮
◭ ◮
Back Close
Full Screen / Esc
Printer-friendly Version Interactive Discussion
Discussion
P
a
per
|
Dis
cussion
P
a
per
|
Discussion
P
a
per
|
Discussio
n
P
a
per
|
10 20 30 40 50 60
Downslope Speed (cm/yr)
Apr May Jun Jul Aug Sep Oct Nov Dec Jan Feb Mar
2007
−10 −5 0 5 10 15
Air Temperature (°C)
2008 Surface Speed
Air Temperature
Fig. 5. Time series of the estimated air temperature (solid line) and the InSAR-measured downslope speed (triangles) at the marker “A” shown in Fig. 4b. The error bars are the 1-σ