Evaluation of mandibular range of
motion in Brazilian children and its
correlation to age, height, weight, and
gender
Abstract: This study aimed to measure the active mandibular range of motion (ROM) (mouth opening: MO; right and left lateral movements: RL and LL; protrusion: P) in Brazilian children of both genders and of various ages, weights, and heights, and to establish correlations among such variables. Study subjects (n = 303) were healthy boys and girls, with ages ranging between 6 and 14 years, who were regular students of a pub-lic school in the state of São Paulo. Analysis of variance and intra-class correlation coeficients were considered signiicant for p < 0.05. Weak signiicant correlations were observed between mandibular ROM and age, height, and weight. No statistically signiicant differences (p > 0.05) were observed regarding mandibular ROM between gender groups. Mean mandibular ROM values showed signiicant increases (p < 0.05) in relation to age, height, and weight, except for RL (p > 0.05), in the studied age range. Signiicantly smaller (p < 0.05) mean mandibular ROM values were observed for the intervals of 6 and 7 years of age, 1.15-1.35 m, and 17.30-26.50 kg, in relation to the other ranges. Nonetheless, no differences were observed among mean mandibular ROM values in the ranges 8 to 12-14 years, 1.36-1.75 m, and 47-85 kg. Thus, it is sug-gested that weight, height, and age variables be considered when obtain-ing mandibular ROM values, particularly in children aged 6 to 7 years, measuring 1.15-1.35 m, and weighing between 17.3-46.5 kg.
Descriptors: Temporomandibular joint; Range of motion, articular; Movement.
Letícia Mêlo de Sousa(a) Harumi Martins Nagamine(a) Thaís Cristina Chaves(b) Débora Bevilaqua Grossi(c) Simone Cecílio Hallak Regalo(d) Anamaria Siriani de Oliveira(e)
(a)PTs, Graduate Students of Physical Therapy,
School of Medicine of Ribeirão Preto, University of São Paulo.
(b)PT, PhD, MS in Medical Sciences; (c)PhD, Professor; (e)PT, PhD, Professor
– Department of Biomechanics, Medicine and Rehabilitation of the Locomotor System, School of Medicine of Ribeirão Preto, University of São Paulo.
(d)PhD, Professor, Department of Morphology,
Stomatology and Physiology, School of Dentistry of Ribeirão Preto, University of São Paulo.
Corresponding author:
Anamaria Siriani de Oliveira Faculdade de Medicina de
Ribeirão Preto - USP
Campus Universitário, Curso de Fisioterapia - Prédio Central Av. Bandeirantes, 3900 - Monte Alegre Ribeirão Preto - SP - Brazil
CEP: 14049-900 E-mail: [email protected]
Introduction
Temporomandibular joint (TMJ) range of mo-tion (ROM) assessment is a simple and objective method used to perform a functional evaluation of the masticatory system.1,2 Reduced or excessive
mandibular mobility may be one of the signs of temporomandibular disorder (TMD), which may also be associated with traumas, neuromuscular disorders, odontogenic infections, and development abnormality.3-10 Thus, mandibular ROM
measure-ment becomes a useful parameter in diagnosis and treatment planning, and is therefore recommended in clinical exams of patients with TMD signs and symptoms.4,11
Mandibular ROM values are inluenced by nu-merous factors, including joint and muscle struc-ture conditions, ethnicity, age, weight, gender, and height.1,4,7,12-15 Hence, it is essential to establish a
population’s mandibular ROM in order to ob-tain appropriate and reliable diagnosis regarding movement limitation.4 Agerberg16 (1974) proposed
cuttoff values of 40 mm for mouth opening, and 5 mm for protrusive and lateral horizontal move-ments. The author also suggested using different limits of mouth opening for men, women, and children (42 mm, 38 mm, and 35 mm, respective-ly).16,17 Landtwing12 (1978) and Vanderas10 (1992)
have also stated that it is important to take into consideration the age and height of subjects when evaluating mandibular ROM. Boozer et al.1 (1984)
studied, with the use of a millimeter ruler, the in-luence of age and gender on the mouth opening range of 2,273 North-Americans aged between 11 and 70 years. The authors observed that mouth opening values reduced with age and tended to be higher for men. Similar results have been pre-sented in other studies.4,11,18 Sheppard, Sheppard15
(1965), in a similar but broader study involving North-American subjects, aged between 11 and 15 years, stated that the highest mouth opening val-ues were found within the age range of 11 and 15 years, with a progressive increase in measurement for children aged between 3 and 15 years. Other authors have evaluated maximum mandible move-ment in speciic populations: Agerberg17 (1974), in
Scandinavian children aged 1 to 2 and 5 to 6 years;
Rothenberg9 (1991), in North-American
individu-als aged 4 to 14 years; and Vanderas10 (1992), in
Greek children aged 6 to 10 years. They found that the mouth opening range increased with age. How-ever, no signiicant correlation was conirmed be-tween range and the child’s gender, the opposite of that stated for adults.7,16,19
The data presented above demonstrates the im-portance of mandibular movement measurement in the evaluation of the functional status of the mas-ticatory system and associated structures. Factors which may inluence mandibular ROM values must be taken into consideration, such as age, gender, and height of the individual. Nevertheless, no studies that evaluate such correlations in Brazilian children were found. Thus, the objective of this research was to study mandibular ROM values in Brazilian chil-dren (boys and girls) of various ages, weights, and heights, and establish correlations among these vari-ables and mandibular ROM values.
Material and Methods
The subjects of this study are 303 children (1.37r 0.11 m; 33.7r 10.9 kg) from a public school
in the city of Ribeirão Preto, São Paulo State, Bra-zil. The children were 6 to 14 years old, of which 161 were girls (9.0r 1.6 years) and 142 were boys
(8.8r 1.6 years).
Inclusion criteria were: no history of trauma on the face, having all incisors, being able to un-derstand and perform mandibular movements as instructed, and having good health. Children were excluded from the study if they were in orthodon-tic treatment, if they had any pain or restriction in mandible movement, and any systemic disease, such as juvenile rheumatoid arthritis. This study was ap-proved by the Research Ethics Committee, School of Medicine of Ribeirão Preto, University of São Paulo.
Weights and heights were obtained using an an-thropometric scale (Filizola, São Paulo, SP, Brazil),
with precision of 100 g. Measurements of maximum active mandibular ROM were made by the same trained rater, using a calibrated boley gauge (Mitu-toyo, Suzano, SP, Brazil). Mouth opening (MO),
pro-trusion (P) were recorded in millimeters (mm), in 3 consecutive repetitions, at random, and following the Research Diagnostic Criteria for Temporoman-dibular Disorders (RDC/TMD).19
Mean mandibular ROM values were analyzed according to age, height, and weight ranges, which were arbitrarily determined for statistical ends. Hence, the sample was divided into 7 age groups with a one year variation (6, 7, 8, 9, 10, 11, and 12-14 years), 5 height groups with a variation of approximately 10 cm (1.15 to 1.25 m; 1.26 to 1.35 m; 1.36 to 1.45 m; 1.46 to 1.55 m; 1.56 to 1.75 m), and 5 weight groups with a variation of approximately 10 kg (17.30 to 26.50 kg; 27 to 36.50 kg; 37 to 46.50 kg; 47 to 56.50 kg and 57 to 85 kg). Children who were 12, 13, and 14 years old were put in the same group due to the small number of participants in this age range (n = 9, n = 2, and n = 1, respectively). Analysis of variance (ANOVA) (p < 0.05) was used to evaluate the dif-ferences among the 3 repeated measures of man-dibular ROM values in the different age, weight, gender, and height groups. Differences in gender groups were compared using Student’s t-test for in-dependent samples (p < 0.05).
Mandibular ROM values were correlated with weight, height, and age data using Pearson’s Cor-relation test (p < 0.05), or Pearson’s r. CorCor-relation levels were classiied as poor for r < 0.3, weak for 0.3 < r < 0.5, moderate for 0.6 < r < 0.8, and excel-lent for r < 0.8.20
Results
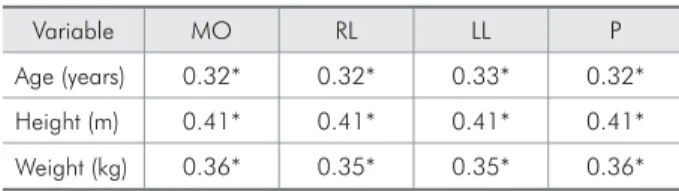
Weak statistically signiicant correlations (0.3 < r < 0.5) were found between the variables
age, height, and weight, and all the evaluated ROM (Table 1).
Girls showed mean MO values of 43.47r 5.99 mm and boys, of 43.96r 5.60 mm
(Student’s t test, p = 0.47). For RL and LL move-ments, respectively, the mean values observed were 8.31r 2.07 mm and 8.14r 2.08 mm for
girls, and 8.42r 1.89 mm and 8.27r 1.84 mm for
boys (Student’s t test, p = 0.62 and 0.59, respec-tively). The values observed for P movement were 7.01r 2.55 mm for girls, and 7.16r 2.39 mm for
boys (Student’s t test, p = 0.58).
No differences were found in terms of gender and mandibular ROM values in the evaluated children. They were, therefore, placed in the same group. As for age range and mean MO values, no signiicant differences were found between ages 6 and 7. None-theless, there was a signiicant difference (p < 0.05) in relation to the other ages, with a signiicant in-crease (p < 0.05) at 8 years and maintenance of the mean MO values in subsequent ages. No differences were observed among the ages considered in the present study and mean RL values. The same was observed for mean LL values, which varied slightly, except between ages 7 and 10, which presented sta-tistically signiicant values (p < 0.05). As for mean P values, a signiicant increase (p < 0.05) was ob-served for the mean values in 10 and 12-14 year-old children when compared to ROM values of 7 year-olds (Table 2).
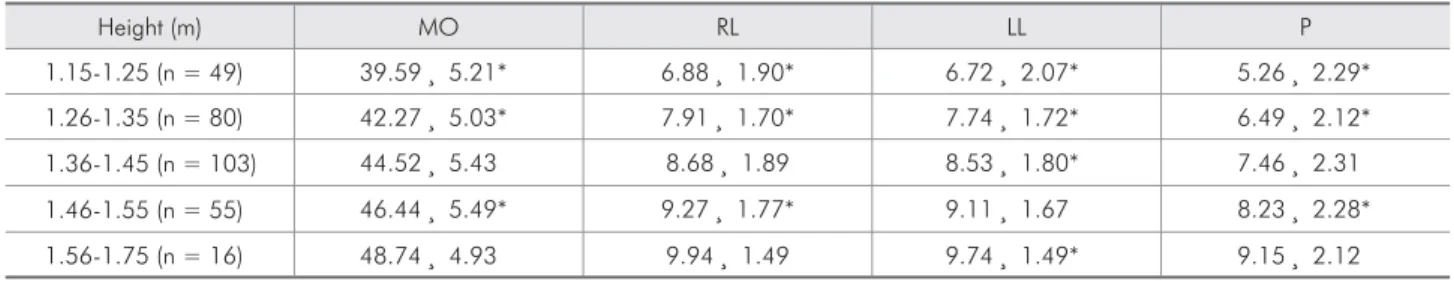
In regard to the height range and mean MO values, the latter showed a signiicant increase (p < 0.05) with height, except for the ranges 1.36-1.45 m and 1.56-1.75 m. Similar results were found for mean values of RL and P. As for mean LL val-ues, there was a signiicant increase in relation to the increase in height ranges, with non-signiicant increases (p > 0.05) only for heights within the range 1.46 to 1.55 m (Table 3).
Analysis of mean mandibular ROM values in relation to weight showed a signiicant increase in MO values (p < 0.05) for weights within the range 17.30 to 46.50 kg, which remained unchanged in the following weight ranges. The same behavior was observed for mean RL, LL, and P values (Ta-ble 4).
Table 1 - Pearson’s r values obtained from the correlations between mean ROM and the variables age, weight, and height. (n = 303).
Variable MO RL LL P
Age (years) 0.32* 0.32* 0.33* 0.32*
Height (m) 0.41* 0.41* 0.41* 0.41*
Weight (kg) 0.36* 0.35* 0.35* 0.36*
Discussion
The objective of this research was to study man-dibular ROM values in Brazilian children, boys and girls, of various ages, weights, and heights, and es-tablish correlations between these variables and mandibular ROM values.
No statistically signiicant differences were ob-served regarding the mandibular ROM of the gen-der groups. The present study’s indings agree with
those of Rothenberg9 (1991), Vanderas10 (1992), and
Agerberg17 (1974), who also did not ind any
differ-ences between ROM values in relation to children’s gender. Hence, it is suggested that the inluence that gender has on ROM in adults is not observed in chil-dren, perhaps due to the fact that they do not have the sexual maturity of adults.
Mean maximum mandibular ROM values, taking into consideration all the children evaluated in this Table 2 - Mean values and standard deviations of mandibular ROM (mm) according to the studied age ranges and the com-plete sample (n = 303).
Age (years) MO RL LL P
6 (n = 18) 39.44r 4.42 8.05r 2.02 7.77r 1.65 7.11r 2.65
7 (n = 51) 40.10r 5.81* 7.90r 1.82 7.41r 2.13* 6.12r 2.22*
8 (n = 57) 43.56r 5.19* 8.57r 1.92 8.23r 1.71 7.00r 2.69
9 (n = 54) 45.16r 5.41 8.68r 1.93 8.33r 2.14 7.16r 2.34
10 (n = 64) 44.97r 5.71 8.55r 2.16 8.64r 1.91* 7.75r 2.30*
11 (n = 47) 45.86r 5.96 8.10r 2.03 8.36r 1.93 7.24r 2.18
12-14 (n = 12) 44.22r 4.44 8.39r 1.88 8.33r 1.84 8.48r 2.00*
Total (n = 303) 43.70r 5.81 8.20r 1.97 8.36r 1.99 7.10r 2.44
MO: mouth opening; RL and LL: right and left lateral movements; P: protrusion; *p < 0.05 in ANOVA.
Table 3 - Mean values and standard deviations of mandibular ROM (mm) according to the studied height ranges.
Height (m) MO RL LL P
1.15-1.25 (n = 49) 39.59r 5.21* 6.88r 1.90* 6.72r 2.07* 5.26r 2.29*
1.26-1.35 (n = 80) 42.27r 5.03* 7.91r 1.70* 7.74r 1.72* 6.49r 2.12*
1.36-1.45 (n = 103) 44.52r 5.43 8.68r 1.89 8.53r 1.80* 7.46r 2.31
1.46-1.55 (n = 55) 46.44r 5.49* 9.27r 1.77* 9.11r 1.67 8.23r 2.28*
1.56-1.75 (n = 16) 48.74r 4.93 9.94r 1.49 9.74r 1.49* 9.15r 2.12
MO: mouth opening; RL and LL: right and left lateral movements; P: protrusion; *p < 0.05 in ANOVA.
Table 4 - Mean values and standard deviations of mandibular ROM (mm) according to the studied weight ranges.
Weight (kg) MO RL LL P
17.30-26.50 (n = 90) 40.69r 5.00* 7.32r 1.80* 7.16r 1.88* 5.77r 2.15*
27-36.50 (n = 120) 43.71r 5.47* 8.40r 1.90* 8.25r 1.85* 7.13r 2.32*
37-46.50 (n = 52) 46.79r 5.47* 9.41r 1.77* 9.23r 1.71* 8.38r 2.36*
47-56.50 (n = 26) 46.20r 5.21 9.16r 1.69 8.97r 1.63 8.09r 2.28
57-85 (n = 15) 46.57r 6.31 9.22r 2.05 9.07r 1.97 8.24r 2.54
study, were 43.70r 5.81 mm for MO, 8.20r 1.97 mm
for RL, 8.36r 1.99 mm for LL, and 7.10r 2.44 mm
for P. Similar values have been reported in previous studies of non-Brazilian children.10,17,21,22
In the present study, weak and positive statisti-cally signiicant correlations were observed between the variables age, height, and weight, and all the evaluated ROM. A signiicant increase in mean MO values was found for ages 6 and 7 in relation to the other ranges, which remained unchanged in sub-sequent age ranges. A signiicant increase was also observed in mean MO values for the weight range from 17.30 to 46.50 kg, which remained constant in subsequent weight ranges. As for height, an in-crease was observed for each range. Thus, the pres-ent study’s results suggest that small height ranges, of approximately 10 cm, can be considered as a better predictor of MO normality values. As for age and weight, however, results suggest that due to the small variation in mean MO values, some of the ranges considered in the present study may be grouped together. Therefore, although children aged less than 6 years were not evaluated, the pres-ent study suggests that single groups may be consid-ered with ages up to 7 years, from 8 to 14 years, and weighting 47.0 kg or more. Future studies should be performed to conirm this suggestion.
Rothenberg9 (1991) also observed, in subjects
with ages between 4 and 14 years old, a positive correlation between MO values and age, as well as in relation to weight and height, with a mean MO value of 43.99r 5.78 mm. Similar results were
ob-tained by Landtwing12 (1978) and Henrikson et al.23
(2000). Rothenberg9 (1991) and Fukui et al.3 (2002)
also suggest there is a correlation between facial morphology, which varies according to age, gender, and ethnicity,24-28 and mandibular movements. Such
relation had previously been conirmed by Ingervall2
(1971), who suggests that approximately 25 to 40% of interindividual variations in mandibular ROM may be due to variations in facial morphology.
Regarding the inluences of the studied variables on the values of RL and LL, it was observed that age had a smaller inluence than height and weight. As for P, all the studied variables appeared to cause changes in mean values. For height ranges below
1.45 m, there were gradual increases in mean values of RL, LL, and P, which did not remain constant in higher height ranges. Weight also seems to have an important role, particularly in weight ranges below 46.5 kg, which showed a gradual increase in RL, LL, and P values. Studies that evaluate mandibular later-al and protrusive movements in children are scarce in the literature. Of the existing studies, only a few describe the obtained results. Among such studies are those by Rothenberg9 (1991) and Vanderas10
(1992). Both report an increase in those movements with age, but they do not present any mean values in their studies. As for height, Vanderas10 (1992) only
states there was a positive correlation between that variable and mandibular movements, but does not describe the behavior.
Thus, considering the correlation observed in the present study and the signiicant increase in the mandibular ROM mean values among the age, height and weight ranges, it is suggested that, for the determination of normality values speciically for clinical practice, such variables should be con-sidered. To that end, the present study contributes with preliminary data.
Conclusion
The present research studied mandibular ROM in Brazilian children (boys and girls) with ages between 6 and 14 years. The indings suggest there is a weak correlation between the variables age, weight, and height and the degree of mandibular ROM, with sig-niicant differences between the obtained mean val-ues. Thus, it is suggested that weight, height, and age variables be considered when obtaining mandibular ROM values, particularly in children aged 6 to 7 years, measuring 1.15-1.35 m, and weighing between 17.3-46.5 kg. Moreover, there is a need for further studies to evaluate the inluence of facial morphology on mandibular ROM in Brazilian children.
Acknowledgements
References
1. Boozer CH, Ferraro EF, Weinberg R. The effects of age, race and sex on the interincisal measurement. Ann Dent. 1984;43(2):5-7.
2. Ingervall B. Variation of the range of movement of the man-dible in relation to facial morphology in young adults. Scand J Dent Res. 1971;79(2):133-40.
3. Fukui T, Tsuruta M, Murata K, Wakimoto Y, Tokiwa H, Kuwahara Y. Correlation between facial morphology, mouth opening ability, and condylar movement during opening-clos-ing jaw movements in female adults with normal occlusion. Eur J Orthod. 2002;24(4):327-36.
4. Gallagher C, Gallagher V, Whelton H, Cronin M. The normal range of mouth opening in an Irish population. J Oral Rehabil. 2004;31(2):110-6.
5. Helkimo M. Studies on function and dysfunction of the mas-ticatory system. II. Index for anamnestic and clinical dysfunc-tion and occlusal state. Sven Tandlak Tidskr. 1974;67(2):101-21.
6. Ingervall B. Range of movement of mandible in children. Scand J Dent Res. 1970;78(4):311-22.
7. Lewis RP, Buschang PH, Throckmorton GS. Sex differences in mandibular movements during opening and closing. Am J Orthod Dentofacial Orthop. 2001;120(3):294-303. 8. Pehling J, Schiffman E, Look J, Shaefer J, Lenton P, Fricton J.
Interexaminer reliability and clinical validity of the temporo-mandibular index: a new outcome measure for temporoman-dibular disorders. J Orofac Pain. 2002;16(4):296-304. 9. Rothenberg LH. An analysis of maximum mandibular
move-ments, craniofacial relationships and temporomandibular joint awareness in children. Angle Orthod. 1991;61(2):103-12. 10. Vanderas AP. Mandibular movements and their relationship
to age and body height in children with or without clinical signs of craniomandibular dysfunction: Part IV. A compara-tive study. ASDC J Dent Child. 1992;59(5):338-41.
11. Szentpétery A. Clinical utility of mandibular movement ranges. J Orofac Pain. 1993;7(2):163-8.
12. Landtwing K. Evaluation of the normal range of vertical man-dibular opening in children and adolescents with special refer-ence to age and stature. J Maxillofac Surg. 1978;6(3):157-62. 13. Muto T, Kanazawa M. The relationship between maximal jaw
opening and size of skeleton: a cephalometric study. J Oral Rehabil. 1996;23(1):22-4.
14. Pullinger AG, Liu SP, Tay D. Differences between sexes in maximum jaw opening when corrected to body size. J Oral Rehabil. 1987;14(3):291-9.
15. Sheppard IM, Sheppard SM. Maximal incisal opening – A diagnostic index? J Dent Med. 1965;20(1):13-5.
16. Agerberg G. Maximal mandibular movements in young men and women. Sven Tandlak Tidskr. 1974;67(2):81-100. 17. Agerberg G. Maximal mandibular movements in children.
Acta Odontol Scand. 1974;32(3):147-59.
18. Mezitis M, Rallis G, Zachariades N. The normal range of mouth opening. J Oral Maxillofac Surg. 1989;47(10):1028-9.
19. Dworkin SF, LeResche L. Research diagnostic criteria for temporomandibular disorders: review, criteria, examina-tions and specificaexamina-tions, critique. J Craniomandib Disord. 1992;6(4):300-55.
20. Chan YH. Biostatistics 104: Correlational Analysis. Singapore Med J. 2003;44(12):614-9.
21. Bonjardim LR, Gavião MBD, Pereira LJ, Castelo PM. Man-dibular movements in children with and without signs and symptoms of temporomandibular disorders. J Appl Oral Sci. 2004;12(1):39-44.
22. Leles RC, Moreira Neto JJS, Giro EMA, Compagnoni MA. Valores normais da amplitude do movimento mandibular em crianças. Pós-Grad Rev Fac Odontol São José dos Campos. 2000;3(2):121-6.
23. Henrikson T, Nilner M, Kurol J. Signs of temporomandibu-lar disorders in girls receiving orthodontic treatment. A pro-spective and longitudinal comparison with untreated Class II malocclusions and normal occlusion subjects. Eur J Orthod. 2000;22(3):271-81.
24. Ajayi EO. Cephalometric norms of Nigerian children. Am J Orthod Dentofacial Orthop. 2005;128(5):653-6.
25. Buschang PH, Gandini Júnior LG. Mandibular skeletal growth and modelling between 10 and 15 years of age. Eur J Orthod. 2002;24(1):69-79.
26. Farkas LG, Katic MJ, Forrest CR, Alt KW, Bagic I, Balt-adjiev G et al. International anthropometric study of facial morphology in various ethnic groups/races. J Craniofac Surg. 2005;16(4):615-46.
27. Ishii N, Deguchi T, Hunt NP. Morphological differences in the craniofacial structure between Japanese and Caucasian girls with Class II division 1 malocclusions. Eur J Orthod. 2002;24(1):61-7.