THE EUROPEAN UNION CONVERGENCE IN TERMS OF ECONOMIC
AND HUMAN DEVELOPMENT
Iulia Andreea BUCUR*
Oana Ancuta STANGACIU **
Abstract:In the context of EU enlargement there is no universal model which should offer a unique solution for diminishing the disparities in the development of a country. An approach only from the point of view of economic growth is not enough, so we extend the analysis towards the social development. Considering the level of GDP per capita and of HDI registered by EU states during 1995-2012, we test the hypothesis of real σ and β-convergence in terms of economic and social development. The estimated results indicate a tendency in reducing the divergence in both economic and social degree of development. A relatively strong process of real σ-convergence became evident while real β-convergence testing supports the hypothesis among EU countries, but the results indicate a slower process for HDI convergence compared with GDP per capita.
Keywords:human development index; economic growth; GDP per capita; EU member states; sigma convergence; beta convergence
JEL Classification: C50; E01; F43; I25; O11; O15
Introduction
During the 19th century, in the context of the industrial revolution which led to an increase in the level of welfare, the European countries experienced significant economic growth. However, they were quite unequally affected by the development process, so the disparities between nations have increased. Thus, this question emerged: Will the process of European integration emphasize or diminish the existing trend toward a well-balanced EU economic area? (Ignat and Bucur, 2012).
Extensively treated and debated in the literature, the matter of regional economic convergence is regarded as a similarity or identity matrix (Castro, 2004). Many studies carried out on national as well as on regional levels, which used the two types of convergence –the sigma convergence and the
beta convergence (absolute and conditional) (Sala-i-Martin, 1996) – showed that in the EU the real
convergence is far from being complete.
In a narrow sense, real convergence requires the similarity of the final results regarding the real economic variables, the difference between them tending towards zero, while in a wider sense, the differences and the modifications in time concerning the levels of development, competitiveness, the macroeconomic performance and the labour market as well as other aspects can show the degree of real convergence (Zd’arek and Sindel, 2007). Consequently, in the long term, real convergence means reducing the structural disparities among different countries/regions, thus allowing for certain
*PhD Lecturer, “Vasile Alecsandri” University of Bacau, Romania, e-mail: [email protected]
similar performance concerning the real variables, the so-called catching-up process of the developing countries during the transition period, concerning the income per capita, the standard of living, productivity and other variables (Bucur, 2012a).
Achieving sustainable convergence by reducing economic disparities is possible only in the context of long-term economic growth, which is why the determinants of convergence are practically the sources of growth potential.
The existence of a convergence process of the poor economies towards the rich ones would satisfy the natural desire of humanity for justice and fairness. However, the presence or absence of convergence is not completely an economic phenomenon, the social situation of individuals that
affects individual and national productivity aggregate being essential for the stability and sustainability of economic growth in both developed and developing economies (Parhi et al., 2013). As President Franklin Roosevelt of the United States affirmed in his address at the Conference of the International Labour Organization in New York in 1941, “the economic policy can no longer be an
end in itself; it is only a means of achieving social objective” Mückenberger (1994) also considers
that “to discuss and decide economic issues without regard to social objectives is to lose all sense of
purpose, and to discuss and decide social objectives without regard to economic conditions and
constraints is to lose all contact with reality”. The same opinion is supported by Pecican (2009), who
suggests that the unilateral approach, only from the economic point of view, is not sufficient, and that it would be advisable to extend the analysis towards other fields of the social development, which implies including more synthetic indicators in the calculations performed.
Emerging from insufficient measurement of living standards, which were using only income as the sole indicator (Crafts, 1999), the Human Development Index (HDI) - published in 1990 by the UNDP in the HDR, as an analysis framework for the social development of a country as well as for its economic development – allowed a more comprehensive type of convergence analysis among the countries. The aggregate index includes specific variables for certain aspects which are extremely relevant for the social and economic status (the degree of education, life expectancy, Gross National Income) and it is calculated as an average of three basic dimensions of the human development (a
long and healthy life, the level of knowledge and a decent standard of living).
Regarded as a determininant that enables the increasing of the economic standard to the level of development of a country or group of countries within the regional integration, real convergence can be quantified using a set of result indicators. The indicator that is most frequently used for assessing the standard of living or for monitoring the convergence process is the derivative indicator
GDP per capita, which we also used in this paper. So, with the possibility of studying cross-country
convergence using a more comprehensive indicator than GDP per capita, we will complement the analysis of the economic convergence with the analysis of the human development convergence. This can be quantified using the aggregate indicator HDI and the main components in its composition: Education Index, Life Expectancy Index and Gross National Income per capita in PPP terms (GNI). Our approach is meant to outline a much more accurate picture of the socio-economic reality in the analyzed EU member states.
In order to identify the existence of both economic and social convergence processes and also to emphasize their evolution in the context of European enlargement from EU-15 to EU-27, being characterized by an unprecedented scale and diversity, with high levels of socio-economic risk, we have chosen the period 1995-2012 for our analysis.
Using conventional tests for sigma convergence, our results indicate that there is a tendency of reducing divergence in both economic and social terms of development among the EU states during 1995-2012. Testing beta convergence for both indicators we can say that in terms of social development there is a much slower convergence process among the EU states, over the last seventeen years, mainly due to Life Expectancy Index and, to a lesser extent, to GNI per capita.
We structured the rest of the paper as follows: in Section 1 we present previous studies which are representative for convergence in terms of social development based on the cornerstones of the theory of economic. Data and methodological aspects for testing economic and social convergence
are discussed in Section 2, while in Section 3 available data are processed and our empirical results are reported and analyzed. Finally, Section 4 contains the summary of the study and the main findings of our results considering previous studies mentioned in the paper.
3. Theoretical Background
3.1. Developments in the Theory of Economic Growth
Solow-Swan growth model based on the Harrod-Domar model, considers that the conditional convergence implies achieving a relatively equal level of income per capita, in the context of certain significant growth disparities between economies, while the absolute convergence supports the equal level of income per capita, irrespective of its initial level (Solow, 1956 and Swan, 1956).
The empirical studies suggested that “real economies generally converge towards their state of balance at considerably slower rates than the ones predicted in the original Solow model” (McQuinn
and Whelan, 2007). Thus, it is considered that the neoclassical model does not offer a proper perspective on the processes that cause the long-run growth.
Compared to the neoclassical models, the second generation, the endogenous growth models,
developed during the mid-80s, offer different conclusions concerning the existence of convergence. All the new models emphasize the unlimited feature of the technical progress stemming from knowledge, in order to save all the factors of production, and plead for constant or increasing marginal efficiency of the investment. Two models are distinguished: the Romer model of learning by doing, which states that economic growth can be achieved with the increase of income, but with the manifestation of the divergence processes (Romer, 1986) and the Lucas model which, analyzing the transition period, emphasizes the fact that the less developed countries may have a slower or a faster growth rate compared to most of the developed countries, according to the insufficiency of the physical or human capital of the poorer economies (Lucas, 1988). Later on, the Aghion-Howitt model
indicates the existence of a correlation between the level of the income and the economic growth rate (Aghion and Howitt, 2004).
A third generation of economic growth models was gradually shaped, which gives special significance to certain factors that pertain to the level of development of that particular country or region, the economic policies of that country and the specific problems existing in different regions. Starting with Williamson (1965) who supports the idea that the typical development model on national level leads to interregional divergence during the first stages of the process, while later on the differences diminish and the convergence in the regional development starts to be manifested, other empirical research was devoted to this matter and applied to the European integration model
(e.g.: Davies and Hallet, 2002; Petrakos et al., 2003; Dall’erba and Le Gallo, 2003; Brasili and Gutierrez, 2004).
intensification of the technology transfer and with a higher rate of economic growth, the peripheral regions are characterized by a reduced capacity of implementation of technical progress, which affects the sustainability of the economic convergence process. According to the conditions for achieving economic integration, such as: the mobility of capital, the workforce mobility and the mobility of technologies among different countries or regions, the central and the peripheral
economies will react differently, according to the factors that prevail – the convergence or the divergence ones.
The term convergence should not be limited to the controversy between neoclassical and endogenous partisans in the theory of economic growth, since the development of a country is a much more complex phenomenon than the growth of income per capita or the growth of work efficiency (Konia and Guisan, 2008). In the case of countries during the catching-up process, the dimensions of human life such as health, education, working conditions, free time, environment or social justice become more and more important, and thus it is no longer enough to have higher income per capita, but it is equally important to increase the standard of living, in the broadest sense.
3.2. Previous Studies on Social Development Convergence
In their studies, Mazumdar (2002), Sutcliffe (2004), Noorbakhsh (2006), Konya and Guisan (2008) attempted to study convergence from the human development perspective.
Mazumdar (2002) examined the HDI convergence for a sample of 91 countries, for the period 1960-1995, and also for three groups of countries according to their level of human development.
The author has carried out three tests for β-convergence based on the following regression equations
(Baumol and Wolff, 1988):
) 1 ( ln
ln 3 ,
2 , 2 , 1 0 , , i t i t i t i t i T t i y a y a y a a y y ) 2 ( ln 2 , 2 , 1 0 , , i t i t i t i T t i y a y a a y y ) 3 ( ln
ln 0 1 ,
, , i t i t i T t i y a a y y
Sutcliffe (2004) examined HDI trend for a sample of 99 countries, during 1975, 1980, 1985, 1990, 1995 and 2001. The author analyzed the evolution of descriptive statistics (mean, standard
deviation, coefficient of variation) and tested β-convergence using the following regression equation:
) 4 (
ln 0 1 ,
, , i t i t i T t i y a a y y
where: yi,t is HDI in country i, in year t. The results indicated convergence in terms of human development for the considered period. However, the author rejects the idea of a convergence process in terms of HDI, also bringing arguments for his position in his study.
Noorbakhsh (2006) examined the HDI trend for different samples of countries and regions over the period 1975-2002, using data slightly updated compared to previous studies. The author has tested
β-convergence using the following regression equation:
) 5 ( ln : ln 1 ln
1 , ,
, , , , i t t i t t i t i T t i t i T t i x x x x x x T y y
T
where: yi,t = xi,t / t, x = HDI in country i, in year t and = HDI average of considered countries in year t.The results indicated a weak β and σ-convergence for those countries in the considered period, in terms of social development.
It is important to note that Mazumdar (2002), Sutcliffe (2004) and Noorbakhsh (2006) tested
the β-convergence regressions (1)-(4) with OLS method without testing and correcting
heteroscedasticity, given the wide range of countries considered.
More recently, Konya and Guisan (2008) tested σ and β-convergence in terms of worldwide
human development in the last three decades, analyzing HDI trend values over a period of seven years (1975, 1980, 1985, 1990, 1995, 2000 and 2004) for a sample of 93 countries. To ensure comparability,
they tested the σ-convergence (standard deviation and coefficient of variation) on the set of 93
countries and β-convergence on a sample of 101 countries, using the regression equation
(Sala-i-Martin, 1996) most commonly used:
) 6 ( ln ,
,
,tt T it i
i y
y
where: yi,t ,t+T is the annual growth rate indicator y in country i, between t and t + T.
The results indicate a convergence process, meaning that developing countries increased HDI faster than more developed countries, but this process was rather slow. They tested β-convergence using regression equation (6) and the OLS method and applied White test for heteroscedasticity, given the wide range of countries considered.
and Slovakia whose HDI trend values are not available for 1975 or 1995 and 2000) and the EU-25 (post-2007 EU members, keeping the two exceptions). In both cases the presence of both σ and β -convergence and estimated values showed a more rapid -convergence in these groups of countries than in the world. Moreover, although the 12 countries that joined the EU in 2004 and 2007 are relatively underdeveloped as compared to the other 15 EU member states, and thus their membership has
slightly slowed convergence, the last two waves of enlargement seem to have a major impact on HDI convergence of the EU.
4. Data and Methodology of the Study
The matter of the real convergence is not a new one; there is a large variety of approaches and research concerning this process and a diversity of calculation methodologies. Theoretically, real convergence is explicitly and systematically founded on the neoclassical theory of economic growth. Studies on this process evolved following the econometric processing of growth models.
Methodologically speaking, the internal and international interest in the analysis of the real
convergence led to a large variety of indicators and methods, from the easiest statistical methods to complex econometric models.
Sigma convergence indicates a decreasing variation of the variable (GDP per capita, HDI)
within a group of countries. The σ parameter shows the convergence or the divergence tendency, as this indicator shows the limitation or the increase in the dispersion of the data sample analyzed.
The real economic convergence can mainly be distinguished due to its complexity, reflected among others by the distribution of the variable and by inequality. The levels of the specific indicators concerning the dispersion are relevant in assessing the degree to which a convergence process can be
confirmed along a certain period of time, confirming or invalidating a characteristic of convergence or a particular feature which determines such a process. As a part of temporal analyses, by using synthetic indicators (dispersion, standard deviation, coefficient of variation), the existence of a downward trend of the dispersion level allows us to state that the convergence process grows stronger and stronger; conversely, when its level increases, it means that there is a divergence process. More exactly, the calculation of the spread indicators refers to the opposite of convergence, meaning that it expresses numerically how far the entities of the group are from the central level towards which the values of the indicator analyzed are supposed to converge (Pecican, 2009).
spread in relation to the average. The fact that its level depends neither on the measurement unit nor
on the indicators’ size order makes such an indicator an appropriate tool for the analysis of
convergence (Castro, 2004).
Among many methodological concerns for the developing of a scientific on convergence, we can identify the econometric research on various statistical cross or chronological series assessing, through regression equations and estimated parameters, the convergence or divergence trends of the global economy and EU economies.
Besides σ-convergence, often used in regional studies and in the literature concerning the economic geography (Rey and Montouri, 1998), beta convergence also has a special place within
macroeconomic studies. Friedman (1992) and Quah (1993) believe that the regression model is likely to lead to erroneous estimates of the existence and extension (Galton’s fallacy) generated by the existence of approximately equal conditions for countries making up the sample regarding population growth, savings rate, depreciation rate and technology, which soon lead to the development of a process of polarization. Nevertheless, beta convergence appeared in the specialized literature as a requisite tool for econometric calculation and analysis and for process description.
This type of convergence shows that, in the long term, in the hypothetical context of absolute convergence, the poor economies tend to increase faster than the richer ones, while in the hypothetical context of conditional convergence the same phenomenon takes place according to certain determining factors. The economic parameter β shows the convergence speed when it is negative.
Considering Solow’s neoclassical theory concerning the decreasing capital efficiency, we take
into consideration the hypothesis of the upper growth rates registered by the less developed economies compared to the developed economies. This means a gradual decrease in time of the differences in terms of GDP per capita as well as the existence of an inverse relationship between the growth rate of GDP per capita within a certain period of time and the initial level of the indicator. Moreover, if we analyze the real convergence in terms of the social implications and the redistribution policies of the decision makers concerning social equality, we can reformulate the previous hypothesis considering the index of human development; in other words, the states with low HDI
Beta convergence can be estimated using a regression model, by quantifying the marginal reaction of the effect when modifying the cause, more exactly the condition expressed by the development level during the initial stage:
) 7 ( ln
ln 1
, ,
,
i t i t
i T t i
y y
y
T
where: t – reference year; T – number of years; i – country; yi,t – development level during the reference year; yi,t+T – development level after T years; α – constant; ß –regression parameter estimated concerning the regression slope; εi– residual value.
Thus, employing the statistic data concerning GDP per capita based on the Purchasing Power
Standard (PPS) during 1995-2012, available on Eurostat and the data concerning HDI over the same
time period, available on UNDP, we focus on the group of 26 member states of the EU (except Luxembourg, because of the extreme values of GDP per capita – the outliers). First of all, we intend
to test the hypothesis of real σ-convergence, and second, using chronological statistical series, we
aim at assessing the convergence trends of the EU countries from economic and social points of view by means of regression equations and estimated parameters.
5. Data Analysis and Presentation of Results
5.1. Economic and Social σ-Convergence in the European Union
Besides the data provided by descriptive statistics, we also estimated the numerical evolution of sigma convergence by means of the standard deviation and the coefficient of variation.
We observe that the minimum as well as the maximum values concerning GDP per capita and HDI show an increasing trend during the considered period of time. A faster rate is identified in the case of the first indicator. At the same time, the standard deviation and the coefficient of variation for both indicators show, through the calculated values, a slight variation. This also signals the existence of a homogenous community and thus a favourable evolution of sigma convergence over the period 1995–2012 (Table 1).
Table 1 – Descriptive statistics and the status of economic and social convergence in the European Union, 1995-2012
Indicators 1995 2000 2005 2012
GDP per capita
N (number of valid elements/countries) 26 26 26 26
Minimum value 4,600 5,000 7,900 12,100
Maximum value 19,700 25,600 32,500 33,300
Standard deviation 5,378 7,040 7,138 6,794 Coefficient of variation (sigma convergence) 0.3658 0.3686 0.3172 0.2654
HDI
N (number of valid elements/countries) 26 26 26 26
Minimum value 0.680 0.710 0.756 0.782
Maximum value 0.870 0.900 0.907 0.921
Average 0.7843 0.8176 0.8458 0.8631
Standard deviation 0.0546 0.0516 0.0452 0.0413
Coefficient of variation (sigma convergence) 0.0696 0.0631 0.0534 0.0479
Source: Personal processing of Eurostat and UNDP available data
Note: For comparability Luxembourg was eliminated from the analysis of both economic and social convergence, given its extreme GDP per capita (in PPS) value.
In light of the progress made by some member states, the absolute disparities remain as a result of the enlargement and the territorial concentration of EU-27 GDP, with lower rates in the traditional core of Europe and higher ones at the national level (Bucur and Stangaciu, 2012). Analyzing the coefficients of variation (Table 1) we can notice that the territorial dispersion (σ-convergence) related to GDP per capita is much higher than the one corresponding to HDI, which would mean that there are some large GDP per capita differences between countries compared to HDI. Thus, while in 1995 the CV for GDP is 0.3658, its value for HDI is only 0.0696, and the difference between the two coefficients remains approximately the same until 2012. Different degrees of territorial dispersion of these indicators is a prerequisite for the existence of a slower HDI sigma convergence process (the dispersion is lower and, therefore, the catching-up process speed is slower) than for GDP per capita (acase in which the large differences between countries lead to a faster convergence).
The situation concerning the degree of dispersion of GDP per capita and HDI is reflected more
Figure 1 –Economic and social σ-convergencein the European Union, 1995-2012
GDP per capita HDI
Source: Personal processing of Eurostat and UNDP available data
Sigma convergence determined by the coefficient of variation indicates, by means of the calculated values, a low and decreasing variation for Education Index and also for Life Expectancy Index and a stronger dispersion for Gross National Income. Since the values of the coefficients decreased during 1995-2012, we can identify the manifestation in the EU members of a sigma convergence process for the indicators that build HDI (Figure 2).
Figure 2 –HDI main components σ-convergencein the European Union, 1995-2012
Education Index Life Expectancy Index GNI per capita
Source: Personal processing of the UNDP available data
5.2. Economic and Social β-Convergence in the European Union
In this section we will test the beta convergence hypothesis in the EU from both economic and social perspectives, using the same indicators GDP per capita and HDI, for the main period of time 1995-2012 and for other two interim periods: 2000-2012 and 2005-2012. To this end, by applying the regression model, we quantified the marginal reaction of the effect given by the growth rate of
y = -0.0353x + 0.4174 R2 = 0.8749 0.2500 0.2700 0.2900 0.3100 0.3300 0.3500 0.3700 0.3900
1995 2000 2005 2012
CV_GDP Linear (CV_GDP)
y = -0.0075x + 0.0772 R2 = 0.9896 0.0400 0.0450 0.0500 0.0550 0.0600 0.0650 0.0700 0.0750
1995 2000 2005 2012
CV_HDI Linear (CV_HDI)
y = -0.0087x + 0.0972 R2 = 0.8929
0.0400 0.0500 0.0600 0.0700 0.0800 0.0900 0.1000
1995 2000 2005 2012
CV_EDU Linear (CV_EDU)
y = -0.002x + 0.0459 R2 = 0.983 0.0340 0.0360 0.0380 0.0400 0.0420 0.0440 0.0460
1995 2000 2005 2012 CV_Life Linear (CV_Life )
y = -0.0344x + 0.4653 R2 = 0.9311
0.2500 0.2700 0.2900 0.3100 0.3300 0.3500 0.3700 0.3900 0.4100 0.4300 0.4500
GDP per capita and HDI, also modifying the conditions expressed by the level of economic growth and social development during the initial stage.We also extended the analysis of HDI β-convergence with Education Index, Life Expectancy Index and Gross National Income convergence process for the same main and interim periods of time.
Table 2 and Figures 3–7 present and interpret the results offered by SPSS (Harja and Stangaciu,
2009) concerning the regression analysis and the extent to which the annual average growth rate of the indicators (dependent variables) can be explained through the initial level of the indicators (independent variables). The data are presented and interpreted from the point of view of the manifestation of beta convergence based on the parameters of the regression equation.
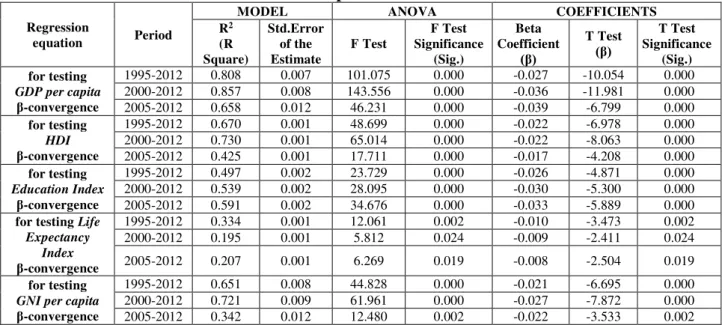
Table 2 – The results of the regression analysis for economic and social β-convergence in the European Union
Regression
equation Period
MODEL ANOVA COEFFICIENTS
R2
(R Square)
Std.Error of the Estimate
F Test
F Test Significance
(Sig.)
Beta Coefficient
(β)
T Test
(β)
T Test Significance
(Sig.) for testing
GDP per capita
β-convergence
1995-2012 0.808 0.007 101.075 0.000 -0.027 -10.054 0.000
2000-2012 0.857 0.008 143.556 0.000 -0.036 -11.981 0.000
2005-2012 0.658 0.012 46.231 0.000 -0.039 -6.799 0.000
for testing
HDI β-convergence
1995-2012 0.670 0.001 48.699 0.000 -0.022 -6.978 0.000
2000-2012 0.730 0.001 65.014 0.000 -0.022 -8.063 0.000
2005-2012 0.425 0.001 17.711 0.000 -0.017 -4.208 0.000
for testing
Education Index
β-convergence
1995-2012 0.497 0.002 23.729 0.000 -0.026 -4.871 0.000
2000-2012 0.539 0.002 28.095 0.000 -0.030 -5.300 0.000
2005-2012 0.591 0.002 34.676 0.000 -0.033 -5.889 0.000
for testing Life Expectancy
Index
β-convergence
1995-2012 0.334 0.001 12.061 0.002 -0.010 -3.473 0.002
2000-2012 0.195 0.001 5.812 0.024 -0.009 -2.411 0.024
2005-2012 0.207 0.001 6.269 0.019 -0.008 -2.504 0.019
for testing
GNI per capita
β-convergence
1995-2012 0.651 0.008 44.828 0.000 -0.021 -6.695 0.000
2000-2012 0.721 0.009 61.961 0.000 -0.027 -7.872 0.000
2005-2012 0.342 0.012 12.480 0.002 -0.022 -3.533 0.002
Source: Personal processing of Eurostat and UNDP available data
Note: For comparability Luxembourg was eliminated from the analysis of both economic and social convergence, given its extreme GDP per capita (in PPS) value.
Using the methodology applied by Kaitila (2004), according to which the rate of convergence
is determined by the slope of the regression equation (the β coefficient), we can assess the intensity
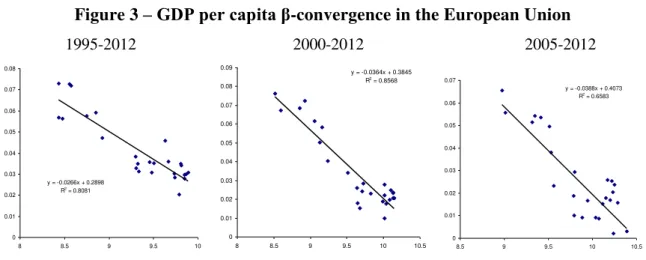
of the real economic and social convergence process. The estimated results for β parameters of the regression equations reveal that, in terms of GDP per capita, there was a convergence process that manifested more intensely in the last seven years. Thus, while the speed of the process was
approximately 0.027 (β) during 1995-2012, in the last seven years the rate was higher (0.039) and the
influence of the variable that quantifies the initial situation in the EU states (R2) was strong but on a
Figure 3 –GDP per capita β-convergencein the European Union
1995-2012 2000-2012 2005-2012
Source: Personal processing of Eurostat available data
The differences between the EU economies required investment efforts so that, through the EU Cohesion Policy, less developed MS benefited from structural funds, which allowed them to have higher growth rates compared to the developed economies. This led to a slight process of levelling the discrepancies pertaining to the economic development in the EU-27 (Bucur, 2012b).
Therefore, in the EU, during the analyzed period, there was a process of convergence in terms
of HDI, but the speed of the process was lower in the recent years due to Life Expectancy Index and, to a lesser extent, due to the GNI per capita. Thus, while the intensity of the convergence during the
main period 1995-2012 was approximately 0.022 (β), in the last seven years it was lower (0.017)
(Figure 4). The influence of the initial situation in the EU states (R2) decreased from 67.0% to 42.5%,
which signals the existence of other possible determinants.
Figure 4 –HDI β-convergencein the European Union
1995-2012 2000-2012 2005-2012
Source: Personal processing of the UNDP available data
Given the estimated results for the β parameters of the regression equation we observe that during the main period, in terms of Education Index, there was a convergence process in the EU
y = -0.0266x + 0.2898 R2 = 0.8081
0 0.01 0.02 0.03 0.04 0.05 0.06 0.07 0.08
8 8.5 9 9.5 10
y = -0.0364x + 0.3845 R2 = 0.8568
0 0.01 0.02 0.03 0.04 0.05 0.06 0.07 0.08 0.09
8 8.5 9 9.5 10 10.5
y = -0.0388x + 0.4073 R2 = 0.6583
0 0.01 0.02 0.03 0.04 0.05 0.06 0.07
8.5 9 9.5 10 10.5
y = -0.0215x + 0.0004 R2 = 0.6699 0 0.002 0.004 0.006 0.008 0.01 0.012
-0.5 -0.4 -0.3 -0.2 -0.1 0
y = -0.0219x + 0.0001 R2 = 0.7304
0 0.001 0.002 0.003 0.004 0.005 0.006 0.007 0.008 0.009
-0.4 -0.3 -0.2 -0.1 0
y = -0.0169x + 6E-05 R2 = 0.4246
0 0.001 0.002 0.003 0.004 0.005 0.006
countries, a process that manifested more intensely in recent years. Thus, while the speed of the convergence process during the period 1995-2012 was approximately 0.026 (β), in the last 7 years it was slightly higher (0.033) and the influence of the variable that quantifies the initial situation in the EU countries (R2) increased from 49.7% up to 59.1% (Figure 5).
Figure 5 –Education Index β-convergencein European Union
1995-2012 2000-2012 2005-2012
Source: Personal processing of the UNDP available data
Regarding the convergence of Life Expectancy Index in the EU countries, the estimated results of β parameters reveal the existence of a convergence process, but due to the specificity of this indicator (Life Expectancy Index undergoes significant changes over long periods of time) the speed of the convergence process was lower in recent years. Thus, while the speed of the process during the main period 1995-2012 was approximately 0.010 (β), in the last 7 years it was lower (0.008) and the influence of the variable that quantifies the initial situation in the EU countries (R2) was weak and decreased from 33.5% to 20.7% (Figure 6).
Figure 6 –Life Expectancy Index β-convergencein European Union
1995-2012 2000-2012 2005-2012
Source: Personal processing of the UNDP available data y = -0.0259x + 0.0011
R2 = 0.4972
0 0.002 0.004 0.006 0.008 0.01 0.012 0.014 0.016
-0.5 -0.4 -0.3 -0.2 -0.1 0
y = -0.0301x - 0.0002 R2 = 0.5393 0 0.002 0.004 0.006 0.008 0.01 0.012 0.014
-0.4 -0.3 -0.2 -0.1 0
y = -0.0326x - 0.0016 R2 = 0.591 0 0.002 0.004 0.006 0.008 0.01 0.012 0.014
-0.4 -0.3 -0.2 -0.1 0
y = -0.0103x + 0.0475 R2 = 0.3345
0.001 0.0015 0.002 0.0025 0.003 0.0035 0.004 0.0045 0.005
4.2 4.25 4.3 4.35 4.4
y = -0.0092x + 0.0425 R2 = 0.1949
0 0.001 0.002 0.003 0.004 0.005 0.006
4.2 4.25 4.3 4.35 4.4
y = -0.0084x + 0.0392 R2 = 0.2071 0 0.0005 0.001 0.0015 0.002 0.0025 0.003 0.0035 0.004 0.0045 0.005
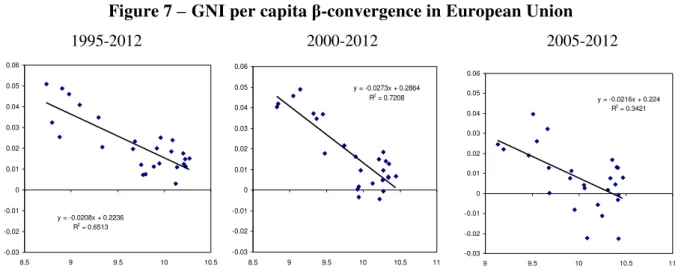
Given the estimated results for β parameters of the regression equation, the GNI per capita analysis highlights the fact that there was a process of convergence in the EU countries, whose intensity was higher in the last 12 years. Thus, while the speed of the convergence process during the period 1995-2012 was approximately 0.021 (β), in the last 7 years it was slightly higher (0.022) and
the influence of the variable that quantifies the initial situation in the EU countries (R2) decreased from 65.1% to 34.2% (Figure 7).
Figure 7 – GNI per capita β-convergencein European Union
1995-2012 2000-2012 2005-2012
Source: Personal processing of the UNDP available data
Therefore, the results obtained for regression equations, due to the negative β coefficient, allow us to state cautiously that in the European Union, between 1995-2012, there was a moderate β -convergence process in terms of economic development, while the recovery rate of disparities between the countries in terms of HDI was much slower.
We also notice a difference between the GNI per capita and GDP per capita convergence, which suggests that although the poorer EU member states attract substantial foreign investments from the developing ones, thus contributing to their economic growth, a significant part of the profits arising
from these investments does not remain in the respective nations. In this case, GNI per capita may be
a better indicator of poorer countries’ economic performance than GDP per capita, since the latter
overstates the strength of the economy.
The regression factor and the residual factor were calculated by means of the F test. The findings reveal high values of F in all the regression equations and the Sig. value of F, which was lower than 0.05 in all equations. The results of the analysis concerning the evolution of the dependent variable under the influence of the regression factor and the residual factor confirm that the connection
y = -0.0208x + 0.2236 R2 = 0.6513
-0.03 -0.02 -0.01 0 0.01 0.02 0.03 0.04 0.05 0.06
8.5 9 9.5 10 10.5
y = -0.0273x + 0.2864 R2
= 0.7208
-0.03 -0.02 -0.01 0 0.01 0.02 0.03 0.04 0.05 0.06
8.5 9 9.5 10 10.5 11
y = -0.0216x + 0.224 R2
= 0.3421
-0.03 -0.02 -0.01 0 0.01 0.02 0.03 0.04 0.05 0.06
between the variables taken into consideration is significant in the European Union during the considered periods.
Given that the Sig. value of t is lower than 0.05 for the European Union during the main and interim periods, the testing of the parameters in all regression equations (using Student Test) confirms that there is a significant connection between the considered variables. In other words, the slope of
the β regression line corresponds to a significant connection between the initial level of the two
indicators taken into consideration and their development rate during the analyzed time period, which indicates that the applied model is correct and reflects the reality.
Conclusions
In this paper, we investigated the degree of achievement and the intensity of the real economic convergence process from the point of view of the GDP per capita, in EU states (except Luxembourg) between 1995-2012, as well as the social convergence using HDI, considering the same data and period for reasons of comparability.
Compared to former studies, we focused our attention only on EU states and we approached and analyzed σ and β convergence processes from economic and social development perspectives, presenting the results in a comparative manner. Moreover, using the available data, which have been updated compared to other research in the field, we extended our study to the evolution of the convergence process with the analysis of the main components of HDI: Education Index, Life Expectancy Index and GNI per capita, in order to identify their evolution’s influence, in terms of reducing disparities between the countries.
In the context of the European Union’s evolution from the so-called core Europe to the enlarged
EU with high levels of socio-economic risk, the results of our research show that, overall, the EU members benefited from real economic as well as social convergence.
Our results confirm the neoclassical theory of economic growth and the theory formulated by Heckscher-Ohlin-Samuelson regarding international trade, according to which the poorer economies
However, the convergence process in terms of human development revealed a much lower intensity than the economic one, which gives us a much more accurate picture of the socio-economic reality in the context of the EU enlargement.
Prosperity as well as intelligent, sustainable and inclusive growth while promoting the harmonious development of the EU through a reduction in economic and social cohesion represent a
common task for all member states, which must undertake and coordinate national policies in order to achieve economic and social cohesion. It is clear that there is a series of external and internal elements that influence the development policy and strategy and which should be analyzed, quantified and exploited. A well-founded strategy prevents the persistence of disparities and, at the same time, requires the pursuit of capitalizing the EU available resources. Identified trends regarding the impact of EU Cohesion Policy, over the last twenty years, confirm that in its absence the disparity would be much stronger, especially in the context of the persistent global economic crisis, the turmoil that engulfed the intensification of the euro area and global challenges.
By intensifying the cooperation among the EU member states and by implementing national economic and social policies which encourage the human capital and investments, the EU as a whole will be able to achieve the desired level of economic convergence as well as a faster social development and better social and economic conditions in countries with lower income.
References
Aghion, P. and Howitt, P. (2004), Endogenous Growth Theory, Cambridge MIT Press.
Baumol, W.J. and Wolff, E.N. (1988), “Productivity Growth, Convergence and Welfare: Reply”,
American Economic Review, Vol. 76, Issue 5, pp. 1155-1159.
Brasili, C. and Gutierrez, L. (2004), “Regional convergence across European Union”, Development
and Comp Systems 0402002, EconWPA.
Bucur, I.A. (2012a), Convergenta si divergenta in procesul integrarii economice europene, Alexandru Ioan Cuza University Press, Iasi.
Bucur, I.A. (2012b), “National and Regional Coordinates of the Real Convergence Process Intensity
in the Enlarged European Union”, CES Working Papers,Vol. IV, Issue 3, pp.274-287.
Bucur, I.A. and Stangaciu, O.A. (2012), “Economic Growth and Improving Regional Disparities
Tools of the Enlarged European Union”, Economy Transdisciplinarity Cognition Journal,Vol.
Castro, J.V. (2004), “Indicators of Real Economic Convergence. A Primer”, UNU-CRIS e-Working
Papers, No. 2, pp. 1-25.
Crafts, N. (1999), “Economic Growth in the Twentieth Century”, Oxford Review of Economic Policy,
Oxford University Press, Vol. 15, Issue 4, pp. 18-34.
Dalgaard, C.J. and Vastrup, J. (2001), “On the measurement of sigma convergence”, Economics
Letters, Elsevier, Vol. 70, Issue 2, pp. 17-41.
Dall’erba, S. and Le Gallo, J. (2003), “Regional Convergence and the Impact of the European
Structural Funds Over 1989–1999: A Spatial Econometric Analysis”, Urban/Regional 0310005, EconWPA.
Davies, S. and Hallet, M. (2002), “Interactions between national and regional development”, HWWA Discussion PaperNo. 207, Hamburg Institute of International Economics.
Friedman, M.J. (1992), “Do Old Fallacies Ever Die?”, Journal of Economic Literature,Vol. 30, Issue
4, pp. 2129-2132.
Fujita, M. (1999), “Location and Space-Economy at half a century: Revisiting Professor Isard’s
dream on the general theory”, The Annals of Regional Science, Springer,Vol. 33, Issue 4, pp.
371-381.
Harja, E. and Stangaciu, O.A. (2009), Analiza datelor statistice folosind SPSS, Editura Alma Mater, Bacau.
Ignat, I. and Bucur, I.A. (2012), “A National Perspective on Economical and Social Convergence in
the EU-27”, in: Airinei, D. Pintilescu, C., Stoica, O., Andries, A., Viorica, D., Asandului, M. (eds.), The Proceedings of the VI-th International Conference on Globalization and Higher
Education in Economics and Business Administration GEBA 2012, Alexandru Ioan Cuza
University Press, Iasi, pp. 235-242.
Kaitila, A. (2004), “Convergence of Real GDP per capita in the EU15. How do the Accession
Countries fit in?”, Working Paper 25, European Network of Economic Policy Research
Institutes.
Konia, L. and Guisan, M.C. (2008), “What Does the Human Development Index Tell Us About
Convergence?”, Applied Econometrics and International Development, Vol. 8, Issue 1, pp.
19-40.
Krugman, P.R. (1979), “Increasing Returns, Monopolistic Competition and International Trade”,
Journal of International Economy, Vol. 9, Issue 4, pp. 469-479.
Lucas, R.E. (1988), “On the Mechanics of Economic Development”, Journal of Monetary
Marelli, E. and Signorelli, M. (2010), “Institutional, Nominal and Real Convergence in Europe”,
Banks and Bank Systems, Vol. 5, Issue 2, pp. 140-155.
Mazumdar, K. (2002), “A Note on Cross-Country Divergence in Standard of Living”, Applied
Economics Letters, Vol. 9, pp. 87-90.
McQuinn, K. and Whelan, K. (2007), “Conditional Convergence and the Dynamics of the Capital
-Output Ratio”, Journal of Economic Growth, Vol. 12, Issue 2, pp. 1-39.
Mückenberger, U. (1994), “The other side of the coin: Globalization, risk and social justice”, in:
Sengenberger, W. and Campbell, D. (eds.) International Labour Standards and Economic
Interdependence, International Institute for Labour Studies, Genf, pp. 133-141.
Noorbakhsh, F. (2006), “International Convergence or Higher Inequality in Human Development?
Evidence from 1975 to 2002”, Research Paper No. 15, United Nations University, World
Institute of Development Economics Research.
Parhi, M., Diebolt, C., Mishra, T. and Gupta, P. (2013), “Convergence dynamics of output: Do
stochastic shocks and social polarization matter?”, Economic Modelling, Vol. 30, pp. 42-51.
Pecican, E.S. (2009), “Indicatori privind convergenta reala si aplicatiile acestora”, Studii Economice 091004, National Institute of Economic Research.
Petrakos, G., Rodríguez-Pose, A. and Rovolis, A. (2003), Growth, Integration and Regional
Inequality in Europe”, ERSA Conference Papers, pp.1-25.
Quah, D. (1997), “Empirics for Economic Growth and Distribution. Polarization, Stratification and
Convergence Clubs”, Journal of Economic Growth, Vol. 2, Issue 1, pp. 27-59.
Rey, S.J. and Montouri, B.D. (1998), “US regional income convergence: a spatial econometric
perspective”, Reg Stud, No. 33, pp. 145-156.
Romer, P.M. (1986), “Increasing Returns and Long-Run Growth”, Journal of Political Economy,
Vol. 94, No. 5, pp. 1002-1027.
Sala-i-Martin, X. (1996), “The Classical Approach to Convergence Analysis”, Economic Journal, Vol. 106, pp. 1019-1036.
Solow, R.M. (1956), “A Contribution to the Theory of Economic Growth”, The Quaterly Journal of
Economics, Vol. 70, Issue 1, pp. 312-320.
Sutcliffe, B. (2004), “World Inequality and Globalization”, Oxford Review of Economic Policy, Vol.
20, pp. 15-37.
Swan, T.W. (1956), “Economic Growth and Capital Accumulation”, Economic Record, No. 32, pp.
Venables, A.J. (1996), “Equilibrium locations of vertically linked industries”, International
Economic Review, Vol. 37, Issue 2, pp. 341-359.
Williamson, J.G. (1965), “Regional inequality and the process of national development: a description
of the patterns”, Economic and Cultural Change, No. 13, pp. 1-84.
Zd’arek, V. and Sindel, J. (2007), “Real and Nominal Convergence and the New EU Member States