1(Trabalho 138-12). Recebido em:10-04-2012. Aceito para publicação em:18-10-2012. Part of the Ph.D. thesis by the senior author. 2Pós-Graduanda, Departamento de Solos e Adubos, Unesp, Universidade Estadual Paulista. Bolsa Sanduiche CAPES, junto a Univer-sité Laval, Québec, Canada. E-mail: [email protected]
3ERSAM, Department of Soils and Agrifood Engineering, Université Laval, Québec (Qc), Canada G1V 0A6. E-mail: serge-etienne. [email protected]; [email protected]
4Professor Adjunto, Departamento de Solos e Adubos, Unesp, Universidade Estadual Paulista, 14870-000, Jaboticabal, São Paulo, Brasil. E-mail: [email protected]
BALANCING GUAVA NUTRITION WITH LIMING
AND FERTILIZATION
1AMANDA HERNANDES2, SERGE-ÉTIENNE PARENT3,
WILLIAM NATALE4,LÉON ÉTIENNE PARENT3
ABSTRACT – Guava response to liming and fertilization can be monitored by tissue testing. Tissue nu-trient signature is often diagnosed against nunu-trient concentration standards. However, this approach has been criticized for not considering nutrient interactions and to generate numerical biases as a result of data redundancy, scale dependency and non-normal distribution. Techniques of compositional data analysis can control those biases by balancing groups of nutrients, such as those involved in liming and fertilization. The
sequentially arranged and orthonormal isometric log ratios (ilr) or balances avoid numerical bias inherent to
compositional data. The objectives were to relate tissue nutrient balances with the production of “Paluma” guava orchards differentially limed and fertilized, and to adjust the current patterns of nutrient balance with the range of more productive guava trees. It was conducted one experiment of 7-yr of liming and three ex-periments of 3-yr with N, P and K trials in ‘Paluma’ orchards on an Oxisol. Plant N, P, K, Ca and Mg were monitored yearly. It was selected the [N, P, K | Ca, Mg], [N, P | K], [N | P] and [Ca | Mg] balances to set apart
the effects of liming (Ca-Mg) and fertilizers (N-K) on macronutrient balances. Liming largely inluenced nutrient balances of guava in the Oxisol while fertilization was less inluential. The large range of guava yields and nutrient balances allowed deining balance ranges and comparing them with the critical ranges
of nutrient concentration values currently used in Brazil and combined into ilr coordinates.
Index terms: Psidium guajava, compositional data analysis, isometric log ratios (ilr), plant mineral nutri-tion, Aitchison geometry.
EQUILÍBRIO NUTRICIONAL DE GOIABEIRAS A PARTIR
DA CALAGEM E ADUBAÇÃO
RESUMO – A resposta da goiabeira à calagem e à adubação pode ser monitorada por análises de tecido
vegetal. O peril nutricional é deinido em relação a padrões de teores de nutrientes. No entanto, os teores de nutrientes-padrão são constantemente criticados por não considerarem as interações que ocorrem entre
nutrientes e por gerarem tendências numéricas, decorrentes da redundância dos dados, da dependência de escala e da distribuição não normal. As técnicas de análise composicional de dados podem controlar esses dados tendenciosos, equilibrando os grupos de nutrientes, tais como os envolvidos na calagem e na
adubação. A utilização das relações log isométricas (ilr) ortonormais, sequencialmente dispostas, evita ten-dências numéricas inerentes aos dados de composição. Os objetivos do trabalho foram relacionar o balanço de nutrientes dos tecidos vegetais com a produção de goiabeiras em pomares de ‘Paluma’ diferentemente
corrigidos e adubados, e ajustar os atuais padrões de nutrientes com a faixa de equilíbrio das goiabeiras
mais produtivas. Um experimento de calagem de sete anos e três, experimentos de três anos com doses de
N, P2O5 e K2O, foram conduzidos em pomares de goiabeiras ‘Paluma’ em um Latossolo Vermelho-Amarelo.
Os teores de N, P, K, Ca e Mg na planta foram monitorados anualmente. Selecionaram-se os balanços [N, P, K | Ca, Mg], [N, P | K], [N | P] e [Ca | Mg] para separar os efeitos da calagem (Ca-Mg) e dos fertilizantes
(N-K) nos balanços de macronutrientes. Os balanços foram mais inluenciados pela calagem do que pela fertilização. A produtividade das goiabeiras e seu balanço nutricional permitiram a deinição de faixas de equilíbrio de nutrientes e sua validação com as faixas de concentrações críticas atualmente utilizadas no
Brasil e combinadas em coordenadas ilr.
INTRODUCTION
Brazil is the world’s largest producer of red
guava (Psidium guajava L.), a fruit native to South
and Central America. Guava is consumed fresh or transformed into jelly and juice. Fruits of the culti-var Paluma are oval, tasty, with an average weight
of 140-250 grams, yellow skin, and red pulp, irm,
resistant to transportation and storage, and suitable for both transformation and the fresh market.
Guava is responsive to liming (PRADO; NATALE, 2004, 2008; NATALE et al., 2005; NA-TALE et al., 2007) and fertilization (NANA-TALE et al., 1996; NATALE et al., 2002a; ANJANEYULU; RAGHUPATHI, 2009). To achieve nutrient balance, liming and fertilization should be balanced accord-ingly. Guava response to liming and fertilization can be monitored by tissue testing. Tissue analysis has advantage over surface soil analysis as diagnostic tool for a deep rooted fruit crops because the plant have access to nutrient deeper in the soil than would be found through normal soil analytical procedures and is gaining in popularity (NATALE et al., 2002a). The interpretation of plant tissue analyses is based on the contention that changes in nutrient
supply are relected in the nutrient composition of
the diagnostic tissue and are more pronounced at certain stages of the plant development than at others (BOULD, 1968). However, nutrient concentration standards were criticized for not accounting for nu-trient interactions (BATES, 1971) since several dual and multiple interactions have been well documented in plants (MALAVOLTA, 2006). The Diagnosis and Recommendation Integrated System (DRIS) using dual ratios or products may account in part for nutri-ent interactions (WALWORTH; SUMNER, 1988) but
is geometrically deicient (PARENT, 2011). Parent and Dair (1992) adjusted the DRIS procedure to it into the centred log ratio transformation used to
analyze compositional data such tissue concentration data (AITCHISON, 1986).
Plant tissue data convey relative information and are intrinsically multivariate since each compo-nent cannot be interpreted without relating it to any of the other components (TOLONASA-DELGADO; BOOGART, 2011). Lagatu and Maume (1935) were
the irst to illustrate the effect of changing the propor -tions of interacting nutrients in a closed system by a ternary diagram representing a three-component
mixture system constrained to 100%. A D-part
compositional vector contains one redundant part as computed by difference between some whole and the other parts; as a result, there is at least one
nega-tive correlation (AITCHISON, 1986) and D-1 non
redundant variables (EGOZCUE; PAWLOWSKY-GLAHN, 2005). In addition, there are three dual ratios in a D-part compositional, but one is redundant as computed from the two others, i.e. K/Ca = [(K/ Mg)/(Ca/Mg)].
To avoid numerical bias inherent to
compo-sitional data and generate D-1 variables, Egozcue
and Pawlowski-Glahn (2005) proposed using se-quentially arranged and orthonormal isometric log
ratios (ilr) based on the principle of orthogonality.
The ilr coordinates can be projected into the
Eu-clidean space, a geometrical framework that allows
computing statistics without numerical bias. The ilr
method is conducted in three steps: representation
of data in ilr coordinates, variance analysis of the
coordinates as real random variables, and interpreta-tion of the results in terms of balances (EGOZCUE;
PAWLOWSKY-GLAHN, 2011). The ilr concept
was tested successfully in plant nutrition (PARENT, 2011), as well as studies in soil aggregation (PAR-ENT et al., 2012).
The objective was to compare the effects of liming and N-P-K fertilization on tissue macronutri-ent (N, P, K, Ca, Mg) balances of ‘Paluma’ guava
us-ing the unbiased ilr approach and nutrient standards
currently used in Brazil.
MATERIAL AND METHODS
Lime experiment
A liming experiment was conducted by Natale et al. (2007) and Prado and Natale (2008) with ‘Paluma’ during seven years (1999-2006) at Bebedouro (São Paulo) on a moderate, medium texture, alic, typical dystrophic, Haplustox (EMBRAPA, 2006). There were 5 liming rates replicated 4 times and arranged in a randomized block design. The limestone was incorporated into the soil in August 1999 and the one-year old ‘Paluma’ seedlings propagated from cuttings were planted in December 1999. The treatments consisted of increasing rates of limestone up to expected base saturation (EBS) of 70% considered adequate for guava (SANTOS; QUAGGIO, 1996). Lime rates
were calculated for the 0-30 cm layer as follows: D0
= zero limestone; D1 = half the dose to reach EBS of
70%, D2 = dose to reach EBS of 70%, D3 = 1.5 times
the dose to reach EBS of 70% and D4 = 2 times the
dose to reach EBS of 70%, corresponding to 0.0, 1.9,
3.8, 5.6 and 7.4 ton ha-1 of limestone, respectively.
The limestone contained 455.5 g kg-1 of CaO and
102.1 g kg-1 of MgO (Ca/Mg molar ratio of 3.2).
Relative eficiency (grain size distribution of liming
1226
106.85%. Lime was manually applied uniformly over the entire area, one half before incorporation with a moldboard plow and the other half followed by incorporation with a disc harrow.
Each 7 m by 4.2 m plot comprised ive plants
of which three were monitored. Fertilizer additions
tree-1 were 140 g N and 112g K
2O in the 1
st year; 200
g N and 50 g K2O in the 2nd year; 200 g N, 30 g P 2O5
and 150 g K2O in the 3rd year; 400 g N, 60 g P 2O5 and
300 g K2O in the 4th year; 800 g N, 50 g P
2O5 and 300
g K2O in the 5th year; 800 g N, 50 g P
2O5 and 300 g
K2O in the 6th year. Fertilizers were applied at 3 to 4
occasions during the growing season. In the 2nd, 3rd
and 4th years, bovine compost (no chemical analysis
provided) was added at a rate of 40 L tree-1. Fertilizer
sources were urea and ammonium sulfate (1:1), either triple superphosphate or mono-ammonium phosphate, and potassium chloride. The fertilizers were broadcast around the plant in a band 40 cm wide beyond crown projection. Each year from 2002 to 2006, yield, number and weight of fruits were determined weekly and, occasionally, 2-3 times per week during the harvest period that extended from January/February to May/June.
Fertilizer trials
Three multi-year fertilizer trials with NPK were conducted at São Carlos in the state of São Paulo, Brazil, on a Red-Yellow Oxisol, epieutrophic, endodystrophic, of moderate, medium texture, cerrado phase and relief plan. A series of N-P-K fertilizer experiments were started in April/May 1989 with one-year old ‘Paluma’ seedlings propagated from cuttings and conducted for three consecutive years. Plots consisted of four fertilized trees of which
the irst was the guard tree each covering 7 m x 5 m.
Three areas received varying rates of N, P2O5 and K2O fertilizers that were arranged in randomized blocks with seven treatments and four replications. Fertilizer rates were varied to account for nutrient removal by harvest and to alter the nutrient balance.
The 1st year , N treatments were 0, 30, 60,
120, 180, 240 and 300 g tree -1 of N, supplemented
with 120 g tree -1 of P
2O5 and 120 g tree -1of K
2O. The
2nd year , N treatments were 0, 60, 120, 240, 360, 480
and 600 g tree -1 of N, supplemented with 240 g tree
-1 of P
2O5 and 240 g tree -1of K
2O. The 3
rd year , N
treatments were 0, 90, 180, 360, 540, 720 and 900 g tree -1 of N, supplemented with 240 g tree -1 of P
2O5
and 360 g tree -1of K 2O.
The 1st year, P treatments were 0, 30, 60,
120, 180, 240 and 300 g tree -1 of P
2O5, supplemented
with 120 g tree -1 of N and 120 g tree -1of K
2O. The
2nd year, P treatments were 0, 60, 120, 240, 360, 480
and 600 g tree -1 of P
2O5, supplemented with 240 g
tree -1 of N and 240 g tree -1of K
2O. The 3
rd year, P
treatments were 0, 60, 120, 240, 360, 480 and 600 g tree -1 of P
2O5, supplemented with 360 g tree
-1 of
N and 360 g tree -1of K 2O.
The 1st year, K treatments were 0, 30, 60,
120, 180, 240 and 300 g tree -1of K
2O, supplemented
with 120 g tree -1 of N and 120 g tree -1 of P
2O5. The
2nd year, K treatments were 0, 60, 120, 240, 360, 480
and 600 g tree -1of K
2O, supplemented with 240 g
tree -1 of N and 240 g tree -1 of P
2O5. The 3
rd year, K
treatments were 0, 90, 180, 360, 540, 720 and 900 g tree -1of K
2O, supplemented with 360 g tree
-1 of N
and 240 g tree -1 of P 2O5.
In N trials, the sources of N, P and K used were ammonium nitrate (34% N), simple
superphosphate (18% P2O5) and potassium chloride
(60% K2O), respectively. In P and K trials, the
sources of N, P and K used were ammonium sulfate
(20% N), triple superphosphate (44% P2O5) and
potassium chloride (60% K2O), respectively. The
fertilizers were broadcast around the plant in a band 40 cm wide beyond crown projection.
Soil and tissue sampling and analysis
Soils were sampled at four locations per tree in the 0-20 cm at the onset of the experiments and composited per plot. Soil samples were air dried
and analyzed for pH CaCl2, organic matter content,
K, Ca, Mg and (H+Al) (RAIJ et al., 1987). Soil analyses are presented in Table 1. Thirty pairs of
mature leaf blades and petioles (3rd from shoot tip)
were collected at full bloom 1.5 m aboveground, as described by Natale et al. (1996). Tissue samples
were oven-dried at 65oC and analyzed for N, P, K,
Ca and Mg according to Bataglia et al. (1983). The N was determined by microKjeldahl. The P was
quantiied by colorimetry and cations by atomic
absorption spectrophotometry, after nitric-perchloric digestion.
Nutrient balances
Isometric log ratio transformation
Each ilr coordinate was computed as follows
(EGOZCUE; PAWLOWSKY-GLAHN, 2005):
eq.1
Where ilrj is the jth isometric log ratio, r and s
represent number of components in plus (+) and
minus (–) groups, respectively, g (c+) is geometric
mean of components in the plus group c+ and g (c- ) is geometric mean of components in the minus group
c- . Coeficient is the balance between the
number of components in the plus and minus groups.
Statistical analysis
Variance analyses were conducted using
PROC MIXED in SAS vs. 9.2. The ilr computations
and discriminant analyses were conducted in the R statistical computing environment and the compositions package (BOOGART; TOLOSANA-DELGADO, 2008). Critical balance ranges were derived from nutrient concentration standards of
Natale et al. (2002a) and Maia et al. (2007). Briely,
concentration lower limits were rationed using the smallest values at numerator and the highest ones at denominator. Upper limits were obtained by rationing the highest concentration values at numerator and the smallest ones at denominator. Natale et al. (2002b) proposed concentration ranges
of 20-23 g kg-1 of N, 1.4-1.8 g kg-1 of P, 14-17 g
kg-1 of K, 7-11 g kg-1 of Ca, and 3.4-4.0 g kg-1 of
Mg at full bloom. Maia et al. (2007) suggested
concentration ranges of 20.2-25.3 g kg-1 of N,
1.4-1.5 g kg-1 of P, 19.0-21.7 g kg-1 of K, 7.7-8.3 g kg-1
of Ca, and 2.7-2.8 g kg-1 of Mg in leaves between
bud break and fruit set.
RESULTS AND DISCUSSION
Yield response to lime and fertilizers
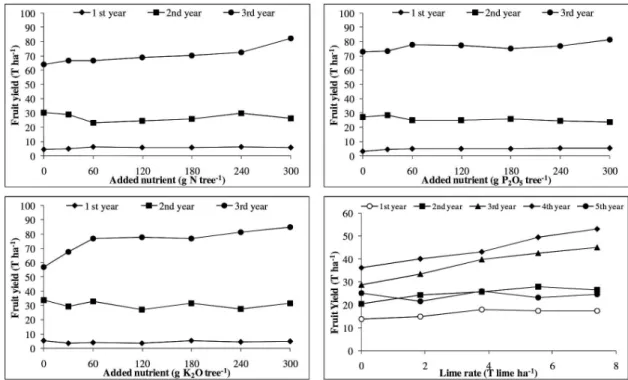
Guava yield increased rapidly during the
irst three years of establishment, reached maximum
production thereafter, then declined probably due to alternate bearing (ISAGI et al., 1997). Yield potential was higher in the fertilizer than in the lime experiment (Figure 1). Guava responded
signiicantly to liming in all years but 2006 with
significant linear trend in 2002-2004-2005 and
quadratic trend in 2003; and to added N and K2O
in the 3rd year only (linear trend). The guava crop
generally shows little response to added P2O5 under Brazilian conditions (NATALE et al., 2002b). The
linear yield increase with added N, although modest
up to 240 g tree-1 of N, was probably indicative of a
competition between soil microbes and the plant for available N as related to rapid soil organic matter turnover rate under tropical conditions (KRULL, 2002) and the associated decrease in C/N ratio (ZHANG; HE, 2004). The trials provided a large spectrum of fruit yields and tissue nutrient balances over the years.
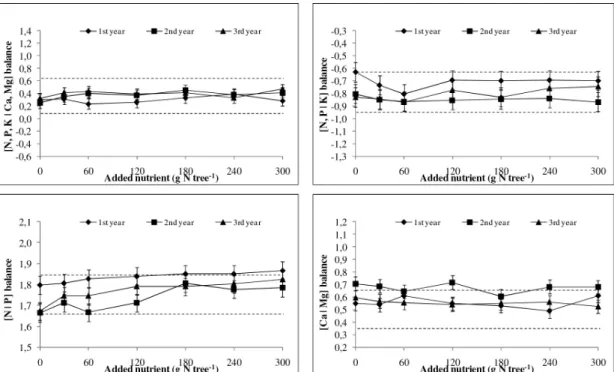
Critical balance ranges
Nutrient balance ranges obtained by combining nutrient concentration standards of Natale et al. (2002b) and Maia et al. (2007) are presented in Table 3. The balance ranges computed from Maia et al. (2007) were outside the range of balances of our topmost yielding trees (Figure 2). In particular, the [N, P, K | Ca, Mg], [N | P] and [Ca | Mg] balances were too high as driven by lower Ca, Mg and P and higher K leaf concentrations. Standards derived from Natale et al. (2002b) appeared to be adequate for the [N, P, K | Ca, Mg] and [N, P | K] balances but could be adjusted for the [N | P] and [Ca | Mg] balances, as suggested in Table 3.
Seasonal variations in nutrient balances are presented in Figures 3-6. The N balances did not
appear to be limitative (Figure 3) despite signiicant
yield response to added N the 3rd year at high yield
level (Figure 1). The P was not deficient either (Figure 4). The K began to be limitative after 3
consecutive years without K2O addition as shown by
the excessively high [N, P | K] balance (Figure 5).
The guava is generally responsive to K2O additions
(NATALE et al., 1996) because the crop extracts 1,554
g ton-1 (Fresh Fruit) of K (NATALE et al., 2002b). In
comparison, other guava cultivars were reported to
extract 726 to 3,130 g ton-1 (Fresh Fruit) of K (HAAG
et al., 1993; NATALE et al., 2002b). As a result, 80 ton ha-1 of ‘Paluma’ fruits extracts 124 kg ha-1 of K or
nearly 150 kg ha-1 of K
2O. Since crop response and
nutrient balance were satisfactory with K applications of 30-60 g tree-1 of K
2O, the soil K reserves appeared
to largely support crop K requirements at high yield level. Natale et al. (2001) showed that feldspar in the silt fraction and micas in the clay fraction contributed most to total soil K in a Brazilian Oxisol under guava production. The high surface charge density of kaolinite that enhances K dehydration also results in
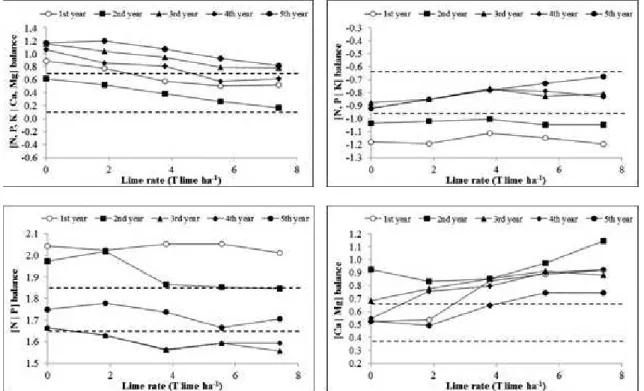
a high afinity of kaolinite for K (LEVY et al., 1988). Cases of nutrient imbalance occurred during
the irst two years of harvest in the lime experiment
1228
guava plants is very sensitive to soil acidity (PRADO; NATALE, 2004). The [N, P, K | Ca, Mg] balance
was improved the 5th year after liming at high rate
due to increasing Ca and Mg availability. The [N, P | K] and [N | P] reached close to the adjusted Natale et al. (2002b) balance range the 2nd year after
liming, indicating a positive effect of liming on P and K availability. The [Ca | Mg] balance was above optimum range except in year 5 when lime rate did
not exceed 3.8 ton ha-1 (treatment D2). Although the
lime contained both Ca and Mg, the Ca/Mg ratio was apparently too high. Although a lime rate of 3.8 ton ha-1 may sufice to reach high guava yield and proper
nutrient balance, a higher lime rate may be necessary when high rates of ammonium-based fertilizers are
applied. Natale et al. (2007) and Prado and Natale (2004) recommended to maintain base saturation of
CEC close to 55% and pH CaCl2 above 5.3 during
at least 40 months with a minimum lime rate of 5.6 t ha-1.
To conclude, guava yield and nutrient balance across a large spectrum of liming and fertilization regimes allowed defining balance ranges that appeared to differ from current nutrient norms either at lower or upper boundaries. The crop appeared most responsive to K and lime. Liming appeared to be of utmost importance in the mineral
nutrition of guava, as shown by greater inluence than
fertilization on yearly variation of nutrient balances. However, the Ca and Mg balance in liming materials must be adjusted to plant requirements.
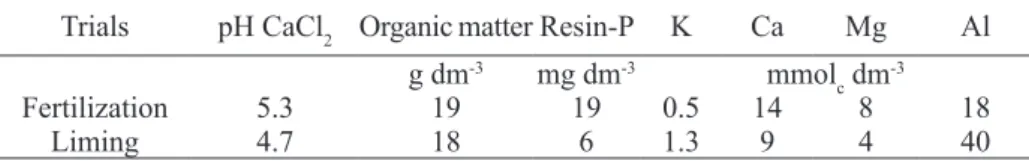
TABLE 1- Soil properties at the onset of experiments.
Trials pH CaCl2 Organic matter Resin-P K Ca Mg Al
g dm-3 mg dm-3 mmol
c dm -3
Fertilization 5.3 19 19 0.5 14 8 18
Liming 4.7 18 6 1.3 9 4 40
1r = number of positive signs and s = number of negative signs.
TABLE 3 - Optimum nutrient balance ranges(LL = lower limit and UL = upper limit)for Natale et al.
(2002a) and Maia et al. (2007) nutrient suficiency ranges for guava
Balance Nutrient balance range
Natale et al. (2002a) Maia et al. (2007) Adjusted Natale et al. (2002a)
LL UL LL UL LL UL
[N, P, K | Ca, Mg] 0.108 0.658 0.572 0.789 0.108 0.658
[N, P | K] -0.953 -0.635 -1.148 -0.920 -0.953 -0.635
[N | P] 1.703 1.979 1.839 2.047 1.65 1.85
[Ca | Mg] 0.396 0.830 0.715 0.794 0.35 0.65
FIGURE 1- Yield response of ‘Paluma’ guava to N-P-K fertilization and liming.
† N and K Dose: 1st year was 0, 30, 60, 120, 180, 240 and 300 g N and K 2O tree
1230
FIGURE 2- Relationship between nutrients balance and yield of ‘Paluma’ at full bloom. Arrows are nutrient balance ranges computed from Natale (2002b) (full arrows) and Maia et al. (2007) (dashed arrows).
FIGURE 3 - Response of plant nutrient balances to added N with time (dosage doubled and tripled the 2nd
FIGURE 4- Response of plant nutrient balances to added P with time (dosage doubled and tripled the 2nd
and 3rd years, respectively). Dotted lines indicate the critical balance range.
FIGURE 5- Response of plant nutrient balances to added K with time (dosage doubled and tripled the 2nd
1232
FIGURE 6 - Time change of nutrients balances at full bloom in the ‘Paluma’ limestone trial. Dotted lines indicate the critical balance range.
REFERENCES
AITCHISON, J. The statistical analysis of
compositional data. London: Chapman & Hall, 1986. 416 p.
ANJANEYULU, K.; RAGHUPATHI, H. B.
Identiication of yield-limiting nutrients through
DRIS leaf nutrient norms and indices in guava (Psidium guajava). Indian Journal of Agricultural Sciences, New Delhi, v. 79, p. 418-421, 2009.
BATAGLIA, O. C.; FURLANI, A. M. C.; TEIXEIRA,
J. P. F.; FURLANI, P. R.; GALLO, J. R. Métodos
de análise química de plantas. Campinas: Instituto Agronômico, 1983. 48 p.
BATES, T. E. Factors affecting critical nutrient concentrations in plants and their evaluation: a
review. Soil Science,Baltimore, v. 112, p. 116-130,
1971.
BOOGAART, K. G. van den; TOLOSANA-DELGADO, R. “Compositions”: a unified R
package to analyze compositional data. Computers
& Geosciences, Stanford, v. 34, p. 320-338, 2008.
BOULD, C. Leaf analysis as a diagnostic method
and advisory aid in crop production. Experimental
Agriculture, Dundee, v. 4, p. 17-27, 1968.
EGOZCUE, J. J.; PAWLOWSKY-GLAHN, V. Análisis composicional de datos en Ciencias
Geoambientales. Boletín Intituto Geológico y
Minero, Madrid, v. 122, p. 439-452, 2011.
EGOZCUE, J. J.; PAWLOWSKY-GLAHN, V. Groups of parts and their balances in compositional
data analysis. Mathematical Geology,New York,
v. 37, p. 795-828, 2005.
EMBRAPA. Sistema Brasileiro de classiicação de
solos. 2. ed. Rio de Janeiro: Embrapa Solos, 2006. 306 p.
HAAG, H. P.; MONTEIRO, F. A.; WAKAKURI, P. Y. Frutos de goiaba: desenvolvimento e extração de
nutrientes. Scientia Agricola, Piracicaba, v. 50, p.
413-418, 1993.
ISAGI, Y.; SUGIMURA, K.; SUMIDA, A.; ITO, H. How does masting happen and synchronize?.
KRULL, E. Soil organic matter decomposition and
turnover in a tropical Ultisol: evidence from δ13C,
δ15N and geochemistry. Radiocarbon, Tucson, v.
44, p. 93-112, 2002.
LAGATU, H.; MAUME, L. The variations of the
sum N+P2O5+K2O per 100 parts of dry material of
the leaf of a cultivated plant. Comptes Rendus de
l’Académie D’Agriculture de France, Paris, v. 21, p. 85-92, 1935.
LEVY, G. J.; WATT, H. V. H. van der; SHAINBERG, I.; PLESSIS, H. M. du. Potassium-calcium and sodium-calcium exchange on kaolinite and kaolinitic
soils. Soil Science Society of America Journal,
Madison, v. 52, p. 1.259-1.264, 1988.
MAIA, J. L. T.; BASSOI, L. H.; SILVA, D. J.; LIMA, M. A. C. D.; ASSIS, J. S. D.; MORAIS, P. L. D. D. Assessment on nutrient levels in the aerial biomass of irrigated guava in São Francisco valley, Brazil.
Revista Brasileira de Fruticultura, Jaboticabal, v. 29, p. 705-709, 2007.
MALAVOLTA, E. Manual de nutrição de plantas.
São Paulo: Ceres, 2006. 638 p.
NATALE, W.; COUTINHO, E. L. M.; BOARETTO, A. E.; BANZATTO, D. A. Nutrient foliar content for high productivity cultivars of guava in Brazil.
Acta Horticulturae, Wageningen, v. 594, p. 383-386, 2002b.
NATALE, W.; COUTINHO, E. L. M.; BOARETTO, A. E.; BANZATTO, D. A. Phosphorus foliar
fertilization in guava trees. Acta Horticulturae,
Wageningen, v. 594, p. 171-177, 2002a.
NATALE, W.; COUTINHO, E. L. M.; BOARETTO, A. E.; PEREIRA, F. M. Effect of potassium
fertilization in ‘Rica’ guava cultivation. Indian
Journal of Agricultural Sciences, New Delhi, v. 66, p. 201-207, 1996.
NATALE, W.; JÚNIOR, J. M.; BOARETTO, A. E.; SIMÕES, F. L. Mineralogy and forms of potassium
in Red Yellow Latosol of a guava (Psidium guajava)
tree orchard. Indian Journal of Agricultural
Sciences, New Delhi, v. 71, p. 166-170, 2001.
NATALE, W.; PRADO, R. M.; MÔRO, F. V.
Alterações anatômicas induzidas pelo cálcio na
parede celular de frutos de goiabeira. Pesquisa
Agropecuária Brasileira, Brasília, v. 40, p.
1.239-1.242, 2005.
NATALE, W.; PRADO, R. M.; ROZANE, D. E.; ROMUALDO, L. M. Efeitos da calagem na fertilidade do solo e na nutrição e produtividade da
goiabeira. Revista Brasileira de Ciência do Solo,
Viçosa, MG, v. 31, p. 1.475-1.485, 2007.
PA R E N T, L . E . D i a g n o s i s o f t h e n u t r i e n t
compositional space of fruit crops. Revista Brasileira
de Fruticultura, Jaboticabal, v. 33, p. 321-334, 2011.
PARENT, L. E.; ALMEIDA, C. X. de; HERNANDES, A.; EGOZCUE, J. J.; GÜLSER, C.; BOLINDER, M. A.; KÄTTERER, T.; ANDREN, O.; PARENT, S. E.; ANCTIL, F.; CENTURION, J. F.; NATALE, W. Compositional analysis for an unbiased measure of
soil aggregation. Geoderma, Amsterdam, v. 179, p.
123-131, 2012.
PARENT, L. E.; DAFIR, M. A theoretical concept
of compositinal nutrient diagnosis. Journal of the
American Society for Horticultural Science, Mount Vernon, v. 117, p. 239-242, 1992.
PRADO, R. M.; NATALE, W. Calagem na nutrição de cálcio e no desenvolvimento do sistema radicular
da goiabeira. Pesquisa Agropecuária Brasileira,
Brasília, v. 39, p. 1007-1012, 2004.
PRADO, R. M.; NATALE, W. Effect of liming on the mineral nutrition and yield of growing guava trees
in a typic Hapludox soil. Communications in Soil
Science and Plant Analysis, Philadelphia, v. 39, p. 2191-2204, 2008.
RAIJ, B. van; QUAGGIO, J. A.; CANTARELLA, H.; FERREIRA, M. E.; LOPES, A. S.; BATAGLIA, O. C. Análise química do solo para ins de fertilidade. Campinas: Fundação Cargill, 1987. 170 p.
SANTOS, R. R.; QUAGGIO, J. A. Goiaba. In: RAIJ, B.van; CANTARELLA, H.; QUAGGIO, J.
A.; FURLANI, A. M. C. (Ed.). Recomendações de
adubação e calagem para o Estado de São Paulo.
1234
TOLOSANA-DELGADO, R.; BOOGART, K. G van den. Linear models with compositions in R. In: PAWLOWSKY-GLAHN, V.; BUCCIANTI, A.
(Ed.). Compositional data analysis: theory and
applications. New York: John Wiley and Sons, 2011. p. 356-371.
WALWORTH, J. L.; SUMNER, M. E. Foliar
diagnosis: a review. Advances in Plant Nutrition,
New York, v. 539, p. 193-240, 1988.
ZHANG, M.; HE, Z. Long-term changes in organic carbon and nutrients of an Ultisol under rice cropping
in southeast China. Geoderma, Amsterdam, v. 118,