Multi-Scale Genomic, Transcriptomic and
Proteomic Analysis of Colorectal Cancer Cell
Lines to Identify Novel Biomarkers
Romina Briffa1, Inhwa Um2, Dana Faratian1, Ying Zhou1, Arran K. Turnbull1, Simon P. Langdon1*, David J. Harrison2
1Division of Pathology, Institute of Genetics and Molecular Medicine, University of Edinburgh, Crewe Road South, Edinburgh, EH4 2XU, United Kingdom,2School of Medicine, University of St Andrews, St Andrews, KY16 9TF, United Kingdom
Abstract
Selecting colorectal cancer (CRC) patients likely to respond to therapy remains a clinical challenge. The objectives of this study were to establish which genes were differentially expressed with respect to treatment sensitivity and relate this to copy number in a panel of 15 CRC cell lines. Copy number variations of the identified genes were assessed in a cohort of CRCs. IC50’s were measured for 5-fluorouracil, oxaliplatin, and BEZ-235, a PI3K/mTOR inhibitor. Cell lines were profiled using array comparative genomic hybridisation, Illumina gene expression analysis, reverse phase protein arrays, and targeted sequencing ofKRAS
hotspot mutations. Frequent gains were observed at 2p, 3q, 5p, 7p, 7q, 8q, 12p, 13q, 14q, and 17q and losses at 2q, 3p, 5q, 8p, 9p, 9q, 14q, 18q, and 20p. Frequently gained regions containedEGFR,PIK3CA,MYC,SMO,TRIB1,FZD1, andBRCA2, while frequently lost regions containedFHITandMACROD2.TRIB1was selected for further study. Gene enrich-ment analysis showed that differentially expressed genes with respect to treatenrich-ment
response were involved in Wnt signalling, EGF receptor signalling, apoptosis, cell cycle, and angiogenesis. Stepwise integration of copy number and gene expression data yielded 47 candidate genes that were significantly correlated.PDCD6was differentially expressed in all three treatment responses. Tissue microarrays were constructed for a cohort of 118 CRC patients andTRIB1andMYCamplifications were measured using fluorescencein situ
hybridisation.TRIB1andMYCwere amplified in 14.5% and 7.4% of the cohort, respectively,
and these amplifications were significantly correlated (p0.0001).TRIB1protein expression
in the patient cohort was significantly correlated with pERK, Akt, and Caspase 3 expression. In conclusion, a set of candidate predictive biomarkers for 5-fluorouracil, oxaliplatin, and BEZ235 are described that warrant further study. Amplification of the putative oncogene
TRIB1has been described for the first time in a cohort of CRC patients.
OPEN ACCESS
Citation:Briffa R, Um I, Faratian D, Zhou Y, Turnbull AK, Langdon SP, et al. (2015) Multi-Scale Genomic, Transcriptomic and Proteomic Analysis of Colorectal Cancer Cell Lines to Identify Novel Biomarkers. PLoS ONE 10(12): e0144708. doi:10.1371/journal. pone.0144708
Editor:Hiromu Suzuki, Sapporo Medical University, JAPAN
Received:June 16, 2015
Accepted:November 23, 2015
Published:December 17, 2015
Copyright:© 2015 Briffa et al. This is an open access article distributed under the terms of the Creative Commons Attribution License, which permits unrestricted use, distribution, and reproduction in any medium, provided the original author and source are credited.
Data Availability Statement:All relevant data are within the paper and its Supporting Information files.
Introduction
Colorectal cancer (CRC) accounts for 8% of all cancer deaths [1], with variable survival of between 39% and 65% depending on stage at diagnosis [2]. The risk of developing CRC is dependent on both genetic and lifestyle-related factors and increases markedly with age [2]. Although treatment can be curative, a considerable proportion of CRC patients have a high risk of disease recurrence after surgery and chemotherapy [3].
The major pathways implicated in colorectal carcinogenesis include, but are not limited to, the PI3K/mTOR pathway, the mitogen-activated protein kinases (MAPK) pathway, and the Wnt
pathway [4], with the JAK/STAT pathway, Hedgehog pathway, and NFκB pathway also involved
[5]. These pathways are controlled via complex crosstalk, negative feedback, and other compen-satory mechanisms. While activation of these pathways occurs via mutations in participating oncogenes and tumor suppressor genes, respectively, of the 80 somatic mutations in any individ-ual CRC, only 15 or possibly less are likely to be essential drivers of tumor initiation, progression,
and/or maintenance [6]. The most frequently mutated genes in CRC areAPC(70–80%),TP53
(50%),KRAS(35–45%),PIK3CA(25–32%),BRAF(10–17%) andPTEN(4–5%) [7–12].
First line therapy for CRC is usually fluoropyramidine monotherapy and oxaliplatin or iri-notecan-based chemotherapy [13]. More recently, monoclonal antibodies such as cetuximab, panitumumab, and bevacizumab have been licensed in combination with chemotherapy for metastatic CRC (mCRC) [14] as selective and specific anticancer agents with a high therapeutic index and lower toxicity than conventional therapies [15]. However, responses to treatment are varied, with less than one-third of patients responding to 5-fluorouracil [16]. Although
KRASandBRAFmutations indicate resistance to EGFR-targeted therapies, about 40–70% of
wild typeKRASmCRC patients derive little or no benefit from EGFR-targeted therapies [17].
There remains a lack of predictive markers that allow clinicians to select patients most likely to benefit from a specific therapy.
Here, we sought to systematically characterize a panel of CRC cell lines, selected to reflect the diversity of this disease, using high-throughput analyses in order to identify biomarkers of resistance to both targeted and non-targeted therapies.
Methods
CRC cell line panel
Fifteen CRC cell lines were studied: the near diploid cell lines DLD-1, HCT116, HCT116p53-/-, SW48HCT116p53-/-, and LoVo (all from ECACC except HCT116p53-/- which was a gift from Dr G SmithHCT116p53-/-, University of Dundee, UK [18]) and the aneuploid cell lines SW480, SW837, HT29, T84, Colo 201, Colo 320DM, LS411N, SK-CO-1, NCI H508 and NCI H716 (all from ATCC) apart from Colo 320DM, T84, and SW837 (all from ECACC).
The cell lines were cultured in Dulbecco’s modified Eagle’s medium (DMEM) (Gibco1,
Cat. no. 31885) supplemented with 10% foetal bovine serum (FBS; PAA, Cat. no. A15-101)
and 1% penicillin-streptomycin (Gibco1, Cat. no.15140-122). The cell lines were grown in a
humidified incubator at 37°C containing 5% CO2. All the cell lines were tested for mycoplasma
using the Venor™GeM Mycoplasma Detection Kit (Sigma-Aldrich, Cat. no. MP0025). When
the cell lines reached 70–80% confluence, they were trypsinized using 0.05% trypsin-EDTA
(1X) with phenol red (Gibco1, Cat. no. 25300).
Clinical samples
Archival formalin-fixed, paraffin-embedded (FFPE) tissue samples were obtained from resec-tion specimens from patients living in Scotland who were diagnosed with CRC between 1996 Competing Interests:The authors have declared
and 2003 and were under 55 years of age at the time of diagnosis (refer toS1 Table). A total of 870 patients had been recruited as previously described [19]. All cases were reviewed by a gas-trointestinal histopathologist prior to TMA construction to ensure that the tissue was
com-prised primarily of tumor. All cancers were staged Dukes’A and B. Cohort material and
clinical records access was granted by the Tissue Committee, Edinburgh Experimental Cancer Medicine (Ref: TR029), Lothian Research Ethics Committee (Ref: 08/S1101/41) and South East Scotland HSS (SAHSC) BioResource (Ref: SR117).
Drug sensitivity assays
5-fluorouracil (5-FU) 50mg/mL solution for injection was purchased from Medac GmbH. Oxaliplatin (L-OHP) 5mg/ml concentrate for solution for infusion (Fresenius Kabi Oncology plc, UK) was obtained from the Western General Hospital Pharmacy, Edinburgh. The targeted inhibitor BEZ235 (Cat. no. S1009) was purchased from Selleck Chemicals. Each 96-well plate consisted of six wells containing cells in DMEM supplemented with 10% FBS and 1% penicil-lin/streptomycin, which served as a control. The cells were seeded for 48h prior to addition of
the drugs. Eight different concentrations were used per drug ranging between 5μM to 100μM
(5-FU, L-OHP) and between 2.5nM and 80nM, (BEZ235) respectively. The cells were
incu-bated with the drugs for 96h. To determine cell viability, 20μL of Alamar Blue was added in
each well for 6h prior to reading the plates using Fluoroskan Ascent FL. All drug sensitivity assays were replicated at least twice and six wells were seeded at each drug concentration.
An average RFU reading was taken for every drug concentration and cell viability was calcu-lated as a percentage of the untreated control. Error bars were calcucalcu-lated using the correcalcu-lated
standard deviation of the means. The IC50s for 5-FU, L-OHP and BEZ235 were determined
using the XLfit 5.0 software package (ID Business Solutions, UK). No extrapolation was carried
out when defining the IC50values and outliers were calculated as having a confidence level
greater than 0.05.
DNA, RNA, and protein extraction
Genomic DNA was extracted from each cell line using DNeasy Blood and Tissue Kit (Qiagen,
Cat.No. 69504) according to the manufacturer’s instructions. DNA concentrations were
veri-fied using the NanoDrop 2000 micro-volume spectrophotometer (Thermo Scientific). Satisfac-tory DNA purity was regarded as greater than or equal to a 260/280 ratio of 1.8, ensuring minimal protein contamination of the sample. The quality of the DNA samples was further assayed using agarose gel electrophoresis. After electrophoresis, the gel was carefully removed and the DNA bands were visualised using the Gel Documentation System.
Total RNA was extracted from the cell lines in duplicate using the RNeasy MinElute Cleanup Kit (Qiagen, Cat. no. 74204) and miRNeasy Mini Kit (Qiagen, Cat. no. 217004). The concentration of the RNA was verified using the NanoDrop 2000 spectrophotometer. Satisfac-tory RNA purity was regarded as a 260/230 ratio of approximately 2.0.
Protein lysates were prepared when the cell lines were approximately 80% confluent, as described in detail elsewhere [20]. The protein concentration of the lysates was determined via the bicinchoninic acid (BCA) assay (Sigma-Aldrich, cat. no. C2284-25ML, cat.no. B9643-1L).
KRAS
mutation analysis by Sanger sequencing
Hotspot mutations in codon 12 and 13 were analysed. The primer set was designed using
Primer Premier1V6.0 software (PREMIER Biosoft International). The primer sequences (5' to
3') forKRAS01 were as follows:GGT ACT GGT GGA GTA TTT GAT AGT GT(forward) and
out using the HotStar Hi Fidelity Polymerase Kit (Qiagen Quality1
, cat. no. 202602). The PCR reaction was performed in the DNA Engine Opticon 2 Real-Time Cycler (GMI, Inc). The expected length of the PCR product was confirmed by the presence of a single band at the appropriate molecular weight. Sanger sequencing was carried out at the Medical Research Council Human Genetics Unit (MRC-HGU), Edinburgh. Products were sequenced using the
ABI Prism13100 Genetic Analyzer (Applied Biosystems, Hitachi) and data were analysed
using Mutation Surveyor1
DNA Variant Analysis V3.97 software.
Microarray analyses
Array comparative genomic hybridization. Comparative genomic hybridization (CGH) was performed using the NimbleGen microarray (Roche). Sample labelling was performed with the NimbleGen Dual-Color DNA Labeling Kit (Roche, cat. no. 06 370 250 001). Hybrid-ization was performed in the MRC-HGU, Edinburgh using a NimbleGen HybridHybrid-ization Kit (Roche, cat. no. 05 583 683 001), NimbleGen Sample Tracking Control Kit (Roche, cat. no. 05 223 512 001) and two Human CGH 12 x 135K Whole-Genome Tiling Arrays V3.0 (Roche, cat. no. 05 520 878 001). NimbleScan software was used to generate the pair report files used for copy number data analysis. The data have been deposited at the National Centre for Biotech-nology Information (NCBI) Gene Expression Omnibus with the accession number GSE72296.
Gene expression profiling. Three sets of RNA samples were prepared for Illumina1
Whole Genome Gene Expression Profiling, where 48,804 transcripts per sample were gener-ated. The three sets consisted of two sets of biological replicates and one set of technical
repli-cates. All the RNA samples were diluted to a concentration of 500ng/11μl. The Illumina1
TotalPrep™RNA Amplification Kit (Ambion1
, cat. no. AMIL1791) was used to generate
bioti-nylated, amplified RNA for hybridization with the Illumina1Human HT-12 v4.0 BeadChip.
Prior to progressing with preparation of the RNA samples for microarray analysis, the RNA
integrity was further assessed with the Agilent12100 Bioanalyzer using the Agilent1RNA
6000 Nano Kit (Agilent, cat. no. 5067–1511). Samples with an RNA Integrity Number (RIN) of
7 or better were considered acceptable for hybridisation.
The samples were analysed at the Wellcome Trust Clinical Research Facility, Edinburgh
(Gene Expression Project—CRF E11960), where they were diluted to a concentration of 150ng/
μl and hybridized onto three Human HT-12 v4 Expression BeadChip arrays. Two technical
rep-licates were hybridized onto each array to serve as an internal quality control. The samples were
randomly hybridized along the three Illumina1
HumanHT-12v4 Expression BeadChip arrays.
Post-hybridization, the arrays were scanned using the Illumina HiScan1Platform
(Illu-mina1
, cat. no. SY-103-1001). The BeadArray data files were exported from the Illumina’s
scanning software and imported into the gene expression module of the GenomeStudio
soft-ware (Illumina1
), where subsequently the data files were transformed to tab delimited files. The data have been deposited at the National Centre for Biotechnology Information (NCBI) Gene Expression Omnibus with accession number GSE72544 (http://www.ncbi.nlm.nih.gov/ geo/query/acc.cgi?acc=GSE72544).
Reverse-phase protein arrays
Reverse-phase protein arrays (RPPA) are a medium-throughput technique that allows the screening of samples with a large panel of proteins of interest in a relatively short time, while using minimal amounts of both sample and antibodies [21]. The denatured and reduced
pro-tein samples of the 15 CRC samples were spotted in triplicate onto each pad of a 2-Pad FAST1
panel of 31 optimised, in-house validated, total and phospho- antibodies as previously described (S2 Table) [20]. These antibodies were selected to target key proteins involved in cell proliferation and survival, invasion, metastasis, angiogenesis, DNA damage, and apoptosis were optimised and validated via Western Blotting. The RPPA spots were quantified using
MicroVigene™RPPA Analysis Module software (VigeneTech Inc.). The data were analysed as
previously described [22].
The RPPA spots were quantified using MicroVigene™RPPA Analysis Module software
(VigeneTech Inc.).
Data analysis
Genomic data analysis. Sanger sequencing data were analysed using Mutation Surveyor1
DNA Variant Analysis Software V3.97 (Soft Genetics1, USA). The raw data files .ab1
gener-ated by the ABI Prism1
3100 Genetic Analyzer (Applied Biosystems, Hitachi) were imported into the software and the default analysis settings were applied. The GenBank annotation files were automatically downloaded and the reference files used for mutation detection were auto-matically synthesised.
aCGH data were analysed using Partek1
Genomic Suite™Version 6.6 (Partek Inc.). The data
were initially normalised using Loess Normalization and the Genomic Segmentation algorithm was used to analyse the copy number amplifications and deletions. The custom segmentation parameters were as follows: the minimum genomic markers was 10, the p-value was 0.001, and the signal-to-noise ratio was 0.03. A region was reported as lost if the log2 copy number ratio was below -0.3 and gained if the log 2 copy number ratio was above 0.15. Three different region lists were created: (1) regions that were gained in seven or more cell lines; (2) regions deleted in seven or more cell lines; (3) those containing the highest amplifications, i.e., log2 ratio equal or greater to 1.0 (equivalent to a copy number of 2). Additionally, genomic segmentation clustering was performed using Euclidean distance and average linkage. The copy number analysis was conducted on chromosome 1 to chromosome 22 and excluded the two sex chromosomes.
Transcriptomic data analysis. The sample gene profile file generated from the gene expression analysis was quantile normalised and filtered for those probes where the detection
p-value0.05. The data were then log2 transformed and mean centred to obtain relative values
between the cell lines. The sample gene profile file was then annotated using Hg18 prior to per-forming differential gene expression analysis (DGEA).
The DGEA was performed using ArrayMining, an online microarray data mining software package [23]. Differential gene expression was conducted using SAM analysis to list genes dif-ferentially expressed with respect to treatment response. Three different analyses were carried
out: (1) 5-FU highly sensitive cell linesvs. 5-FU less sensitive cell lines, where highly sensitive
cell lines were defined as having an IC5030μM; (2) L-OHP highly sensitive cell linesvs.
L-OHP less sensitive cell lines, where highly sensitive cell lines were defined as having an IC50
10μM; (3) BEZ235 sensitive cell linesvs. BEZ235 insensitive cell lines, where sensitive cell
lines were defined as having an IC50<80nM.
Interpretation of data was accomplished using Functional Annotation Clustering in DAVID bioinformatics resources [24].
Integration of frequently amplified regions with gene expression data. The gene expres-sion data for the genes located in the frequently gained regions was filtered out. Using
Pear-son’s correlation coefficients with Bonferroni correction, a list of genes that had a significant
Proteomic data analysis. Data generated from RPPA were normalised using Cluster 3.0, an open source clustering tool [25]. Data were log-transformed, mean centred in Cluster 3.0, and clustered by correlation centring and average linkage using MeV 4.8 [26]. RPPA results for the 15 CRC panel were analysed with respect to treatment response using Mann Whitney U test using GraphPad Prism 6.
Tissue microarray (TMA), automated quantitative analysis (AQUA), and
FISH
Five-micron haematoxylin and eosin-stained slides were prepared from the FFPE blocks, and tumor areas were marked by a pathologist and a trained research technician. Following histo-pathological examination, 118 cases were chosen out of the original cohort and a tissue micro-array (TMA) was constructed by a qualified technician. Four biological replicates
(TMA000034A-D) were constructed as described in detail elsewhere [27] and cut into 5μm
sec-tions using a microtome and mounted onto glass slides. Clinical and pathological parameters
of this cohort are summarised inS1 Table.
Protein expression of TRIB1 was assessed with anti-TRIB1 rabbit polyclonal antibody in the CRC TMA using Automated QUantitative Analysis (AQUA), described in detail elsewhere [28,29]. TRIB1 expression in both the cytoplasmic and nuclear compartments was subse-quently correlated with other proteins previously measured in this cohort. TRIB1 expression was also investigated with respect to patient survival, as described below.
TRIB1andMYCamplification in the CRC patient cohort were investigated using
fluores-cencein situhybridisation (FISH). A MYC/CEN8p probe was purchased from Abnova (cat.
no. FG0065) and the TRIB1/CEN8p probe was custom designed by Abnova. The protease treatment time was varied to optimise digestion and ensure good quality hybridisation. Visuali-sation was performed using DAPI (4,6-diamidino-2-phenylindole-2-hydrochloride (Abnova) to stain nuclei.
Ready-to-use dual-labelled probes forMYCandTRIB1were purchased from Abnova. The
MYC/CEN8p FISH probe consisted of an ~160kbMYCprobe located at 8q24.12-q24.13 with a
Texas Red fluorophore together with an ~520kb CEN8p probe located at 8p11.21 with a FITC
fluorophore. The TRIB1/CEN8p FISH probe consisted of an ~260kbTRIB1probe located at
8q24.13 with a Texas Red fluorophore together with an ~520kb CEN8p probe located at 8p11.21 with a FITC fluorophore.
Scoring was carried out by a trained technician and a consultant pathologist. The slides were scored using a Leica DMLB fluorescent microscope using 100X oil immersion lens. The Colorado Scoring Criteria were used [30] to score the TMA slides. A maximum of twenty nuclei per core were scored in most cases, although in some cases a minimum of ten nuclei were scored due to not having twenty scorable nuclei. The sum of the red and green fluoro-phores was noted for each core, and the final score consisted of the ratio of the red fluorophore to the green fluorophore. FISH scores less than 1.8 were interpreted as negative [31].
Statistical analyses
TRIB1 protein expression data generated from AQUA analysis were correlated with AKT, cas-pase 3, cyclin B1, ERK, Ki67, MYC, S6, PTEN, pAKT, pERK, pHistone H3, pMEK, and pS6
protein expression. Statistical analysis was carried out using Pearson’s correlations, and
p-val-ues were adjusted for multiple testing using the Bonferroni correction. An open source pro-gramme TMA Navigator (http://www.tmanavigator.org/) was used for statistical analysis.
Survival analysis forTRIB1andMYCamplification in the CRC cohort was carried out using
Results
Single gene mutational analysis is insufficient for stratification of tumors
with respect to therapy
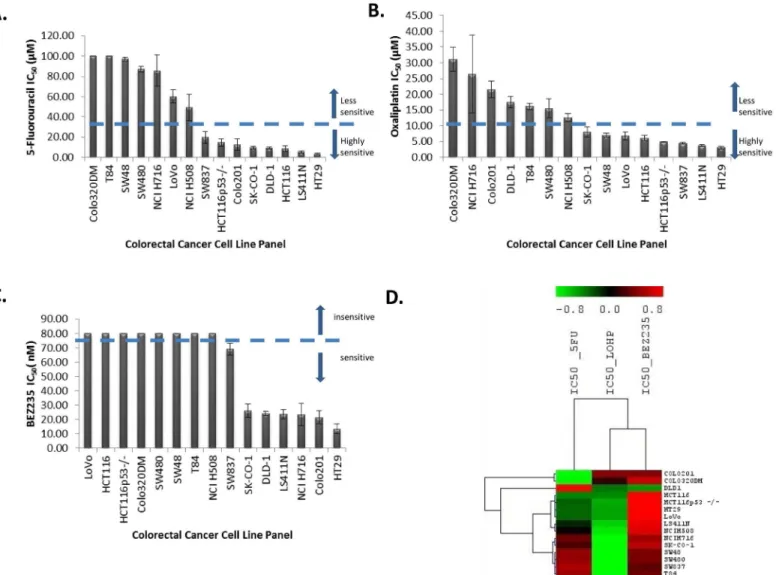
After treatment with 5-fluorouracil (5-FU) for 96 h, thirteen CRC cell lines showed varying
degrees of sensitivity when treated with drug concentrations ranging from 2.5μM to 100μM
(Fig 1A). Two CRC cell lines (Colo320DM, T84) were insensitive to 5-FU at a concentration of
100μM. The IC50values for 5-FU ranged from 3.1 to>100μM with a median of 19.6μM. The
most sensitive cell lines were HT29, LS411N, and HCT116. DLD-1, HCT116, HCT116p53-/-, SW48, and LoVo are reported to be mismatch repair deficient [32]. This profile of mismatch repair status did not correlate with 5-FU sensitivity (p = 0.713; Mann-Whitney U test) contrary to a study by Bracht and colleagues [33].
Although a number ofin vitrostudies have suggested thatTP53deficiency contributes to
drug resistance [34], we failed to see an association (p = 0.238; Mann-Whitney U test). HT29,
LS411N, HCT116 p53-/-, SW837, NCI H508, NCI H716 are allTP53deficient (http://cancer.
Fig 1. A. Waterfall plot for the 5-fluorouracil IC50(μM) values. B. Waterfall plot for oxaliplatin IC50(μM) values. C. Waterfall plot for BEZ235 IC50(nM) values.
D. Unsupervised hierarchical clustering for the IC50values for 5-FU, L-OHP and BEZ235 using Pearson’s Correlation with complete linkage.
sanger.ac.uk/cancergenome/projects/cosmic/), but they were still sensitive to 5-FU in this study. Mariadason et al., however, reported no difference in 5-FU-induced apoptosis in mutant and wild type p53 cell lines [35].
After treatment with oxaliplatin (L-OHP) for 96 h, the CRC cell lines showed varying degrees of sensitivity when treated with increasing concentrations of L-OHP ranging from
2.5μM to 100μM (Fig 1B). The IC50values for L-OHP ranged from 3.0 to 31.1μM, with a
median of 8.0μM, demonstrating a ten-fold range of sensitivity. The most sensitive cell lines
were HT29, LS411N, and SW837, while the least sensitive were Colo320DM, NCI H716, and Colo201. No statistical significance (p = 0.462; Mann Whitney U Test) was observed when
comparing L-OHP IC50values between dMMR cell lines and pMMR cell lines, which is in
agreement with a similar study by Fink et al. [36].
There was no association between p53 status and L-OHP IC50values (p = 0.187; Mann
Whitney U Test), in contrast to a previous report [37]. However, a recent study carried out in
51 advanced CRC patients concluded thatTP53mutational status was not associated with
ben-efit from first-line oxaliplatin-based treatment [38].
Seven CRC cell lines were sensitive and eight CRC cell lines were insensitive to treatment
with various concentrations (2.5nM and 80nM) of BEZ235 for 96 h (Fig 1C). The IC50values
for BEZ235 ranged from 13.4 to>80nM, with the sensitive cell lines having a median sensitive
concentration of 23.6nM. The most sensitive cell lines were HT29, Colo201, and NCI H716, while NCI H508, T84, SW48, SW480, Colo320DM, HCT116, HCT116 p53-/-, and LoVo were insensitive at a concentration of 80nM. No statistically significant difference was observed
(p = 0.346; the Mann-Whitney U test) between the IC50values for BEZ235 treatment and
PIK3CAmutant and wild type groups. All thePI3KCAmutant cell lines had either aBRAFor a
KRASco-mutation. No COSMIC data was available forMTORmutations in these cell lines
(http://cancer.sanger.ac.uk/cancergenome/projects/cosmic/). Serra et al. established that BEZ235 arrested proliferation in all 21 cancer cell lines used in their study, independent of
PI3K pathway mutation status [39], and that cell lines with aBRAForKRASmutation or
EGFRamplification were slightly less sensitive to BEZ235 compared to the other cell lines [39].
Of the 15 CRC cell lines, eight cell lines possessedKRASexon 2 mutations. The DLD-1,
HCT116, HCT116 p53-/-, and LoVo cell lines had a 5574 G>A substitution consistent with a
G13D missense mutation; the SK-CO-1 and SW480 cell lines had a 5571 G>T substitution
consistent with a G12V missense mutation; SW837 had a 5570 G>T substitution consistent
with a G12C mutation; and T84 had a 5574 G>A substitution consistent with a G13D
muta-tion. This is in agreement with published sequencing data and data in the COSMIC database (http://cancer.sanger.ac.uk/cancergenome/projects/cosmic/). There were no statistically
signif-icant differences in response to 5-FU, L-OHP, and BEZ235 with respect toKRASmutational
status (p = 0.98, p = 0.60, and p = 0.17, respectively).
Unsupervised hierarchical clustering for the IC50values for 5-FU, L-OHP, and BEZ235
using Pearson’s correlations with complete linkage showed that the cell lines did not cluster
according to any particular mutation. There was variability in response to the three different treatments (Fig 1D).
Chromosomal regions frequently gained and lost in the colorectal cancer
cell lines
Frequent losses were observed at 2q, 3p, 5q, 8p, 9p, 14q, 18q, and 20p (Fig 2). These regions of
gain and loss were similar to those previously reported [32,40–44].
Hierarchical clustering of the segmented copy number data using Euclidean distance aver-age linkaver-age resulted in two major clusters: one cluster contained NCI H716 while the other cluster contained the other 14 cell lines (Fig 3). One of the sub-clusters contained HT29, SW48, LS411N, LoVo, HCT116, and HCT116p53-/-. HCT116, HCT116p53-/-, SW48, and
LoVo are near-diploid and known to have mutations in MMR genesMLH1andMSH2[45,
46]. The other near-diploid cell line, DLD-1, also clustered separately. This cell line is MMR deficient in MSH6 [47].
Differential gene expression with respect to drug sensitivity
Genes differentially expressed with respect to 5-FU sensitivity are listed inS3 Tableand
depicted in a heat map inFig 4A. Functional annotation using DAVID [24] revealed that these
genes were mainly involved in cell cycle (TAF2,CHFR,CCND2,OSGIN2,TERF1,TBRG4),
Fig 2. Karyogram for chromosome 1 to 22 showing the most frequent gains and losses for the 15 CRC cell lines
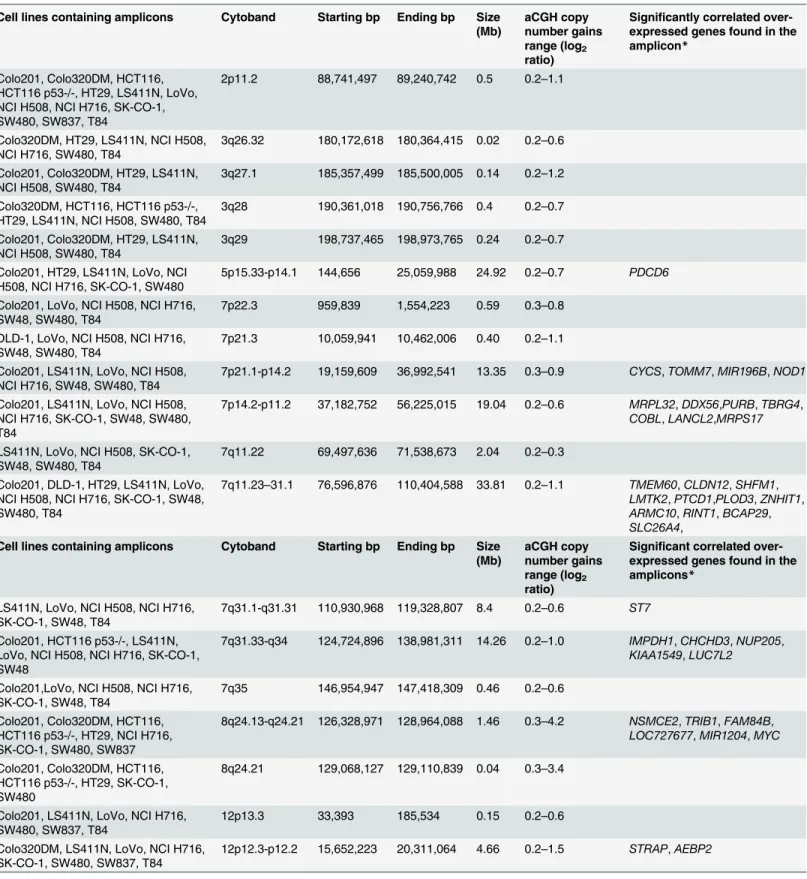
Table 1. Summary of the regions of copy number gains and the genes significantly overexpressed in those regions (*after Bonferroni correction).
Cell lines containing amplicons Cytoband Starting bp Ending bp Size
(Mb)
aCGH copy number gains range (log2 ratio)
Significantly correlated over-expressed genes found in the amplicon*
Colo201, Colo320DM, HCT116, HCT116 p53-/-, HT29, LS411N, LoVo, NCI H508, NCI H716, SK-CO-1, SW480, SW837, T84
2p11.2 88,741,497 89,240,742 0.5 0.2–1.1
Colo320DM, HT29, LS411N, NCI H508, NCI H716, SW480, T84
3q26.32 180,172,618 180,364,415 0.02 0.2–0.6
Colo201, Colo320DM, HT29, LS411N, NCI H508, SW480, T84
3q27.1 185,357,499 185,500,005 0.14 0.2–1.2
Colo320DM, HCT116, HCT116 p53-/-, HT29, LS411N, NCI H508, SW480, T84
3q28 190,361,018 190,756,766 0.4 0.2–0.7
Colo201, Colo320DM, HT29, LS411N, NCI H508, SW480, T84
3q29 198,737,465 198,973,765 0.24 0.2–0.7
Colo201, HT29, LS411N, LoVo, NCI H508, NCI H716, SK-CO-1, SW480
5p15.33-p14.1 144,656 25,059,988 24.92 0.2–0.7 PDCD6
Colo201, LoVo, NCI H508, NCI H716, SW48, SW480, T84
7p22.3 959,839 1,554,223 0.59 0.3–0.8
DLD-1, LoVo, NCI H508, NCI H716, SW48, SW480, T84
7p21.3 10,059,941 10,462,006 0.40 0.2–1.1
Colo201, LS411N, LoVo, NCI H508, NCI H716, SW48, SW480, T84
7p21.1-p14.2 19,159,609 36,992,541 13.35 0.3–0.9 CYCS,TOMM7,MIR196B,NOD1
Colo201, LS411N, LoVo, NCI H508, NCI H716, SK-CO-1, SW48, SW480, T84
7p14.2-p11.2 37,182,752 56,225,015 19.04 0.2–0.6 MRPL32,DDX56,PURB,TBRG4,
COBL,LANCL2,MRPS17
LS411N, LoVo, NCI H508, SK-CO-1, SW48, SW480, T84
7q11.22 69,497,636 71,538,673 2.04 0.2–0.3
Colo201, DLD-1, HT29, LS411N, LoVo, NCI H508, NCI H716, SK-CO-1, SW48, SW480, T84
7q11.23–31.1 76,596,876 110,404,588 33.81 0.2–1.1 TMEM60,CLDN12,SHFM1,
LMTK2,PTCD1,PLOD3,ZNHIT1,
ARMC10,RINT1,BCAP29,
SLC26A4,
Cell lines containing amplicons Cytoband Starting bp Ending bp Size
(Mb)
aCGH copy number gains range (log2 ratio)
Significant correlated over-expressed genes found in the amplicons*
LS411N, LoVo, NCI H508, NCI H716, SK-CO-1, SW48, T84
7q31.1-q31.31 110,930,968 119,328,807 8.4 0.2–0.6 ST7
Colo201, HCT116 p53-/-, LS411N, LoVo, NCI H508, NCI H716, SK-CO-1, SW48
7q31.33-q34 124,724,896 138,981,311 14.26 0.2–1.0 IMPDH1,CHCHD3,NUP205,
KIAA1549,LUC7L2
Colo201,LoVo, NCI H508, NCI H716, SK-CO-1, SW48, T84
7q35 146,954,947 147,418,309 0.46 0.2–0.6
Colo201, Colo320DM, HCT116, HCT116 p53-/-, HT29, NCI H716, SK-CO-1, SW480, SW837
8q24.13-q24.21 126,328,971 128,964,088 1.46 0.3–4.2 NSMCE2,TRIB1,FAM84B,
LOC727677,MIR1204,MYC
Colo201, Colo320DM, HCT116, HCT116 p53-/-, HT29, SK-CO-1, SW480
8q24.21 129,068,127 129,110,839 0.04 0.3–3.4
Colo201, LS411N, LoVo, NCI H716, SW480, SW837, T84
12p13.3 33,393 185,534 0.15 0.2–0.6
Colo320DM, LS411N, LoVo, NCI H716, SK-CO-1, SW480, SW837, T84
12p12.3-p12.2 15,652,223 20,311,064 4.66 0.2–1.5 STRAP,AEBP2
focal adhesion (ABCB1,SH3KBP1,EBAG9), apoptosis (SHRKBP1,EBAG9,TERF1,TBRG4),
and regulation of transcription (LASS2,LMCD1,MAF1,TAF2,THAP11,CHURC1,MED14,
PIAS3,PURB,TERF1,ZNF239,ZNF7). Important KEGG pathways associated with 5-FU mode of action and subsequently enriched in the list originating from this study included purine
metabolism (NT5C2,POLR2J2), pyrimidine metabolism (NT5C2,POLR2J2), drug metabolism
(GSTO2), ABC transporters (ABCB1), and oxidative phosphorylation (NDUFA9).
Genes differentially expressed with respect to L-OHP sensitivity were involved with DNA
binding (GLI2,GLI4,SETDB2,NFXL1,POLE4,PURA,TSNAX,ZBTB41,ZNF20,ZNF254,
ZNF420,ZNF689,ZNF7,ZNF91), regulation of transcription (GLI2,NFXL1,PURA, TGFBRAP1,ZBTB41,ZNF20,ZNF254,ZNF420,ZNF689,ZNF7,ZNF91), regulation of cell
cycle (CHFR,RPS27L,SCRIB,TPR), and apoptosis (BFAR,EIF2AK2,SCRIB,TNFSF9) (S4
TableandFig 4B). Oxidative phosphorylation (ATP6V1B2), Jak-STAT signalling pathway
(CBLC), hedgehog signalling pathway (GLI2), glycolysis (AKR1A1), glutathione metabolism
(GSTO2), drug metabolism (GSTO2), cysteine and methionine metabolism (MTAP), MAPK
signalling pathway (MAP3K2,MAP4K2), base excision repair, and nucleotide excision repair
(POLE4) pathways were enriched in this gene set.
The most differentially expressed genes with respect to BEZ235 sensitivity were involved in
glucose metabolism (CPS1,G6PD,PYGL), cell death (TRIAP1,ERN2,LYZ,MUC5AC,PPT1,
PTRH2,RNF216), response to drug (TIMP4,AACS,CPS1), chromatin organization (BCORL1, LOC644914,LOC440926,H3F3A,SMARCC1,TBL1XR1), regulation of transcription
(BCORL1,LMCD1,SPDEF,SMARCC1,TAF4B,CHURC1,ERN2,PROX1,SORBS3,TBL1XR1, ZNF75A), and DNA binding (LOC644914,LOC440926,H3F3A,SPDEF,SMARCC1,TAF4B, MSRB2,NUCB1,PROX1,TBL1XR1,ZNF75A) (Fig 4CandS5 Table). The Wnt signalling
path-way (LRP5,TBL1XR1), phosphatidylinositol signalling system (PIK3C2B), and the Jak-STAT
signalling pathway (SPRY1) were enriched in less sensitive cell lines.
Integration of frequently amplified regions with gene expression data
A total of 971 genes were located in frequently gained regions, of which corresponding gene expression data were available for 667 genes. A total of 47 genes were significantly correlatedand are listed inTable 1, suggesting that at least 7% of the genes found in the frequently gained
regions might be regulated by copy number changes, at least in part. This is important since genes that are over-expressed when amplified are more likely to be putative oncogenic drivers and therapeutic targets [48]. These amplified and overexpressed genes were involved in
Table 1. (Continued)
Colo201, Colo320DM, HT29, LS411N, NCI H508, NCI H716, SK-CO-1, SW480
13q12.11-q13.3 18,761,622 35,141,488 16.38 0.2–3.39 MPHOSP8,N6AMT2,XPO4,
GTF3A,MTIF3,POMP,UBL3,
BRCA2,PDS5B,RFC3
Colo201, Colo320DM, DLD-1, HT29, LS411N, NCI H508, SW480
13q14.11 42,472,749 42,745,298 0.27 0.2–0.8
Colo201, Colo320DM, HCT116, HCT116 p53-/-, HT29, LS411N, LoVo, NCI H508, NCI H716, SK-CO-1, SW48, SW480, SW837, T84
14q32.33 105,305,751 106,342,077 1.04 0.4–1.3
Colo201, Colo320DM, HCT116, HCT116 p53-/-, HT29, NCI H508, SW837
17q24.1 61,037,879 61,181,176 0.14 0.2–0.7
Colo201, HCT116, HCT116 p53-/-, NCI H508, NCI H716, SK-CO-1, SW837
17q25.1 70,481,449 70,707,547 0.23 0.3–1.0
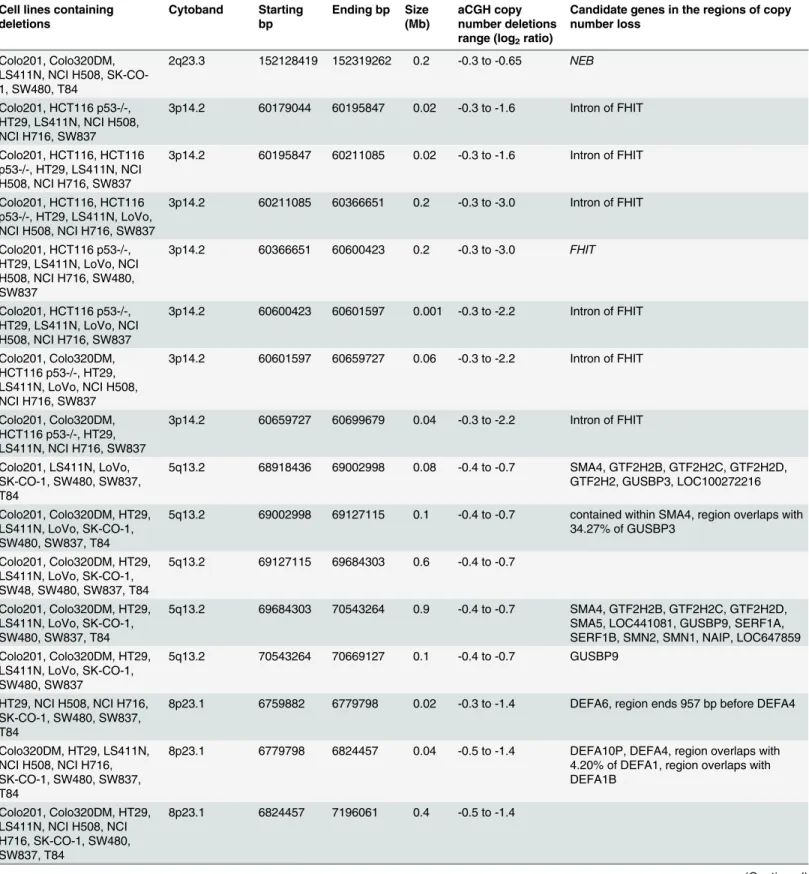
Table 2. Summary of the regions having copy number losses.
Cell lines containing deletions
Cytoband Starting
bp
Ending bp Size (Mb)
aCGH copy number deletions range (log2ratio)
Candidate genes in the regions of copy number loss
Colo201, Colo320DM, LS411N, NCI H508, SK-CO-1, SW480, T84
2q23.3 152128419 152319262 0.2 -0.3 to -0.65 NEB
Colo201, HCT116 p53-/-, HT29, LS411N, NCI H508, NCI H716, SW837
3p14.2 60179044 60195847 0.02 -0.3 to -1.6 Intron of FHIT
Colo201, HCT116, HCT116 p53-/-, HT29, LS411N, NCI H508, NCI H716, SW837
3p14.2 60195847 60211085 0.02 -0.3 to -1.6 Intron of FHIT
Colo201, HCT116, HCT116 p53-/-, HT29, LS411N, LoVo, NCI H508, NCI H716, SW837
3p14.2 60211085 60366651 0.2 -0.3 to -3.0 Intron of FHIT
Colo201, HCT116 p53-/-, HT29, LS411N, LoVo, NCI H508, NCI H716, SW480, SW837
3p14.2 60366651 60600423 0.2 -0.3 to -3.0 FHIT
Colo201, HCT116 p53-/-, HT29, LS411N, LoVo, NCI H508, NCI H716, SW837
3p14.2 60600423 60601597 0.001 -0.3 to -2.2 Intron of FHIT
Colo201, Colo320DM, HCT116 p53-/-, HT29, LS411N, LoVo, NCI H508, NCI H716, SW837
3p14.2 60601597 60659727 0.06 -0.3 to -2.2 Intron of FHIT
Colo201, Colo320DM, HCT116 p53-/-, HT29, LS411N, NCI H716, SW837
3p14.2 60659727 60699679 0.04 -0.3 to -2.2 Intron of FHIT
Colo201, LS411N, LoVo, SK-CO-1, SW480, SW837, T84
5q13.2 68918436 69002998 0.08 -0.4 to -0.7 SMA4, GTF2H2B, GTF2H2C, GTF2H2D, GTF2H2, GUSBP3, LOC100272216
Colo201, Colo320DM, HT29, LS411N, LoVo, SK-CO-1, SW480, SW837, T84
5q13.2 69002998 69127115 0.1 -0.4 to -0.7 contained within SMA4, region overlaps with 34.27% of GUSBP3
Colo201, Colo320DM, HT29, LS411N, LoVo, SK-CO-1, SW48, SW480, SW837, T84
5q13.2 69127115 69684303 0.6 -0.4 to -0.7
Colo201, Colo320DM, HT29, LS411N, LoVo, SK-CO-1, SW480, SW837, T84
5q13.2 69684303 70543264 0.9 -0.4 to -0.7 SMA4, GTF2H2B, GTF2H2C, GTF2H2D, SMA5, LOC441081, GUSBP9, SERF1A, SERF1B, SMN2, SMN1, NAIP, LOC647859 Colo201, Colo320DM, HT29,
LS411N, LoVo, SK-CO-1, SW480, SW837
5q13.2 70543264 70669127 0.1 -0.4 to -0.7 GUSBP9
HT29, NCI H508, NCI H716, SK-CO-1, SW480, SW837, T84
8p23.1 6759882 6779798 0.02 -0.3 to -1.4 DEFA6, region ends 957 bp before DEFA4
Colo320DM, HT29, LS411N, NCI H508, NCI H716, SK-CO-1, SW480, SW837, T84
8p23.1 6779798 6824457 0.04 -0.5 to -1.4 DEFA10P, DEFA4, region overlaps with 4.20% of DEFA1, region overlaps with DEFA1B
Colo201, Colo320DM, HT29, LS411N, NCI H508, NCI H716, SK-CO-1, SW480, SW837, T84
8p23.1 6824457 7196061 0.4 -0.5 to -1.4
Table 2. (Continued)
Cell lines containing deletions
Cytoband Starting
bp
Ending bp Size (Mb)
aCGH copy number deletions range (log2ratio)
Candidate genes in the regions of copy number loss
Colo201, Colo320DM, HT29, LS411N, NCI H716, SK-CO-1, SW480, SW837, T84
8p23.1 7196061 7243352 0.05 -0.5 to -1.2 ZNF705G, region overlaps with 8.94% of FAM66B
Colo201, Colo320DM, HT29, LS411N, NCI H716, SK-CO-1, SW48, SW480, SW837, T84
8p23.1 7243352 7760349 0.5 -0.5 to -1.2
Colo201, Colo320DM, HT29, LS411N, NCI H716, SK-CO-1, SW480, SW837, T84
8p23.1 7760349 7767962 0.01 -0.5 to -1.2 region ends 8174 bp before DEFB103A
Colo201, Colo320DM, HT29, NCI H716, SK-CO-1, SW480, SW837, T84
8p23.1 7767962 8024923 0.3 -0.4 to -1.2 DEFB103A, DEFB103B, DEFB109P1B, DEFB4A, FAM66E, MIR548I3, USP17L3, USP17L8, ZNF705B
HT29, LS411N, NCI H716, SK-CO-1, SW480, SW837, T84
8p23.1 11368117 11512387 0.1 -0.3 to -1.0 BLK, LINC00208
HT29, NCI H508, NCI H716, SK-CO-1, SW480, SW837, T84
8p22 15174627 15414385 0.2 -0.3 to -0.8 region ends 27582 bp before TUSC3
HCT116, HT29, LoVo, NCI H508, NCI H716, SW48, T84
9p12 41613166 41759552 0.1 -0.4 to -1.1 region starts 30958 bp after ZNF658B
Colo320DM, HCT116, HT29, LoVo, NCI H508, NCI H716, SW48, T84
9p12-11.2 41759552 43003659 1.2 -0.4 to -1.1 MGC21881, KGFLP2, LOC643648, ANKRD20A2, ANKRD20A3, FAM95B1, FOXD4L4, FOXD4L2, LOC286297, AQP7P3 Colo320DM, HT29, LoVo,
NCI H508, NCI H716, SW48, T84
9p11.2 43003659 43678360 0.7 -0.4 to -1.1 ANKRD20A2, ANKRD20A3, FAM95B1, LOC642929, FAM75A6, CNTNAP3B
Colo320DM, HT29, LoVo, NCI H508, NCI H716, SW48, T84
9p11.2–q13 43794421 70017489 26.2 -0.4 to -1.1 CNTNAP3B, LOC643648, FAM27C, FAM27A, KGFLP1, FAM74A4, FAM74A2, SPATA31A5, SPATA31A7, MGC21881, LOC28627, AQP7P1, FAM27B,
ANKRD20A1, ANKRD20A3, LOC642236, LOC100132352, PGM5P2, LOC440896, FOXD4L6, CBWD6, ANKRD20A4, LOC100133920, FOXD4L5, FOXD4L2, FOXD4L4, CBWD3, CBWD5
HT29, LS411N, LoVo, NCI H508, NCI H716, SW48, SW480, SW837, T84
14q11.1-q11.2 18407780 19456314 1.0 -0.3 to -1.4 LOC642426, OR11H12, OR11H2,OR4K2, OR4M1, OR4N2, OR4Q3, POTEG, POTEM
Colo201, DLD-1, LS411N, NCI H716, SW480, SW837, T84
18q21.1 43485291 44789986 1.3 -0.3 to -0.9 CTIF, MIR4743, SMAD2, SMAD7, ZBTB7C
Colo201, LS411N, NCI H508, NCI H716, SW480, SW837, T84
18q21.1 45939166 46237377 0.3 -0.4 to -0.9 CCDC11, CXXC1, MBD1, SKA1, region overlaps with 12.17% of MYO5B
Colo201, LS411N, NCI H716, SK-CO-1, SW480, SW837, T84
18q21.2 47301645 49512571 2.2 -0.4 to -0.9 DCC, region overlaps with 1.86% of LOC100287225
pathways in cancer, colorectal cancer drug metabolism, cell cycle, homologous recombination, DNA replication, nucleotide excision repair, mismatch repair, apoptosis, p53 signalling, MAPK signalling, ErbB signalling, wnt signalling, TGF-beta signalling, and JAK-STAT signal-ling by pathway analysis.
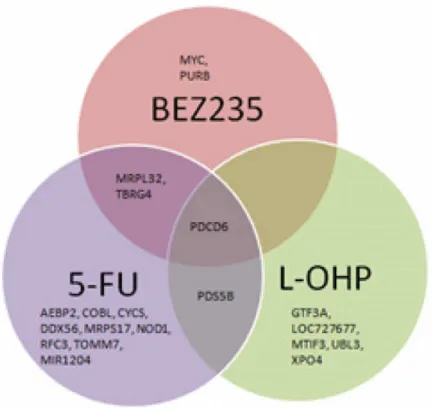
20/47 of these genes were associated with treatment responses (Figs5and6). Significant
dif-ferences were found between response to 5-FU treatment and gene expression ofTBRG4
(p0.001),MRPL32(p0.001),CYCS(p0.001),PDCD6(p = 0.01),COBL(p = 0.01),
DDX56(p = 0.01),MRPS17(p = 0.01),PDS5B(p = 0.03),TOMM7(p = 0.03),AEBP2
(p = 0.04),NOD1(p = 0.04),MIR1204(p = 0.04) andRFC3(p = 0.05). Significant differences
were found between response to BEZ235 treatment and gene expression ofPDCD6(p = 0.002),
MYC(p = 0.01),MRPL32(p = 0.01),TBRG4(p = 0.03) andPURB(p = 0.04). Significant
differ-ences were found between response to L-OHP treatment and gene expression ofPDS5B
(p<0.005),UBL3(p = 0.01),MTIF3(p = 0.02),CASC8(p = 0.02),XPO4(p = 0.04),GTF3A
(p = 0.04) andPDCD6(p = 0.04).
Proteomic analysis
Reverse phase protein array (RPPA) was used to measure protein expression of 31 phosphory-lated and non-phosphoryphosphory-lated proteins in the CRC cell lines. Two main sub-clusters were pro-duced by unsupervised hierarchical clustering of RPPA data (Fig 7). Sub-cluster one was
Table 2. (Continued)
Cell lines containing deletions
Cytoband Starting
bp
Ending bp Size (Mb)
aCGH copy number deletions range (log2ratio)
Candidate genes in the regions of copy number loss
Colo201, LS411N, NCI H716, SK-CO-1, SW480, SW837, T84
18q21.2-q23 51105332 76108541 25.0 -0.4 to -1.1 TCF4, MIR4529, LOC100505474, TXNL1, WDR7, LINC-ROR, BOD1L2, ST8SIA3, ONECUT2, FECH, NARS, LOC100505549, ATP8B1, NEDD4L, MIR122, MIR3591, ALPK2, MALT1, ZNF532, OACYLP, SEC11C, GRP, RAX, CPLX4, LMAN1, CCBE1, PMAIP1, MC4R, CDH20, RNF152, PIGN, KIAA1468, TNFRSF11A, ZCCHC2, PHLPP2, BCL2, KDSR, VPS4B, SERPINB5, SERPINB12, SERPINB13, SERPINB4, SERPINB3, SERPINB11, SERPINB7, SERPINB2, SERPINB10, HMSD, SERPINB8, LINC00305, LOC284294, LOC400654, CDH7, CDH19, MIR5011, DSEL, LOC643542, TMX3, CCDC102B, DOK6, CD226, RTTN, SOCS6, LOC100505776, CBLN2, NETO1, LOC400655, LOC100505817, FBX015, TIMM21, CYB5A, C18ORF63, FAM69C, CNDP2, CNDP1, LOC400657, ZNF407, ZADH2, TSHZ1, C18ORF62, LOC339298, ZNF516, FLJ44313, LOC284276, LOC100131655, ZNF236, MBP, GALR1, SALL3, ATP9B, NFATC1, CTDP1, KCNG2, PQLC1, HSBP1L1, TXNL4A, RBFA, ADNP2, PARD6G-AS1, PARD6G
Colo201, HT29, NCI H508, NCI H716, SW480, SW837, T84
20p12.1 14636068 14938351 0.3 -0.4 to -3.2 MACROD2
enriched in proteins regulating cell-cycle function (Chk1, Chk2, p38MAPK, p21, p27, and Ki67; p = 0.037). Sub-cluster two was enriched for proteins regulating cell migration (Bcl-2, ErbB1, HIF-1 alpha, PTEN, TRIB1; p = 0.0007), phosphorylation (Bcl-2, cyclin D1, ErbB1,
mTOR, PTEN, TRIB1; p = 0.001), cell proliferation (Bcl-2,β-catenin, cyclin D1, ErbB1, HIF-1
alpha, mTOR, PTEN, TRIB1; p = 0.0003), cellular responses to stress (Bcl-2, cdc2, cyclin D1, HIF-1 alpha, TRIB1; p = 0.001), negative regulation of apoptosis (Bcl-2, cdc2, ErbB1, PTEN,
B-raf; p = 0.005), and focal adhesion (β-catenin, Bcl-2, B-Raf, cyclin D1, ErbB1, PTEN;
p = 0.00013).
Difference in protein expression with respect to treatment responses
Significant differences in protein expression were found for FAK (p = 0.004) and phospho MEK (p = 0.005) with respect to 5-FU treatment responses (Fig 8A). Significant differences in gene expression were found for cdc2 (p = 0.03), FAK (p = 0.0003), Ki67 (p = 0.009), MEK(p = 0.002), NFκβp65 (p = 0.02), and PTEN (p = 0.0006) with respect to L-OHP treatment
responses (Fig 8B). No significant differences were observed for RPPA values with respect to response to BEZ235.
Fig 3. Hierarchical clustering using the genomic segmentations of the 15 CRC cell lines.
Fig 4. A. A heatmap depicting the SAM analysis for genes differentially expressed between 5-FU sensitive and less sensitive CRC cell lines; B. A heatmap depicting the SAM analysis for genes differentially expressed between L-OHP sensitive and less sensitive CRC cell lines; C. A heatmap depicting the SAM analysis for genes differentially expressed between BEZ235 sensitive and less sensitive CRC cell lines.
doi:10.1371/journal.pone.0144708.g004
Fig 5. Venn diagram showing differentially expressed genes with respect to treatment response to a) 5-FU, b) L-OHP, and c) BEZ235B.
TRIB1
in CRC
Statistically significant correlations between copy number gains and gene expression were identi-fied on amplicons located on chromosome 8. Candidate genes that could be investigated further
includedTRIB1, which was also observed to be recurrently amplified and overexpressed in a
CRC study carried out by Camps et al. [41]. Furthermore, an integrated analysis of genomic and transcriptomic profiles of a panel of breast cancer cell lines established that TRIB1 is a potential amplicon driver [49]. TRIB1 has also been implicated as a key oncogene in acute myeloid leukae-mia and ovarian cancers [50]. This region is 2.25Mb away from MYC, a well-established onco-gene, including in CRC. TRIB1 was chosen as a candidate gene for further investigation due to the fact that seven out of fifteen cell lines exhibited copy number gain. The gene is located at
Chr8: 126,393,571–126,567,050, in the 8q24 region, known to be associated with breast, ovarian,
prostate and colorectal cancer [51]. TRIB1 is reported to be amplified in two integrated
Fig 6. Unsupervised hierarchical clustering for the 47 candidate genes annotated according to response to therapy.
genomics and transcriptomic profiling studies on CRC cell lines and breast cancer cell lines,
whereas in the latter TRIB1 was highlighted as a potential additional amplicon driver [41,49].
Furthermore, the tribbles protein family act as adaptors that interact with the MAPK pathway [52], one of the most critical for cellular proliferation [53], transformation, differentiation [54], apoptosis, autophagic type II programmed cell death, and senescence [55]. In view of this way being centrally involved in cellular decision-making, small quantitative differences in path-way components may be sufficient to cause large changes in cellular phenotype [56].
Genomic, transcriptomic, and proteomic data for
TRIB1
in the CRC cell
line panel
There was a weak correlation between DNA copy number of theTRIB1region (Chr8:
126,393,571–126,567,050) and mRNA expression ofTRIB1(r2= 0.395, p = 0.012). TheTRIB1
region was gained in seven cell lines and clearly amplified and very highly expressed in NCI H716 cells. Reverse phase protein array (RPPA) analysis of TRIB1 was carried for the cell lines,
which did not reveal a correlation with log2 copy number ratio (r2= 0.209, p = 0.09) or with
gene expression (r2= 0.089, p = 0.282). Nevertheless, a large variation between TRIB1 protein
expression was observed between the different cell lines that did not reach statistical significance.
TRIB1
and
MYC
amplification in the clinical cohort using FISH
The Oncomine(R)[57] database was interrogated to exploreTRIB1copy number in a cohort of
881 CRC patients (TCGA Colorectal 2), whereTRIB1was found to be gained in 11% of
pri-mary CRC samples. Consequently, the amplification ofTRIB1andMYCin the tissue
microar-ray consisting of 118 Dukes’A and B CRC patients was analysed.
Of the 118 cores (each representing a case), a total of 76 cores contained nuclei that could be
scored forTRIB1. FISH scores forTRIB1ranged between 0.45 and 3.38 (median 1.00, IQR
0.28; mean 1.21, SD 0.52). Of 76 cases, 11 tumors (14.4%) were amplified (a score of1.8).
Fig 7. Unsupervised hierarchical clustering of RPPA protein expression data using Euclidian distance with average linkage.
Of 118 cores, a total of 81 cores contained nuclei that could be scored forMYC. FISH scores
forMYCranged between 0.70 and 4.14 (median 1.02; IQR 0.24; mean 1.17, SD 0.52). Six
tumors were amplified forMYC(7.4%).
TRIB1andMYCFISH scores were strongly positively correlated (Spearman’s Rank; r2= 0.783, p = 0.0001).
TRIB1
protein expression using AQUA and associated pathway
expression
TRIB1 protein expression was next investigated using AQUA. Protein expression in the cyto-plasm and nucleus was successfully measured in 96 out of 118 cases. Five samples out of the 96 samples showed TRIB1 overexpression (5.2%) in the cytoplasm when considering a cut-off of two standard deviations, while 6/96 showed TRIB1 overexpression (6.25%) in the nucleus.
Fig 8. A. Box plots showing significant differences in protein expression between 5-FU sensitive and less sensitive cell lines (Mann Whitney U test) B. Box plots showing significant differences in protein expression between L-OHP sensitive and less sensitive cell lines (Mann Whitney U test).
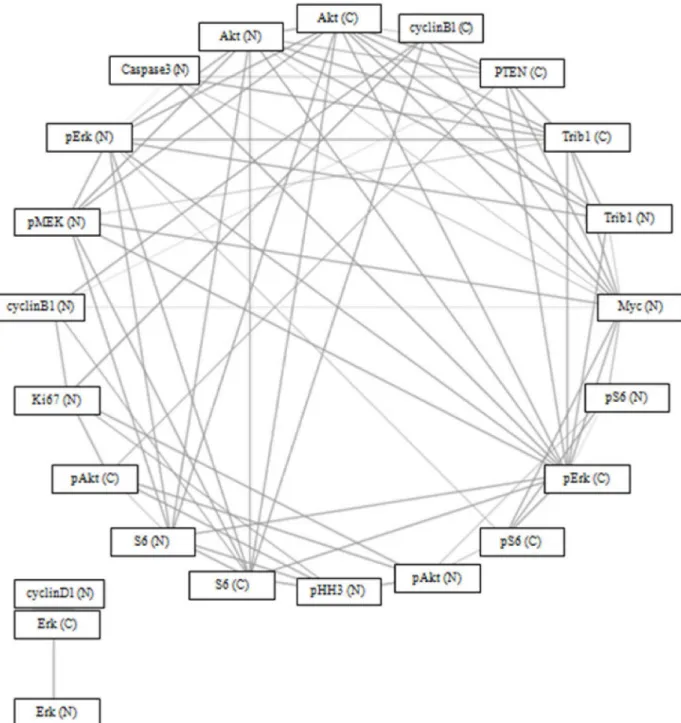
Of 22 proteins in the MAPK pathway, TRIB1 protein expression in the cytoplasm was sig-nificantly correlated (p = 0.05) with TRIB1 (nucleus), phospho-Erk, Akt, Myc (nucleus), PTEN (cytoplasm), cleaved caspase 3 (nucleus), and phospho-MEK (nucleus), after correcting for multiple testing. TRIB1 protein expression in the nucleus was significantly correlated
(p = 0.05) with TRIB1 (cytoplasm), Akt, phospho-Erk, and Myc (nucleus), after correcting for multiple testing (Fig 9). There was no statistically significant difference in survival between
patients withTRIB1orMYCamplifications and those without.
Fig 9. Spearman’s correlation network using Bonferroni Correction (p = 0.05) and circular network layout (http://www.tmanavigator.org/).
Abbreviations: N—nucleus, C—cytoplasm.
Discussion
Although the mutation status of a number of individual candidate genes has been associated with responses to CRC therapy, the results are inconclusive and few have resulted in useful stratification biomarkers. Here, the cellular response to treatment with 5-FU, L-OHP and BEZ235 was not associated with the mutational status of common genes in multiple cell lines. The measurement of a mutation in a single gene alone was insufficient to stratify patients for CRC therapy, which argues for adopting a multi-scale approach to help identify other factors that contribute to therapeutic resistance.
The list of tumor suppressor genes found in this study’s frequently deleted regions included
BCL2,DCC,CTDP1,SMAD2, andFHIT[58–60]. AlthoughBCL2is not usually considered to be a tumor suppressor gene, it has been reported to act as one under certain circumstances
[61]. Furthermore, one of the frequently deleted regions containedMACROD2at 20p12.1
which was also described in a recently published study by Linnebacher et al. [62].
Systematic analysis of copy number gains allowed us to identify regions that were gained in seven or more cell lines. The use of a high-resolution array allowed analysis of frequently amplified regions that contained less well described genes. This analysis, when combined with gene and protein expression analysis and extensive literature review, helped us to identify a number of genes that could be further investigated as possible novel oncogenic drivers and determinants of response to therapy.
A number of genes were amplified, overexpressed, and associated with therapeutic responses. By adopting a functional multiscale analytical approach, a list of 20 candidate pre-dictive biomarkers for 5-FU, L-OHP, and BEZ235 was generated. 5-FU-sensitive cell lines had
higher programmed cell death 6 (PDCD6) gene expression than less sensitive cell lines.
PDCD6, located on cytoband 5p15.33-p14.1, is known to be involved in apoptosis survival [63] and is implicated in migration and invasion in ovarian cancers [64]. Furthermore, there was a statistically significant difference with respect to treatment responses for the three treatments
examined in this study. It has recently been demonstrated thatPDCD6accumulates in the
nucleus and induces apoptosis in response to DNA damage [65]. Moreover, Rho and
col-leagues found that over-expressedPDCD6inhibits angiogenesis through the PI3K/mToR/
p70S6K pathway by interacting with VEGFR-2 [66], while Park et al. showed that PDCD6
exerts its anti-tumor potency by activating the p53-p21 protein for G1phase of cell cycle
pro-gression and apoptosis involved in human ovarian tumorigenesis. This study suggested that
suppressingPDCD6supports tumorigenesis by inhibiting apoptosis in ovarian cancer [67].
Expression ofTBRG4,MRPL32,CYCS,COBL,DDX56,MRPS17,PDS5B,TOMM7,AEBP2,
NOD1,MIR1204andRFC3was lower 5-FU-sensitive cell lines.CYCS,TOMM7,NOD1, MRPL32,DDX56,TBRG4,COBL, andMRPS17all map to the 7p21.1—7p11.2 cytoband. Their biological functions include positive regulation of cell proliferation and cell cycle arrest [68]. The Nod1 signalling complex has been shown to drive JNK activation, cytokine release, and
induction of apoptosis in MCF7 breast cancer cells [69]. 7p21.1—7p11.2 cytoband
amplifica-tion may in itself be, associated 5-FU responses by chromosomal-scale changes biasing expres-sion over a large region and affecting genes that do not confer selective advantage [70].
Moreover,EGFRmaps to this cytoband.
PDS5Bhas been shown to modulate homologous recombination in breast cancer and
influ-ence responses to DNA damaging agents [71]. Furthermore, they speculated that lowPDS5B
-expressing tumors are more responsive to DNA damaging chemotherapy [71].RFC3copy
number gains are frequently found in colon and oesophageal cancers, and in the latter cancer,
Lockwood and colleagues showed thatRFC3knockdown inhibited proliferation and
differentially expressed between normal and tumor tissue [73].RFC3is also involved in DNA
synthesis and repair [74].MiR1204, located on chromosome 8q24, may be associated with
tumor growth suppression [75,76], perhaps in a partially p53-dependent manner [77].AEBP2
is involved in DNA binding [78].
PDCD6gene expression was higher in cells sensitive to L-OHP, while expression ofPDS5B, UBL3,MTIF3,XPO4,CASC8,and GTF3Awas lower.UBL3was identified as one of seven
genes that predict relapse and survival in early-stage cervical carcinoma patients [79].XPO4, a
critical protein synthesis regulator, is implicated in the regulation of Smad signalling [80]. PDCD6gene expression was, once again, greater in BEZ235-sensitive cell lines, whileMYC, MRPL32,TBRG4,and PURBwas lower. The frequent association of PDCD6 gene expression with drug response supports future studies to explore the significance of this gene with respect
to drug response. A number ofin vitroandin vivostudies in breast and prostate cancer have
demonstrated thatMYCamplification or phosphorylation lead to acquired resistance to
BEZ235 [81], and Tan and colleagues used a PDK1 inhibitor to bypassMYC-dependent
resis-tance [81]. Genomic amplification ofMYCoreIF4Econtributed to resistance to BEZ235 in
mammary epithelial cells [82].MRPL32,TBRG4, andPURBall mapped to chromosome
7p14.2-p11.2. Chromosome 7p gains have been observed in both the early- and late-stage CRC
[83].TBRG4is involved in positive regulation of cell proliferation and cell cycle arrest [68] and
apoptosis [84].
Seven proteins were associated with responses to cytotoxic therapies, but no differential expression was seen with the PI3K/mTOR inhibitor. For example, focal adhesion kinase (FAK) was differentially expressed between 5-FU and L-OHP groups. FAK is associated with apopto-sis and proliferation pathways in cancer cell lines [85]. Cdc2 was similarly differentially
expressed between L-OHP very sensitive and less sensitive cell lines.CDK1(which codes for
cdc2) loss elicited chemotherapeutic resistance in lung cancer [86], while cdc2 was differen-tially expressed in a study of responses to L-OHP three CRC cell lines [87].
As proof of concept of adopting a functional multi-scale analytical approach to comprehend the underlying changes driving colorectal carcinogenesis, a gene that was frequently amplified, TRIB1, was selected for further analysis as a candidate biomarker. There was a highly
statisti-cally significant correlation between the FISH score ofTRIB1andMYC(r2= 0.783,
p = 0.0001), consistent with co-amplification. A number of studies have suggested thatMYC
-driven cancers are reliant on other genes and pathways, unlike non-MYC-driven cancers [88–
90]. Toyoshima and colleagues identified a set of 102 genes required for survival of c-MYC over-expressing cells using a high-throughput siRNA screening approach (91), which included TRIB1. Furthermore,TRIB1appears to be druggable, involved in oncogenic pathways, and
dif-ferential toxicity. Gene expression silencing ofTRIB1using deconvoluted siRNA
pool-medi-ated knockdown resulted in increase in cleaved caspase 3 and 7 and in increase ofγ-H2AX foci
in c-MYC expressing human foreskin fibroblasts but not in the control fibroblasts [91].
We speculate thatMYCandTRIB1are co-amplified in a number of CRC patients and that
targetingTRIB1would lead to cell death via a synthetic lethal mechanism. SinceMYCcannot
be therapeutically targeted, it would be useful to investigate the function ofTRIB1and its role
in targeted therapy.MYCis known to interact with a number of signalling pathways and is
mostly involved in growth and proliferation. Furthermore, althoughMYCis prominently
referred to as a proto-oncogene,MYCalso exhibits pro-apoptotic properties [92]. It is feasible
that in a subset of CRCs, whenTRIB1is targeted,MYCmight function as a tumor suppressor
gene leading to cell death. This would need to be validated in a series of functional experiments.
that TRIB1 interacts with MEK1 and overexpression leads to ERK phosphorylation [93]. Fur-thermore, a number of studies have observed that TRIB1 is predominantly, but not exclusively, located in the nucleus, as here [52]. Both TRIB2 and TRIB3 have interact with Akt, mainly by inhibition, but no data has yet been published for TRIB1 [94]. These data must be interpreted with caution but it would be interesting to investigate the involvement of TRIB1 in the MAPK and PI3K/Akt pathway.
Although a difference in TRIB1 expression was observed in the cell line panel, there was no statistically significant correlation between gene and protein expression. This could have occurred for a number of technical, statistical, and biological reasons including assay sensitiv-ity, array probe specificsensitiv-ity, mRNA and protein degradation [95], and sample numbers. Sharova and colleagues confirmed that TRIB1 has an mRNA half-life of less than one hour, in spite of the median estimated half-life being 7.1 hours [96]. This finding sheds some light on the func-tional role of TRIB1, in that the half-life is related to its physiological role and usually found in transcription factors and genes involved in cell cycling [97]. Additionally, a number of tran-scripts encoding regulatory proteins are known to undergo rapid mRNA decay [98].
This study has a number of limitations. Further data analysis needs to be performed with respect to frequently deleted regions to identify putative tumor suppressor genes involved in CRC and their relationship with treatment responses. This study used continuous cancer cell lines, which may not fully represent parent tumors and, therefore, clinical responses to therapy. Nevertheless, cell lines have been shown to recapitulate the molecular and phenotypic
charac-teristics of primary tumors [99–101], including in colorectal cancer [102], and therefore have
value in translational studies and biomarker discovery. Finally, the tumors analysed in the clin-ical cohort were derived from patients less than 50 years of age and might not be fully represen-tative of the wider CRC population. Further validation is required in a larger, more
representative clinical cohort.
Conclusions
Our multi-scale analytical approach has generated a list of 20 candidate predictive biomarkers for 5-FU, L-OHP, and BEZ235. This approach is valuable for understanding the mode of action of different treatments and guiding personalised therapy. Furthermore, we show, for the first
time, thatTRIB1is co-amplified withMYCin a proportion of CRCs and may be an attractive
target for intervention in this group of patients.
Supporting Information
S1 Table. Patient characteristics of the study population (n = 118). (DOCX)
S2 Table. Antibodies used in the RPPA analysis. (DOCX)
S3 Table. Differentially expressed genes for 5-FU response of the 15 CRC cell lines having a 1.5-fold change or more.
(DOCX)
S4 Table. Differentially expressed genes for L-OHP response of the 15 CRC cell lines having at least a 1.5-fold change.
(DOCX)
Acknowledgments
We thank Prof Malcolm Dunlop and his team for the patient cohort used in this study; Lee Murphy and Louise Evenden at the Wellcome Trust Clinical Research Facility (Edinburgh) for the Illumina Gene Expression study; Dr Morad Ansari (IGMM) and Charlene Kay for assis-tance during the Nimblegen aCGH study; and Stewart McKay (IGMM) for Sanger sequencing.
Author Contributions
Conceived and designed the experiments: RB DF DJH. Performed the experiments: RB IU YZ. Analyzed the data: RB IU YZ DF AKT SPL DJH. Wrote the paper: RB IU YZ DF SPL DJH.
References
1. Ferlay J SH, Bray F, Forman D, Mathers C, Parkin DM. GLOBOCAN 2008 v1.2, Cancer Incidence and Mortality Worldwide: IARC CancerBase No. 10. Lyon, France: International Agency for Research on Cancer; 2010; Available:http://globocan.iarc.fr/factsheets/cancers/colorectal.asp.
2. American Cancer Society. Global Cancer Facts & Figures 2nd Edition. Atlanta: American Cancer Society; 2011. Available:http://www.cancer.org/acs/groups/content/@epidemiologysurveilance/ documents/document/acspc-027766.pdf
3. Li W, Wang R, Yan Z, Bai L, Sun Z. High accordance in prognosis prediction of colorectal cancer across independent datasets by multi-gene module expression profiles. PLoS ONE. 2012; 7(3): e33653. doi:10.1371/journal.pone.0033653PMID:22438977
4. Colussi D, Brandi G, Bazzoli F, Ricciardiello L. Molecular pathways involved in colorectal cancer: implications for disease behavior and prevention. Int J Mol Sci. 2013; 14 (8): 16365–85. doi:10.3390/ ijms140816365PMID:23965959
5. Bertrand FE, Angus CW, Partis WJ, Sigounas G. Developmental pathways in colon cancer: crosstalk between WNT, BMP, Hedgehog and Notch. Cell Cycle. 2012; 11 (23): 4344–51. doi:10.4161/cc. 22134PMID:23032367
6. Wood LD, Parsons DW, Jones S, Lin J, Sjoblom T, Leary RJ, et al. The genomic landscapes of human breast and colorectal cancers. Science. 2007; 318 (5853): 1108–13. PMID:17932254
7. Goel A. Frequent Inactivation of PTEN by Promoter Hypermethylation in Microsatellite Instability-High Sporadic Colorectal Cancers. Cancer Res. 2004; 64 (9): 3014–21. PMID:15126336
8. Smith G, Carey FA, Beattie J, Wilkie MJ, Lightfoot TJ, Coxhead J, et al. Mutations in APC, Kirsten-ras, and p53—alternative genetic pathways to colorectal cancer. Proc Natl Acad Sci U S A. 2002; 99 (14): 9433–8. PMID:12093899
9. Fearon ER. Molecular genetics of colorectal cancer. Ann Rev Pathol. 2011; 6: 479–507.
10. Naccarati A, Polakova V, Pardini B, Vodickova L, Hemminki K, Kumar R, et al. Mutations and polymor-phisms in TP53 gene—an overview on the role in colorectal cancer. Mutagenesis. 2012; 27 (2): 211–
8. doi:10.1093/mutage/ger067PMID:22294769
11. Custodio A, Feliu J. Prognostic and predictive biomarkers for epidermal growth factor receptor-tar-geted therapy in colorectal cancer: Beyond KRAS mutations. Crit Rev Oncol Hematol. 2013; 85 (1); 45–81. doi:10.1016/j.critrevonc.2012.05.001PMID:22647972
12. Samuels Y, Velculescu VE. Oncogenic mutations of PIK3CA in human cancers. Cell Cycle. 2004; 3 (10): 1221–4. PMID:15467468
13. NCCN. Clinical practice guidelines in oncology: colon cancer. 2013. Available:http://www.nccn.org/ professionals/physician_gls/f_guidelines.asp
14. Chu E. An update on the current and emerging targeted agents in metastatic colorectal cancer. Clin Colorectal Cancer. 2012; 11 (1): 1–13. doi:10.1016/j.clcc.2011.05.005PMID:21752724
15. Baselga J. Why the epidermal growth factor receptor? The rationale for cancer therapy. The Oncolo-gist. 2002; 7(Supp 4): 2–8.
16. Weidlich S, Walsh K, Crowther D, Burczynski ME, Feuerstein G, Carey FA, et al. Pyrosequencing-based methods reveal marked inter-individual differences in oncogene mutation burden in human colorectal tumours. Brit J Cancer. 2011; 105 (2): 246–54. doi:10.1038/bjc.2011.197PMID:21712828
18. Bunz F, Dutriaux A, Lengauer C, Waldman T, Zhou S, Brown JP, et al. Requirement for p53 and p21 to Sustain G2 Arrest After DNA Damage. Science 1998; 282 (5393): 1497–1501. PMID:9822382
19. Barnetson RA, Tenesa A, Farrington SM, Nicholl ID, Cetnarskyj R, Porteous ME, et al. Identification and survival of carriers of mutations in DNA mismatch-repair genes in colon cancer. N Engl J Med 2006; 354 (26): 2751–63. PMID:16807412
20. Faratian D, Goltsov A, Lebedeva G, Sorokin A, Moodie S, Mullen P, et al. Systems biology reveals new strategies for personalizing cancer medicine and confirms the role of PTEN in resistance to tras-tuzumab. Cancer Res. 2009; 69 (16): 6713–20. doi:10.1158/0008-5472.CAN-09-0777PMID: 19638581
21. Spurrier B, Ramalingam S, Nishizuka S. Reverse-phase protein lysate microarrays for cell signaling analysis. Nat Protoc. 2008; 3 (11): 1796–808. doi:10.1038/nprot.2008.179PMID:18974738
22. Meyer C, Sims AH, Morgan K, Harrison B, Muir M, Bai J, et al. Transcript and protein profiling identify signaling, growth arrest, apoptosis and NFκB-survival signatures following GnRH receptor activation.
Endocr Relat Cancer. 2013; 20 (1): 123–136. doi:10.1530/ERC-12-0192PMID:23202794
23. Glaab E, Garibaldi JM, Krasnogor N. ArrayMining: a modular web-application for microarray analysis combining ensemble and consensus methods with cross-study normalization. BMC Bioinformatics. 2009; 10: 358. doi:10.1186/1471-2105-10-358PMID:19863798
24. Huang da W, Sherman BT, Lempicki RA. Systematic and integrative analysis of large gene lists using DAVID bioinformatics resources. Nat Protoc. 2009; 4 (1): 44–57. doi:10.1038/nprot.2008.211PMID: 19131956
25. de Hoon MJ, Imoto S, Nolan J, Miyano S. Open source clustering software. Bioinformatics. [Compara-tive StudyEvaluation StudiesValidation Studies]. 2004; 20 (9): 1453–4. PMID:14871861
26. Saeed AI, Sharov V, White J, Li J, Liang W, Bhagabati N, et al. TM4: a free, open-source system for microarray data management and analysis. Bioechniques. 2003; 34 (2): 374–8.
27. Kononen J, Bubendorf L, Kallioniemi A, Barlund M, Schraml P, Leighton S, et al. Tissue microarrays for high-throughput molecular profiling of tumor specimens. Nat Med. 1998; 4 (7): 844–7. PMID: 9662379
28. Faratian D, Christiansen J, Gustavson M, Jones C, Scott C, Um I, et al. Heterogeneity mapping of pro-tein expression in tumors using quantitative immunofluorescence. J Vis Exp. 2011: e3334. doi:10. 3791/3334PMID:22064683
29. McCabe A, Dolled-Filhart M, Camp RL, Rimm DL. Automated quantitative analysis (AQUA) of in situ protein expression, antibody concentration, and prognosis. J Natl Cancer Inst. 2005; 97 (24): 1808–
15. PMID:16368942
30. Varella-Garcia M, Diebold J, Eberhard DA, Geenen K, Hirschmann A, Kockx M, et al. EGFR fluores-cence in situ hybridisation assay: guidelines for application to non-small-cell lung cancer. J Clin Pathol. 2009; 62 (11): 970–7. doi:10.1136/jcp.2009.066548PMID:19861557
31. Wolff AC, Hammond ME, Schwartz JN, Hagerty KL, Allred DC, Cote RJ, et al. American Society of Clinical Oncology/College of American Pathologists guideline recommendations for human epidermal growth factor receptor 2 testing in breast cancer. J Clin Oncol. 2007; 25 (1): 118–45. PMID:
17159189
32. Knutsen T, Padilla-Nash HM, Wangsa D, Barenboim-Stapleton L, Camps J, McNeil N, et al. Definitive molecular cytogenetic characterization of 15 colorectal cancer cell lines. Genes, chromosomes & can-cer. 2010; 49 (3): 204–23.
33. Bracht K, Nicholls AM, Liu Y, Bodmer WF. 5-Fluorouracil response in a large panel of colorectal can-cer cell lines is associated with mismatch repair deficiency.Br J Cancan-cer. 2010; 103 (3):340–6. doi:10. 1038/sj.bjc.6605780PMID:20606684
34. Longley DB, Johnston PG. 5-Fluorouracil: Apoptosis, Cell Signaling, and Human Diseases. In: Srivas-tava R, editor.: Humana Press; 2007. p. 263–278.
35. Mariadason JM, Arango D, Shi Q, Wilson AJ, Corner GA, Nicholas C, et al. Gene expression profiling-based prediction of response of colon carcinoma cells to 5-fluorouracil and camptothecin. Cancer Res. 2003; 63 (24): 8791–812. PMID:14695196
36. Fink D, Nebel S, Aebi S, Zheng H, Cenni B, Nehmé A, et al. The Role of DNA Mismatch Repair in Plat-inum Drug Resistance. Cancer Res. 1996; 56 (21): 4881–6. PMID:8895738
37. Boyer J, McLean EG, Aroori S, Wilson P, McCulla A, Carey PD, et al. Characterization of p53 Wild-Type and Null Isogenic Colorectal Cancer Cell Lines Resistant to 5-Fluorouracil, Oxaliplatin, and Irino-tecan. Clin Cancer Res. 2004; 10 (6): 2158–67. PMID:15041737