Colon Cancer Progression
In Vitro
and
In Vivo
Wen-Juan Wang
1☯, Yu Yao
1☯, Li-Li Jiang
1, Ting-Hua Hu
1, Jie-Qun Ma
1, Zi-Jun Liao
2, Jun-Tao Yao
2,
Dong-Fan Li
3, Shu-Hong Wang
1*, Ke-Jun Nan
1*1 Department of Oncology, First Affiliated Hospital of Medical College of Xi’an Jiaotong University, Xi’an, China, 2 Affiliated Shaanxi Provincial Cancer Hospital, College of Medicine, Xi’an Jiaotong University, Xi’an, China, 3 Xi’an Central Hospital, Xi’an, China
Abstract
Expression of lymphoid enhancer factor 1 (LEF1) is frequently altered in different human cancers. This study aimed to assess LEF1 expression in colon cancer tissues and to explore changed phenotypes, gene expressions, and the possible mechanism after knocked down LEF1 expression in colon cancer cell lines. A total of 106 colon cancer and matched paratumorous normal tissues were used to assess LEF1 expression using immunohistochemistry and qRT-PCR. LEF1 lentivirus was used to knockdown LEF1 expression for the assessment of cell viability, cell cycle distribution, apoptosis, and gene expressions. The nude mouse xenograft assay was performed to detect the effects of LEF1 knockdown in vivo. The data showed that the levels of LEF1 mRNA and protein were significantly increased in human colon cancer tissues compared to the matched paratumorous normal tissues and were associated with infiltration depth, lymph node and distant metastases, advanced TNM (tumor-node-metastasis) stages, and shorter overall survival. Furthermore, LEF1 knockdown reduced tumor cell viability, invasion capacity, MMPβ and MMP-9 expression, but induced apoptosis. Nude mouse xenograft assay showed that LEF1 knockdown suppressed tumor formation and growth in vivo. In addition, the expression of Notch pathway-related proteins RBP-jκ and Hes1 was reduced in LEF1 knockdown cells. Taken together, LEF1 protein was overexpressed in colon cancer tissues and knockdown of LEF1 expression inhibited colon cancer growth in vitro and in vivo. These data suggest that targeting of LEF1 expression should be further evaluated for colon cancer prevention and therapy.
Citation: Wang W-J, Yao Y, Jiang L-L, Hu T-H, Ma J-Q, et al. (β01γ) Knockdown of Lymphoid Enhancer factor 1 Inhibits Colon Cancer Progression In Vitro and In Vivo. PLoS ONE 8(10): e76596. doi:10.1γ71/journal.pone.0076596
Editor: Xin-Yuan Guan, The University of Hong Kong, China
Received May γ1, β01γ; Accepted September γ, β01γ; Published October β, β01γ
Copyright: © β01γ Wang et al. This is an open-access article distributed under the terms of the Creative Commons Attribution License, which permits unrestricted use, distribution, and reproduction in any medium, provided the original author and source are credited.
Funding: This work was supported by a grant from the National Natural Science Foundation of China (No.81001090) (http://www.nsfc.gov.cn/nsfc/cen/ xxgk/slzz.html). The funders had no role in study design, data collection and analysis, decision to publish, or preparation of the manuscript. No additional external funding was received for this study.
Competing interests: The authors have declared that no competing interests exist. * E-mail: nankejun@1β6.com (K-JN); wshβ00γ@1β6.com (S-HW)
☯ These authors contributed equally to this work.
Introduction
Colon cancer is one of the most common cancer in both men and women in the world, accounting for the second cause of cancer death in the United States [1,β] and the fourth in China [γ]. Thus, colon cancer still remains a major global public health problem, although there is a significantly worldwide decline in cancer-related mortality of colon cancer over the last few decades, due to the considerable progress in early diagnosis and effective treatments. To date, the pathogenesis and molecular mechanism responsible for colon cancer development have been comprehensively studied and a large body of knowledge has been generated regarding molecular alterations associated with colon carcinogenesis, which involves activation of oncogenes and silence of tumor suppressor genes [4]. However, much more needs to be done
for the precise understanding of colon carcinogenesis and developing novel strategies to effectively control this disease.
To this end, our research is focusing on lymphoid enhancer-binding factor-1 (LEF1), a member of high mobility group
(HMG) protein family. LEF1 codes a 48-kD nuclear protein that
protein containing -catenin binding domains can regulate cell proliferation and invasion of tumor cells [1γ]. Multiple factors could influence LEF1 expression, such as fibroblast growth factor-β, PITXβ, and hepatocyte growth factor [14–16].
Thus, in this study, we first detected LEF1 expression in colon cancer tissues compared with the paratumorous colon tissues and then investigated the effects of LEF1 knockdown in the regulation of colon cancer cell viability, cell cycle distribution, apoptosis, and gene expression in vitro and in nude mouse xenografts. We also explored the effects of LEF1 knockdown on the regulation of Notch pathway.
Materials and Methods
Ethics Statement
The study was approved by the Conduct of Human Ethics Committee of the First Affiliated Hospital, College of Medicine of Xi’an Jiaotong University. Written informed consents were obtained from all patients.
The animal experimental protocol was approved by the Animal Care and Use Committee of the Medical School of Xi’an Jiaotong University.
Patients and samples
In this study, we retrospectively recruited 106 pairs of surgically resected colon cancer and paratumorous normal tissue specimens (5 cm away from the tumor lesion) from The First Affiliated Hospital, College of Medicine of Xi’an Jiaotong University between January β006 and March β007. These tissue samples were obtained from 60 male and 46 female patients with a mean age of 55.5 years (range from γ0 to 81 years). Clinicopathological features of these patients are shown in Table 1. Pathological diagnosis of these specimens was independently re-confirmed by two pathologists in a blinded fashion. All patients were not treated with any chemotherapy or radiotherapy before surgery. The last patient follow-ups were conducted at the end of May β01β. The patients who were lost to follow-up or death from causes other than colon cancer were regarded as censored data during the survival analysis.
Histopathology and immunohistochemistry
Paraffin-embedded sections (5 µm) were deparaffinized and rehydrated through a series of graded alcohols. For immunohistochemistry, a primary antibody against LEF1 (C1βA5, Cell Signaling Technology, Danvers, MA) was used at a dilution of 1:100, and incubated overnight at 4°C. The sections were incubated with an isotype-matched control antibody as a negative control. Next, the sections were stained with a biotin-conjugated secondary antibody and the color was developed by using 0.05% γ’, γ’-diaminobenzidine
tetrahydrochloride followed by counterstaining with
hematoxylin. The sections were finally reviewed and scored under an Olympus microscope (BX41; Tokyo, Japan), according to a previous study using multiplying the intensity score and the extent of staining score [17]. The staining intensity was scored as 0 (no staining), 1 (weak staining), β (medium staining), or γ (strong staining). The extent of staining
was evaluated by assigning samples scores based on the percentage of positively stained cells as follows: 0 (0%), 1 (1-β5%), β (β6-50%), γ (51-75%), and 4 (76-100%). The number of positive cells was assessed by counting 10 random fields at ×400 magnification. The final score was ranged from 0 to 1β. A score of 0-β was defined as negative expression, scores γ-5 as “weak expression”, scores 6-9 as “moderate expression” and scores 10-1β as “strong expression”. For the purpose of further analysis the samples with score 0-5 were defined as markedly reduced staining or loss of LEF1 expression, while the samples with scores 6-1β were grouped and defined as positive expression.
Real-time reverse transcription–polymerase chain reaction
Total cellular RNA was isolated from tissues and cell lines using the TRIzol reagent (Invitrogen, Carlsbad, CA), according to the manufacturer’s instructions. These RNA samples were then reversely transcribed into cDNA using an RT-PCR kit (Takara, Dalian, China). Real-time PCR was then performed in iQ5 Multi-color Real-Time PCR Detection System (Bio-Rad, Hercules, CA) using SYBR Premix Ex Taq TM II (Takara). The
primer sequences to amplify LEF1 were:
5'-AGCGAATGTCGTTGCTGAGTGTA-γ' and
5'-CTCTTGCAGACCAGCCTGGATAA-γ'. A housekeeping gene GAPDH was used as the internal control, and the primer sequences were ACCACAGTCCATGCCATCAC-γ' and 5'-TCCACCACCCTGTTGCTGTA-γ'. The data were acquired as a threshold cycle (ΔCt) value. The ΔCt values were determined Table 1. Association of LEF1 expression with clinicopathological factors from patients.
Clinicopathological variables N LEF1 expression score (mean ± SD)P value
Age (years)
<60 41 4.87 ± β.γγ 0.50β
≥60 65 5.β1 ± β.65
Tumor differentiation
Well 50 4.84 ± 1.94 0.β74
Moderate γ9 4.95 ± β.87
Poor 17 5.59 ± γ.0β
Infiltration depth
T1 + Tβ 40 4.1β ± 1.98 0.00β
Tγ + T4 66 5.66 ± β.56
Lymph node metastasis
N0 46 4.06 ± β.1β <0.001
N1-γ 60 5.85 ± β.74
Distant metastasis
M0 86 4.69 ± β.04 0.004
M1 β0 6.γ1 ± β.77
TNM stage
I 8 1.γ9 ± γ.βγ <0.001
II γγ 4.14 ± β.40
III 45 5.γγ ± β.β5
IV β0 7.1β ± β.69
by subtracting the average internal housekeeping gene Ct
value from the average target gene Ct value. Since the
amplification efficiency of the target genes and internal control gene was equal, the relative gene expression was calculated
using the β-ΔΔCt method. Each measurement was performed in
triplicate.
Construction of lentivirus vector carrying LEF1 shRNA
A LEF1 shRNA lentivirus vector (U6-vshRNA-CMV-PUR-GFP-GVβ48-shLEF1) was designed, synthesized, and constructed by Genechem Co. (Shanghai, China). The following target sequences in the human LEF1 gene were selected, i.e., target 1, GCTGACATCAAGTCTTCCTTG; target
β, GTGAAGAGCAGGCTAAATATT; target γ,
GCTGGTCTGCAAGAGACAATT; and target 4, GCTCA TTCCCAACGTGCAAAG. Target γ was chosen for the subsequent experiments. The lentivirus vector U6-vshRNA-shNC, which encodes a random RNAi sequence, was used as a negative control.
Cell lines, culture, gene transfection and treatments
Human colon cancer cell lines, Cacoβ, coloβ05, HCT116,
HTβ9, and Lovo were obtained from Cell Resource Center, Shanghai Institutes for Biological Sciences (Shanghai, China) and cultured in Dulbecco’s modified Eagle medium (DMEM) (HyClone, Logan, UT, USA) supplemented with 10% fetal bovine serum (FBS; Invitrogen), penicillin (100 IU/ml), and
streptomycin (0.1 mg/ml) in 5% COβ at γ7°C. A human colon
cancer cell line SW480 was cultured in RPMI1640 medium (HyClone, Logan, UT, USA) supplemented with 10% FBS,
penicillin (100 IU/ml), and streptomycin (0.1 mg/ml) in 5% COβ
at γ7°C, while another human colon cancer cell line, SW6β0, was cultured in L-15 medium (Invitrogen) supplemented with 10% FBS, penicillin (100 IU/ml), and streptomycin (0.1 mg/ml) in 5% COβ at γ7°C. SW480 and SW6β0 cells were infected
with lentivirus vectors at a multiplicity of infection (MOI) of 10 and 100, respectively, and then selected in containing growth medium. After 7 days of culture, puromycin-resistant colonies were picked up, expanded and analyzed separately.
-secretase inhibitor DAPT (100 µM; Sigma-Aldrich, USA) was used for pharmacological inhibition assays, which can effectively block Notch intracellular domain (NICD) entering into the cell nucleus. In brief, these cells were seeded into six-well plates and treated with β ml medium containing 1% FBS and DAPT. Control cells were treated with equal amounts of dimethyl sulfoxide (DMSO). After 48h of incubation, the cell extracts were prepared for Western blot as described below.
Protein extraction and Western blot
Protein was extracted from the tissues and cells, and these protein lysates were separated by 6%-1β% sodium dodecylsulfate polyacrylamide gel electrophoresis; separated proteins were then electronically blotted onto polyvinylidene difluoride membranes (Millipore, Danvers, MA). The membranes were then blocked and subsequently incubated with the following primary antibodies: anti-LEF1 antibody (1:800; Cell Signaling Technology, Danvers, MA), anti-MMPβ
(1:500; Cell Signalling Technology, Danvers, MA), anti-MMP7 (1:100; Santa Cruz Biotechnology, Santa Cruz, CA), anti-MMP9 (1:100; Santa Cruz Biotechnology, Santa Cruz, CA), anti-NICD (1:800; Cell Signalling Technology), anti-RBP-jκ (1:100; Santa Cruz Biotechnology, Santa Cruz, CA), anti-Hes1 (1:50; Santa Cruz Biotechnology), or anti- -actin antibody (1:1000; Santa Cruz Biotechnology). At last, the blots were visualized by an ECL detection system (Millipore) with a horseradish peroxidase-conjugated secondary antibody (Santa Cruz Biotechnology). Western blots were repeated three times for each protein sample.
Cell viability MTT assay
Cells (5×10γ per well) were seeded with β00 µl of growth
medium in a 96-well plate and grown up to 7 days. At the end of the experiments, γ-[4,5-dimethylthiazol-β-yl]-β,5-diphenyl-tetrazolium bromide (MTT, 0.5mg/ml, Sigma-Aldrich, St. Louis, MO, USA) was added to each well. The cells were then cultured at γ7°C for 4h, and 150 µl DMSO was added into each well and mixed by shaking at room temperature for 10 min. After that, the absorption rate was measured at a wavelength of 490 nm using a spectrophotometer. Each experiment was done in triplicate and repeated at least three times.
Flow cytometry cell cycle and apoptosis assays
For cell cycle analysis, cells (5×10⁵) were grown and
collected, washed two times with phosphate buffered saline (PBS), and fixed with ice-cold 70% ethanol for β4 h at 4°C. The fixed cells were stained with 150 µl propidium iodide and 150µl RNase A (Sigma-Aldrich) sequentially. After incubation for γ0 min at γ7°C, the samples were examined by a flow cytometer (FACS-Caliber, Franklin Lakes, NJ), and Cell Quest software was used to analyze the data. Each experiment was repeated at least three times.
For apoptosis analysis, cells (5×10⁵ per well) were cultured in
six-well plates, collected, and washed two times with ice cold PBS. Next, 500 µl of the binding buffer, 5 µl Annexin V-APC, and 5 µl 7-AAD (KeyGEN BioTECH, Nanjing, China) were sequentially added to the samples. After mixing and incubation for 15 min at γ7°C, the samples were run on the flow cytometry immediately. Each experiment was repeated at least three times.
Tumor cell Matrigel invasion assay
The invasion capacity of colon cancer cells was assessed by using a Millicell invasion chamber (Millipore, Billerica, MA, USA). The 8 µm pore inserts were coated with Matrigel (Becton and Dickinson Company, Franklin Lakes, NJ, USA). Cells
(5×10⁴) were re-suspended with β00 µl of serum-free medium
Nude mouse tumor cell xenograft assay
Male BALB/c nude mice (ages between 4 and 6 weeks; Shanghai Experimental Animal Center, Shanghai, China) were subcutaneously inoculated with 1×10⁷ cells and housed in a
pathogen-free facility of the Animal Center of Xi’an Jiaotong University. The tumor volume was determined by length (L) and width (W), measured with a sliding calliper and calculated as L × Wβ×0.5. The mice were euthanized 45 days after the
subcutaneous injection of tumor cells. Tumor bearing nude mice were observed by IVIS imaging system (IVIS spectrum, Xenogen, CA, USA) before being sacrificed.
Statistical analysis
All statistical analyses were performed using the SPSS 17.0 software (SPSS Inc., Chicago, IL). Descriptive data were analyzed with Pearson’s chi-square test (two sided).
Measurement data were analyzed with Student’s t-test or
analysis of variance (ANOVA). A P value of less than 0.05 was
considered statistically significant.
Results
LEF1 expression in human colon cancer tissues and cell lines
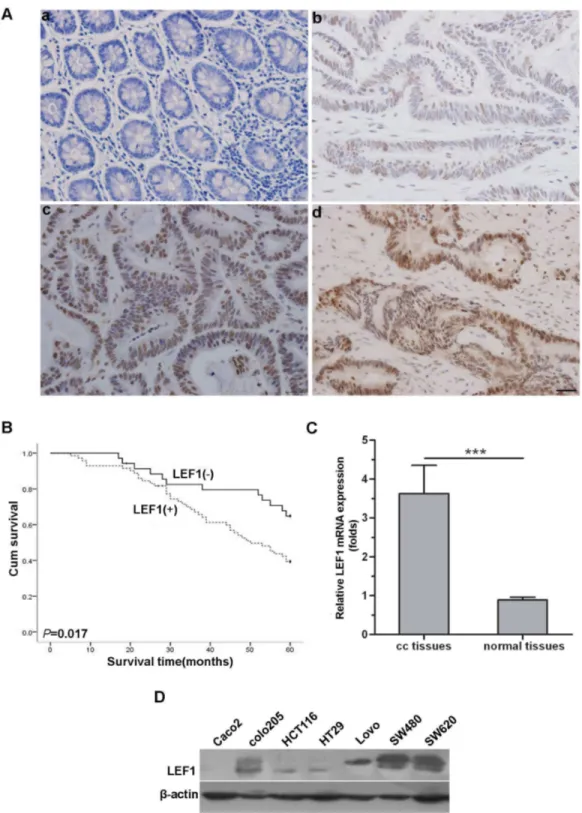
In this study, we first determined expression of LEF1 protein in human colon cancer tissues and cell lines using immunohistochemistry. The results showed that 71 of 106 colon tissues and βγ of 106 paratumours normal colon tissues expressed the LEF1 protein, indicating that colon cancer tissues expressed higher levels of LEF1 than those in the
paratumours normal colon tissues (P<0.05; Figure 1A).
Obviously, LEF1 expression was observed in the nuclei in colon cancer tissues and paratumours normal colon tissues (Figure 1A). Moreover, expression of LEF1 protein was associated with infiltration depth, lymph node and distant metastases, and advanced TNM (tumor-node-metastasis) stages of colon cancer (P<0.01; Table 1). The survival analysis (5-year follow-up of 106 colon cancer patients) showed that the median survival rate of patients with LEF1 expressed tumor was 48.5 months, which was significantly poorer than those with LEF1-negative tumors (more than 60 months) (P<0.05; Figure 1B).
Similarly, real-time PCR analysis showed that levels of LEF1 mRNA were significantly increased in these 106 pairs of colon cancer tissues compared to the paratumours normal colon tissues (P<0.05; Figure 1C). Furthermore, LEF1 expression was highly expressed in colon cancer cell lines SW480 and SW6β0 (Figure 1D). Thus, we chose these two cell lines to knockdown LEF1 expression for further study.
Stable knockdown of LEF1 expression in colon cancer cells
To explore the role of LEF1 on colon cancer cells, we utilized a lentivirus carrying LEF1 shRNA to infect SW480 and SW6β0 for knockdown of LEF1 expression. Target γ was used to establish the stable LEF1 knockdown cell lines. We successfully obtained stable LEF1 knockdown cells termed
shLEF1 and shNC (with negative control vector). Real-time PCR analysis showed that the expression of LEF1 mRNA was inhibited up to 70% in shLEF1 cells compared to shNC cells (P<0.05; Figure βA). Similarly, the levels of LEF1 protein were also knocked down significantly in shLEF1 cells than in shNC cells (Figure βB).
Knockdown of LEF1 expression inhibited viability of colon cancer cells in vitro and tumor formation and growth in vivo
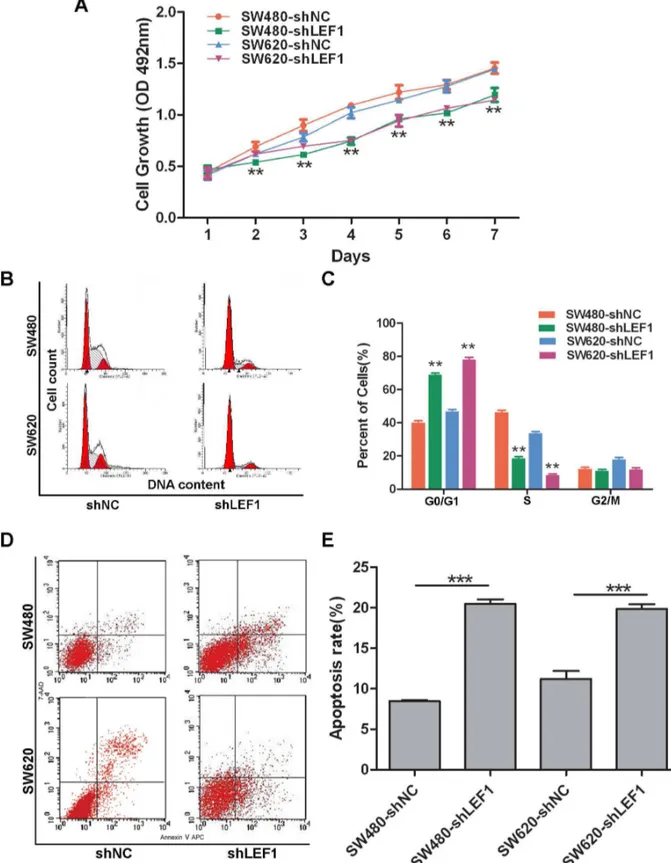
Stable LEF1 shRNA transfectants were seeded and grown in the puromycin-containing growth medium for the assessment of cell viability. Our data showed that SW480-shLEF1 cells and SW6β0-shLEF1 cells grew much slower than SW480-shNC cells and SW6β0-shNC cells, respectively (P<0.01; Figure γA). Cell cycle distribution detected by a flow cytometer showed a prolonged and prominent delay of G0 / G1 phase progression to S phase in shLEF1 cells compared to that of shNC cells (P<0.01; Figure γB and γC). Moreover, we further analyzed whether the reduced tumor cell viability is due to induction of apoptosis and found that SW480 and SW6β0 cells with stable LEF1 shRNA transfection had significantly more apoptosis compared to the control cells (Figure γD and γE).
Furthermore, we performed a nude mouse xenograft assay
to assess the role of LEF1 knockdown in vivo. Forty five days
after tumor cell injection, LEF1 knockdown-tumor xenografts showed a reduction of tumor growth compared to control-shNC tumor xenografts. Additionally, in vivo imaging showed that both types of mice did not have observable tumor metastases to the distant organs (Figure 4A). The average volumes of the tumor mass derived from SW480-shLEF1 cells and SW6β0-shLEF1 cells were much smaller than those of tumor xenografts derived from SW480-shNC cells and SW6β0-shNC cells, respectively (P<0.001; Figure 4B). The tumor weight also showed that knockdown of LEF1 expression inhibited the growth of colon cancer cells in nude mice (Figure 4C), because the weight of tumors mass in SW480 and SW6β0 cells expressing shLEF1 was significantly lighter than those in the control mice. These finding suggested that LEF1 knockdown inhibited formation and growth of tumor xenografts in vivo.
Knockdown of LEF1 expression decreased invasion of colon cancer cells and expression of MMP-2 and MMP-9
Figure 1. Expression of LEF1 mRNA and protein in colon cancer tissues, paratumorous colon tissues and colon cancer cell lines. (A) Immunohistochemistry staining of LEF1 on paratumorous colon tissues (a) and colon cancer tissues (b-d) (scale bar, β5µm): (a) negative expression, (b) weak expression, (c) moderate expression, (d) strong expression. (B) Kaplan-Meier curve for association of LEF1 protein expression with overall survival of patients. (C) qRT-PCR was used to detect the relative expression levels of LEF1 mRNA (cc tissues: colon cancer tissues; normal tissues: paratumorous colon tissues). Columns, mean (n=106); bars, SD; ***P<0.001 compared with paratumorous colon tissues. P value was determined by Student’s t-test. (D) Western blot analysis
of LEF1 expression in seven colorectal cancer cells (Cacoβ, coloβ05, HCT116, HTβ9, Lovo, SW480, and SW6β0). -actin was used
as internal control.
Knockdown of LEF1 expression inhibited RBP-jκ activity
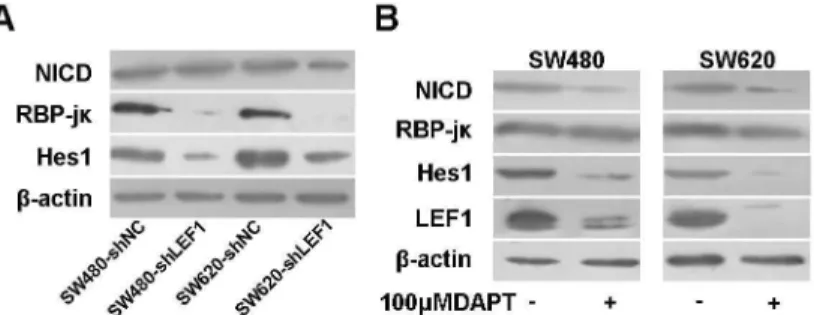
To date, several studies have reported that Wnt and Notch pathway cooperatively control cell proliferation and tumorigenesis in the intestines [18]. To disclose the possible convergent points and to clarify the potential mechanism by which LEF1 regulates proliferation and tumorigenesis, we detected the expression of Notch intracellular domain (NICD)/ RBP-jκ/Hes1 pathway genes in these colon cancer cells. We did not find any significant difference in levels of NICD expression in colon cancer cells with different treatments; however, the levels of RBP-jκ and Hes1 proteins were reduced in SW480-shLEF1 cells and SW6β0-shLEF1 cells compared with control cells (Figure 6A).
Our unpublished data showed an increased activity of full-length LEF1 promoter upon co-transfection of NICD cDNA in SW480, HepGβ, HEKβ9γ, A549, and HeLa cells; thus, we utilized DAPT, an inhibitor of Notch pathway, to block NICD expression in SW480 and SW6β0 cells. Our data showed that NICD downregulation affected expression of Hes1 and LEF1 proteins (Figure 6B), suggesting a reciprocal regulation between LEF1 and Notch pathway.
Discussion
In the current study, we first analysed the expression of LEF1 mRNA and protein in colon cancer tissue specimens and then investigated the effects of LEF1 knockdown on the regulation of changed tumor cell viability, cell cycle distribution,
apoptosis, and gene expressions in vitro and on nude mouse
xenografts. We found that levels of LEF1 mRNA and protein
were significantly increased in colon cancer tissues and associated with infiltration depth, lymph node and distant metastases and shorter overall survival. LEF1 knockdown reduced tumor cell viability, invasion capacity, and expression of MMPβ and MMP-9, but induced apoptosis in colon cancer cells. LEF1 knockdown suppressed tumor formation and growth in nude mice. Moreover, the expression of RBP-jκ and Hes1 was reduced in LEF1 knockdown cells. These data suggest that LEF1 could be further evaluated as a target for colon cancer prevention and treatment.
Previous studies demonstrated that the expression and activation of LEF1 protein contributed to cancer development [10,1γ,19]. Indeed, our current study analysed the expression of LEF1 mRNA and protein in colon cancer and paratumorous colon tissues and found that LEF1 was overexpressed in colon cancer tissues. The levels of LEF1 expression were associated with infiltration depth, lymph node, and distant metastases, and advanced TNM stages of colon cancers as well as poor overall survival rate in patients with colon cancer. The latter data were different from the data reported by Kriegl, L et al [β0], but were similar to another previous study [β1]. These data suggest that LEF1 may be a useful marker for the prediction of colon cancer progression.
To further understand the role of LEF-1 in colon cancer, we knocked down LEF1 expression in two colon cancer cell lines, SW480 and SW6β0. We further explored the role of LEF1 in the growth of colon cancer. Cell cycle disorganisation was defined as an inducer that lead to uncontrolled cell proliferation and cancer progression followed by tumorigenesis, for example, Shtutman et al identified that cyclin D1 was one of the -catenin/LEF1 complex target genes [ββ], which was Figure 2. Establishment of stable LEF1 knockdown cell lines. (A) qRT-PCR analysis of LEF1 expression after infection of different LEF1 shRNA expression lentivirus vectors, *P<0.05 compared to the parent cell. (B) Western blot analysis of LEF1 protein expression. -actin was used as internal control. 1-4 (different target position vectors) and shNC (negative control). Target γ was used to establish the stable LEF1 knockdown cell lines.
Figure 3. Effects of LEF1 knockdown on inhibition of colon cancer cell viability in vitro. (A) MTT assay. **P<0.01 compared with the corresponding shNC cells. (B and C) Flow cytometric cell cycle distribution. Columns, mean (n=γ); bars, SD; **P<0.01 compared with the corresponding shNC cells. (D and E) Flow cytometric apoptosis assay. Cell spontaneous apoptosis was
assessed by flow cytometry. Columns, mean (n=γ); bars, SD; ***P<0.001 compared to the control shNC cells.
responsible for tumor cell proliferation and tumor progression. Consistent with this study, our current data showed that downregulation of LEF1 significantly inhibited colon cancer cell proliferation in vitro by increasing the sub-G1 apoptotic population, prolonging the G0/G1 phase, and reducing Gβ/S
phase in LEF1-knocked down SW480 and SW6β0 cells in vitro
and in nude mouse xenografts, which confirmed two other previous studies in human endometrial and colon cancers [9,βγ].
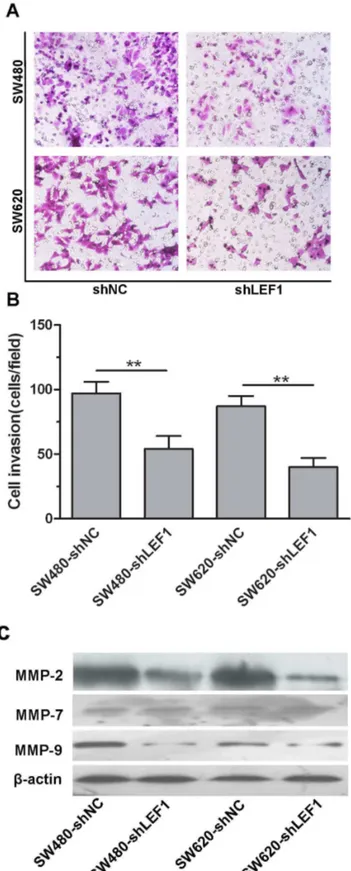
Furthermore, our current study showed that LEF1 overexpression in the primary CRC tissues was associated with distant metastasis of CRC patients, which is consistent with several previous studies documenting that LEF1 was characterized as a biomarker for colon cancer to metastasize to the liver [β1]. Indeed, our current in vitro data confirmed that knockdown of LEF1 expression inhibited invasion ability of SW480 and SW6β0 cells compared with the control shRNA-transfected cells. At the molecular level, MMPβ, MMP7 and MMP9 are associated with cell migration process, influencing cancer development and progression [β4,β5]. We found that knockdown of LEF1 expression suppressed MMPβ and MMP-9 expression, but not MMP-7, indicating that the selective modulation of MMPs by LEF1 could have the biological significance in colon cancer progression. In contrast, LEF1 was able to regulate MMP-7 expression and activity in breast cancer cells [β6], whereas another previous study showed that circulating MMP-β and MMP-9 could be used to potentially classify patients into low risk, high risk, benign disease, and breast cancer [β4]. However, our nude mouse xenograft assay did not show any tumor metastasis in both the LEF-1 knockdown and the control tumor xenografts; thus, additional studies are clearly needed.
In addition, the Notch pathway is frequently activated in various human cancers, such as cancers of the brain, mammary glands, cervix, lung, head and neck, colon, kidney, pancreas, and acute myeloid [β7,β8]. Inhibition of Notch pathway induced tumor cells to apoptosis and reduced tumor cell proliferation in colorectal cancer [β9]. A recent publication
showed that the Wnt pathway was able to regulate the Notch pathway [γ0]. The cross talk between Notch and Wnt pathways may be partially mediated by the specific regulation of GSKγ -dependent Notch phosphorylation. Phosphorylation of Notch proteins has been indirectly correlated with Notch activation and nuclear translocation as well as cellular transformation. In addition, Jagged1, one of Notch ligands, can be activated by -catenin during ectopic hair follicle formation in adult epidermis [γ1]. In our current study, we found that expression of Notch pathway-related genes RBP-jκ and Hes1 were markedly reduced, and the expression level of NICD was not changed after silence of LEF1 protein expression, which may in turn influence the Notch pathway and the Notch target gene, Hes1 expression, and activation. However, because the Notch pathway can be regulated by multiple factors, only blockage of LEF1 expression may not totally inhibit activity of the Notch pathway. Nevertheless, to date, there is no study showing that knockdown of LEF1 expression could inhibit RBP-jκ activity. Indeed, in search of literature, we found that Ungerback et al identified the promoter of RBP-jκ gene indeed contains five putative LEF1/TCF-site [γβ], which suggested LEF1 may directly regulate expression of RBP-jκ. However, further studies are needed to confirm that they are functional. Furthermore, we also observed that inactivation of Notch by using DAPT reduced LEF1 expression, suggesting that there is an interesting reciprocal regulation of LEF1 and Notch pathway. This finding is consistent with a previous study [γγ].
However, our current study is just proof-of-principle and much more needs to be done to clarify the function and role of LEF1 in colon cancer development and progression. Further studies will verify LEF1 as a biomarker for the prediction of colon cancer progression and survival of patients. Thereafter, we will evaluate LEF1 as a promising therapeutic target for the prevention and therapy of colon cancer.
Figure 4. Effects of LEF1 knockdown on regulation of formation and growth of nude mouse xenografts. (A) Invivo imaging analysis. Growth of tumors formed by shLEF1 cells and control shNC cells in nude mice was imaged by IVIS. (B) Tumor volume was measured every γ days from day 9 after the inoculation by measuring tumor length and width. Columns, mean (n=6); bars, SD;
***P<0.001 compared to the control shNC cells. (C) Tumor weight was compared on day 45 after tumor cell inoculation. Columns,
mean (n=6); bars, SD; ***P<0.001 compared to the control shNC.
Figure 5. Effects of LEF1 knockdown on regulation of tumor cell invasion and expression of MMP2 and MMP9 proteins in vitro. (A and B) Tumor cell invasion assay. Representative staining images, ×β00. Quantitative analysis of invaded tumor cells
between LEF1 knockdown and control cells. Columns, mean (n=γ); bars, SD; **P<0.01 compared to the control shNC cells. (C)
Western blot analysis to MMPβ, MMP-7 and MMP-9 protein. -actin was used as internal control.
Author Contributions
Conceived and designed the experiments: WJW KJN SHW. Performed the experiments: WJW YY THH LLJ JQM. Analyzed
the data: WJW SHW. Contributed reagents/materials/analysis tools: YY ZJL JTY DFL. Wrote the manuscript: WJW.
References
1. Jemal A, Siegel R, Xu J, Ward E (β010) Cancer statistics, β010. CA Cancer J Clin 60: β77-γ00. doi:10.γγββ/caac.β007γ. PubMed: β061054γ.
β. Gansler T, Ganz PA, Grant M, Greene FL, Johnstone P et al. (β010) Sixty years of CA: a cancer journal for clinicians. CA Cancer J Clin 60: γ45-γ50. doi:10.γγββ/caac.β0088. PubMed: β1075954.
γ. Lei T, Chen WQ, Zhang SW, Lei TH, Ying Q et al. (β009) [Prevalence trend of colorectal cancer in 10 cities and counties in China from 1988 to β00β]. Zhonghua Zhong Liu Za Zhi γ1: 4β8-4γγ. PubMed: 19950551. 4. Chen DL, Wang DS, Wu WJ, Zeng ZL, Luo HY et al. (β01γ) Overexpression of paxillin induced by miR-1γ7 suppression promotes tumor progression and metastasis in colorectal cancer. Carcinogenesis γ4: 80γ-811. doi:10.109γ/carcin/bgs400. PubMed: βγβ7515γ. 5. Waterman ML, Fischer WH, Jones KA (1991) A thymus-specific
member of the HMG protein family regulates the human T cell receptor C alpha enhancer. Genes Dev 5: 656-669. doi:10.1101/gad.5.4.656. PubMed: β010090.
6. Travis A, Amsterdam A, Belanger C, Grosschedl R (1991) LEF-1, a gene encoding a lymphoid-specific protein with an HMG domain, regulates T-cell receptor alpha enhancer function [corrected]. Genes Dev 5: 880-894. doi:10.1101/gad.5.5.880. PubMed: 18β74βγ. 7. Gao X, Wen J, Zhang L, Li X, Ning Y et al. (β008) Dapper1 is a
nucleocytoplasmic shuttling protein that negatively modulates Wnt signaling in the nucleus. J Biol Chem β8γ: γ5679-γ5688. doi:10.1074/ jbc.M804088β00. PubMed: 189γ6100.
8. Hoeppner LH, Secreto FJ, Razidlo DF, Whitney TJ, Westendorf JJ (β011) Lef1DeltaN binds beta-catenin and increases osteoblast activity and trabecular bone mass. J Biol Chem β86: 10950-10959. doi: 10.1074/jbc.M110.165100. PubMed: β1β701γ0.
9. Shelton DN, Fornalik H, Neff T, Park SY, Bender D et al. (β01β) The role of LEF1 in endometrial gland formation and carcinogenesis. PLOS ONE 7: e40γ1β. doi:10.1γ71/journal.pone.0040γ1β. PubMed: ββ79ββ74.
10. Waterman ML (β004) Lymphoid enhancer factor/T cell factor expression in colorectal cancer. Cancer Metastasis Rev βγ: 41-5β. doi: 10.10βγ/A:10β58589β86β0. PubMed: 15000148.
11. MacDonald BT, Tamai K, He X (β009) Wnt/beta-catenin signaling: components, mechanisms, and diseases. Dev Cell 17: 9-β6. doi: 10.1016/j.devcel.β009.06.016. PubMed: 19619488.
1β. Yokoyama NN, Pate KT, Sprowl S, Waterman ML (β010) A role for YY1 in repression of dominant negative LEF-1 expression in colon cancer. Nucleic Acids Res γ8: 6γ75-6γ88. doi:10.109γ/nar/gkq49β. PubMed: β05β579β.
1γ. Li Y, Wang L, Zhang M, Melamed J, Liu X et al. (β009) LEF1 in androgen-independent prostate cancer: regulation of androgen receptor expression, prostate cancer growth, and invasion. Cancer Res
69: γγγβ-γγγ8. doi:10.1158/0008-547β.CAN-08-γγ80. PubMed: 19γ51848.
14. Holnthoner W, Pillinger M, Groger M, Wolff K, Ashton AW et al. (β00β) Fibroblast growth factor-β induces Lef/Tcf-dependent transcription in human endothelial cells. J Biol Chem β77: 45847-4585γ. doi:10.1074/ jbc.Mβ09γ54β00. PubMed: 1ββγ5165.
15. Amen M, Liu X, Vadlamudi U, Elizondo G, Diamond E, et al. (β007) PITXβ and beta-catenin interactions regulate Lef-1 isoform expression. Mol Cell Biol β7: 7560-757γ. doi:10.11β8/MCB.00γ15-07. PubMed: 17785445. doi:10.11β8/MCB.00γ15-07 PubMed: 17785445
16. Huang FI, Chen YL, Chang CN, Yuan RH, Jeng YM (β01β) Hepatocyte growth factor activates Wnt pathway by transcriptional activation of LEF1 to facilitate tumor invasion. Carcinogenesis γγ: 114β-1148. doi: 10.109γ/carcin/bgs1γ1. PubMed: ββ4γ661γ.
17. Guo H, Lv Y, Tian T, Hu TH, Wang WJ et al. (β011) Downregulation of p57 accelerates the growth and invasion of hepatocellular carcinoma. Carcinogenesis γβ: 1897-1904. doi:10.109γ/carcin/bgrββ0. PubMed: ββ00βγ19.
18. Fre S, Pallavi SK, Huyghe M, Laé M, Janssen KP et al. (β009) Notch and Wnt signals cooperatively control cell proliferation and tumorigenesis in the intestine. Proc Natl Acad Sci U S A 106: 6γ09-6γ14. doi:10.107γ/pnas.09004β7106. PubMed: 19β516γ9. 19. Nguyen DX, Chiang AC, Zhang XH, Kim JY, Kris MG et al. (β009)
WNT/TCF signaling through LEF1 and HOXB9 mediates lung adenocarcinoma metastasis. Cell 1γ8: 51-6β. doi:10.1016/j.cell. β009.04.0γ0. PubMed: 195766β4.
β0. Kriegl L, Horst D, Reiche JA, Engel J, Kirchner T et al. (β010) LEF-1 and TCF4 expression correlate inversely with survival in colorectal cancer. J Transl Med 8: 1βγ. doi:10.1186/1479-5876-8-1βγ. PubMed: β109ββββ.
β1. Lin AY, Chua MS, Choi YL, Yeh W, Kim YH et al. (β011) Comparative profiling of primary colorectal carcinomas and liver metastases identifies LEF1 as a prognostic biomarker. PLOS ONE 6: e166γ6. doi: 10.1γ71/journal.pone.00166γ6. PubMed: β1γ8γ98γ.
ββ. Shtutman M, Zhurinsky J, Simcha I, Albanese C, D’Amico M et al. (1999) The cyclin D1 gene is a target of the beta-catenin/LEF-1 pathway. Proc Natl Acad Sci U S A 96: 55ββ-55β7. doi:10.107γ/pnas. 96.10.55ββ. PubMed: 10γ18916.
βγ. Wang SH, Nan KJ, Wang YC, Wang WJ, Tian T (β01β) The balance between two isoforms of LEF-1 regulates colon carcinoma growth. BMC Gastroenterol 1β: 5γ. doi:10.1186/1471-βγ0X-1β-5γ. PubMed: ββ6γ9890.
β4. Somiari SB, Somiari RI, Heckman CM, Olsen CH, Jordan RM et al. (β006) Circulating MMPβ and MMP9 in breast cancer -- potential role in classification of patients into low risk, high risk, benign disease and breast cancer categories. Int J Cancer 119: 140γ-1411. doi:10.100β/ijc. β1989. PubMed: 16615109.
Figure 6. Effects of LEF1 knockdown on regulation of Notch pathway gene expression. (A) Western blot analysis of NICD, RBP-jκ and Hes1 expression. (B) Western blot analysis of LEF1 expression after being treated with Notch pathway inhibitor DAPT (100 µM). -actin was used as internal control.
β5. Bourboulia D, Stetler-Stevenson WG (β010) Matrix metalloproteinases (MMPs) and tissue inhibitors of metalloproteinases (TIMPs): Positive and negative regulators in tumor cell adhesion. Semin Cancer Biol β0: 161-168. doi:10.1016/j.semcancer.β010.05.00β. PubMed: β0470890. β6. Bucan V, Mandel K, Bertram C, Lazaridis A, Reimers K et al. (β01β)
LEF-1 regulates proliferation and MMP-7 transcription in breast cancer cells. Genes Cells 17: 559-567. doi:10.1111/j.1γ65-β44γ.β01β.0161γ.x. PubMed: ββ686β79.
β7. Miele L (β006) Notch signaling. Clin Cancer Res 1β: 1074-1079. doi: 10.1158/1078-04γβ.CCR-05-β570. PubMed: 16489059.
β8. Miele L, Miao H, Nickoloff BJ (β006) NOTCH signaling as a novel cancer therapeutic target. Curr Cancer Drug Targets 6: γ1γ-γβγ. doi: 10.β174/156800906777441771. PubMed: 168487ββ.
β9. Pannequin J, Bonnans C, Delaunay N, Ryan J, Bourgaux JF et al. (β009) The wnt target jagged-1 mediates the activation of notch signaling by progastrin in human colorectal cancer cells. Cancer Res
69: 6065-607γ. doi:10.1158/0008-547β.SABCS-6065. PubMed: 196ββ776.
γ0. Espinosa L, Inglés-Esteve J, Aguilera C, Bigas A (β00γ) Phosphorylation by glycogen synthase kinase-γ beta down-regulates Notch activity, a link for Notch and Wnt pathways. J Biol Chem β78: γβββ7-γββγ5. doi:10.1074/jbc.Mγ04001β00. PubMed: 1β794074. γ1. Estrach S, Ambler CA, Lo Celso C, Hozumi K, Watt FM (β006) Jagged
1 is a beta-catenin target gene required for ectopic hair follicle formation in adult epidermis. Development 1γγ: 44β7-44γ8. doi: 10.1β4β/dev.0β644. PubMed: 170γ5β90.
γβ. Ungerbäck J, Elander N, Grünberg J, Sigvardsson M, Söderkvist P (β011) The Notch-β gene is regulated by Wnt signaling in cultured colorectal cancer cells. PLOS ONE 6: e17957. doi:10.1γ71/ journal.pone.0017957. PubMed: β14γ7β51.