scale family level reveals individual molecular
patterns
Domingues
et al.
R E S E A R C H A R T I C L E
Open Access
Analysis of plant LTR-retrotransposons at the
fine-scale family level reveals individual molecular
patterns
Douglas S Domingues
1,4†, Guilherme MQ Cruz
1†, Cushla J Metcalfe
1, Fabio TS Nogueira
2, Renato Vicentini
3,
Cristiane de S Alves
2and Marie-Anne Van Sluys
1*Abstract
Background:Sugarcane is an important crop worldwide for sugar production and increasingly, as a renewable energy source. Modern cultivars have polyploid, large complex genomes, with highly unequal contributions from ancestral genomes. Long Terminal Repeat retrotransposons (LTR-RTs) are the single largest components of most plant genomes and can substantially impact the genome in many ways. It is therefore crucial to understand their contribution to the genome and transcriptome, however a detailed study of LTR-RTs in sugarcane has not been previously carried out.
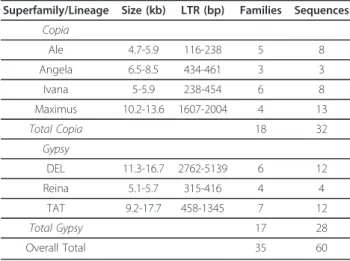
Results:Sixty complete LTR-RT elements were classified into 35 families within fourCopiaand threeGypsy
lineages. Structurally, within lineages elements were similar, between lineages there were large size differences. FISH analysis resulted in the expected pattern ofGypsy/heterochromatin,Copia/euchromatin, but in two lineages there was localized clustering on some chromosomes. Analysis of related ESTs and RT-PCR showed transcriptional variation between tissues and families. Four distinct patterns were observed in sRNA mapping, the most unusual of which was that ofAle1, with very large numbers of 24nt sRNAs in the coding region. The results presented support the conclusion that distinct small RNA-regulated pathways in sugarcane target the lineages of LTR-RT elements.
Conclusions:Individual LTR-RT sugarcane families have distinct structures, and transcriptional and regulatory signatures. Our results indicate that in sugarcane individual LTR-RT families have distinct behaviors and can
potentially impact the genome in diverse ways. For instance, these transposable elements may affect nearby genes by generating a diverse set of small RNA’s that trigger gene silencing mechanisms. There is also some evidence
that ancestral genomes contribute significantly different element numbers from particular LTR-RT lineages to the modern sugarcane cultivar genome.
Keywords:LTR Retrotransposons, Sugarcane, Genome, FISH, Epigenetic, Small RNA
Background
Plant genome evolution is closely associated with poly-ploidy and gene amplification, the most highly amplified genes being Long Terminal Repeat retrotransposons (LTR-RTs) [1,2]. LTR-RT proliferation is regulated by the genome at both the transcriptional and post-tran-scriptional level [3]. LTR-RTs, like other Transposable Elements (TEs), can not only affect a genome by
expansion by proliferation, but also by, for example, providing a template for recombination, inserting into coding regions and disrupting gene expression, or affect-ing the transcription of neighboraffect-ing genes (reviewed by [4]).
Based on the massive amounts of genomic sequence data released in the last 15 years, phylogenetic analysis of plant LTR-RTs has identified distinct evolutionary lineages within Gypsy and Copia, the two main plant LTR-RT superfamilies [5]. These lineages are wide-spread in both monocot and eudicot genomes. Uncover-ing of this fine structurUncover-ing within Gypsy and Copia
* Correspondence: mavsluys@usp.br
†Contributed equally
1
GaTE Lab, Depto. de Botânica, Inst. de Biociências, Universidade de São Paulo, Rua do Matão, 277, 05508-090 São Paulo, Brazil
Full list of author information is available at the end of the article
plant LTR-RTs has lead to a better understanding of the diversification of LTR-RTs and shed light on their struc-ture and genomic distribution [6-8].
Sugarcane is an important crop worldwide, being a major source of sugar, and is also increasingly being used for the production of renewable energy sources such as ethanol. Despite its economic importance, the sequencing of the sugarcane genome is at the pilot stage [9]. Modern cultivars are highly polyploid and have one of the largest (10Gb) and most complex crop genomes, and chromosome numbers varying between 100-130 [10].
There are a few reports on transposable elements in sugarcane sequences [11-14] but there is no detailed study on sugarcane LTR-RTs, their phylogenetic classifi-cation, and potential impact on genomic distribution and transcriptional activity. In addition, the importance of accurate and complete TE annotation is increasingly recognized as a priority in plant genome sequencing projects to minimize the inaccuracy of gene annotation and facilitate functional gene studies [15].
To set the basis for future genome interpretation, LTR-RTs in the sugarcane genome were characterized using available public resources and BAC sequences from the BIOEN project [16]. We examined the struc-ture, genomic distribution, phylogenetic diversity, tran-scriptional activity and regulation of sugarcane LTR-RTs. This study reveals that within well-defined phylo-genetic lineages, that while TEs within LTR-RTs families are structurally similar, they have distinct transcriptional and regulatory signatures. Taken together, these results support the growing evidence that LTR-RTs contribute to genomic diversity, but with a wide range of potential outcomes.
Results
Characterization of LTR retrotransposons in sugarcane: phylogeny and structural features
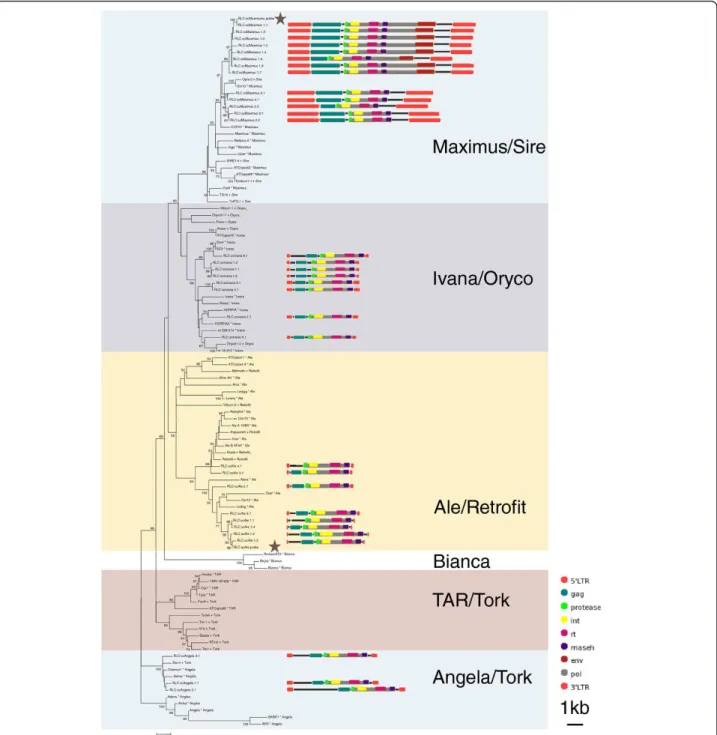
Plant LTR-RT evolutionary lineage names are not used consistently within the literature [6-8], we therefore chose to include sequences from more than one source, so that we could directly compare our results with pub-lished data. Our inferred evolutionary histories suggest that, at least for the sequences we analyzed within Gypsy superfamily, the DEL lineage is equivalent to Tekay, and within the Copiasuperfamily, theMaximus lineage is equivalent to Sire,AletoRetrofitand Ivanato Oryco(Figures 1 and 2; Additional file 1). The relation-ship between theTAR,Angela,Torkand Biancalineages is more problematic. While the Bianca lineage is not included in the GyDb [8]Torkappears to be theAngela andTARlineages combined (Figure 2; Additional file 1: Figure S2).
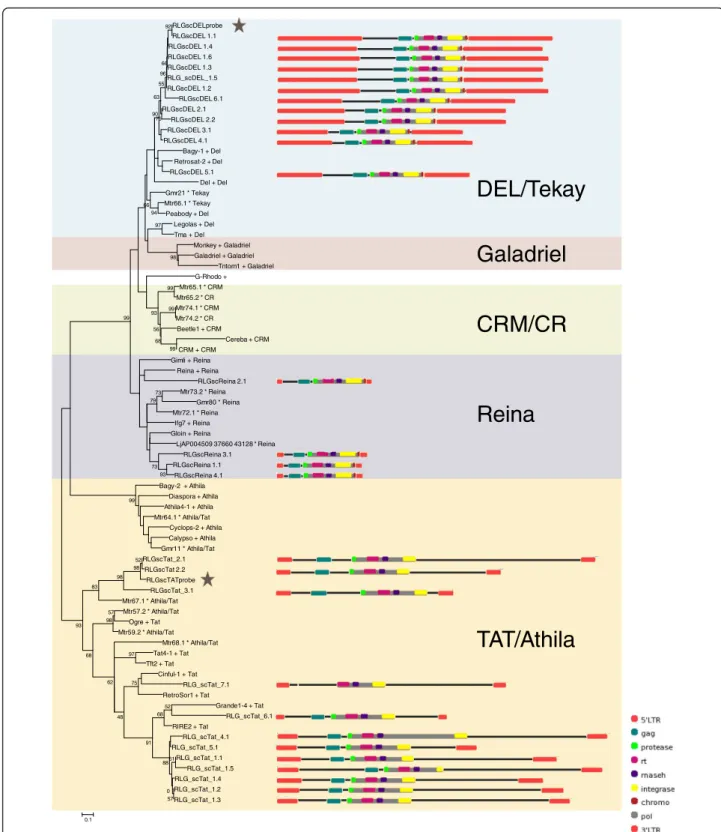
Of the sixty full-length sequences extracted from sugarcane BAC sequences, thirty-two sequences were assigned to theCopia superfamily and twenty-eight to the Gypsysuperfamily (Table 1; Figures 1 and 2). We identified four of the six major plant evolutionaryCopia lineages described by Wicker and Keller [6] in the sugarcane genome (Figure 2; Additional file 1: Figure S2), and three of the sixGypsylineages described by Du et al. [7] and the GyDB [8] (Figure 1; Additional file 1: Figure S1). In terms of sequence numbers, theMaximus lineage was the most highly represented within the Copiasuperfamily, and the Del and Tatlineages were equally represented within theGypsy superfamily. Based on sequence identity within the LTRs, the elements were classified into 35 families (Table 1) [5]. In order to simplify reading of the text we have referred to these families as simply ‘Ale1’for example, rather than the by the full name‘RLC_scAle1’.
We were able to identify all the internal coding domains (gag, aspartic protease, reverse transcriptase, integrase and RNAseH) in all the sugarcane sequences, apart from the gag domain in RLG_scTat_7.1(Figure 1). In addition, a putative envelope domain was identified in elements from the Maximus1 family (Figure 2) and a chromodomain in all DEL andReina elements (Figure 1) [8].
There was a general pattern in overall size of elements from lineages in each of the two superfamilies. In both superfamilies, there was one lineage that is very large (MaximusandDel, 10.2-16.7 kb), and at least one line-age that is comparatively smaller (Ivana,Ale andReina, 4.7-5.9 kb) (Figures 1 and 2). Within the Copia super-family, there is a lineage that is an in-between size (Angelaat 6.5-8.5 kb), while within theGypsy superfam-ily, the sequences of the Tat lineage (9.2-17.7 kb) are more comparable in size to those of the DEL lineage (11.3-16.7 kb) (Figures 1 and 2). Differences in total length were chiefly due to differences in LTR size, and the presence and size of spacer regions between the internal coding domain and the LTRs, rather than inser-tions within the gag/pol coding regions (Figures 1 and 2). The exception is the Tat elements, which contain insertions within the pol region, but in most cases between actual coding domains (Figure 1).
RLGscDELprobe RLGscDEL 1.1 RLGscDEL 1.4 RLGscDEL 1.6 RLGscDEL 1.3 RLG_scDEL_1.5 RLGscDEL 1.2 RLGscDEL 6.1 RLGscDEL 2.1 RLGscDEL 2.2 RLGscDEL 3.1 RLGscDEL 4.1
Bagy-1 + Del Retrosat-2 + Del RLGscDEL 5.1
Del + Del Gmr21 * Tekay Mtr66.1 * Tekay Peabody + Del Legolas + Del Tma + Del
Monkey + Galadriel Galadriel + Galadriel
Tntom1 + Galadriel G-Rhodo + Mtr65.1 * CRM Mtr65.2 * CR Mtr74.1 * CRM Mtr74.2 * CR Beetle1 + CRM
Cereba + CRM CRM + CRM
Gimli + Reina Reina + Reina
RLGscReina 2.1 Mtr73.2 * Reina
Gmr80 * Reina Mtr72.1 * Reina
Ifg7 + Reina Gloin + Reina
LjAP004509 37660 43128 * Reina RLGscReina 3.1 RLGscReina 1.1 RLGscReina 4.1 Bagy-2 + Athila
Diaspora + Athila Athila4-1 + Athila Mtr64.1 * Athila/Tat
Cyclops-2 + Athila Calypso + Athila Gmr11 * Athila/Tat RLGscTat_2.1
RLGscTat 2.2 RLGscTATprobe
RLGscTat_3.1 Mtr67.1 * Athila/Tat Mtr57.2 * Athila/Tat
Ogre + Tat Mtr59.2 * Athila/Tat
Mtr68.1 * Athila/Tat Tat4-1 + Tat Tft2 + Tat
Cinful-1 + Tat RLG_scTat_7.1 RetroSor1 + Tat
Grande1-4 + Tat RLG_scTat_6.1 RIRE2 + Tat
RLG_scTat_4.1 RLG_scTat_5.1 RLG_scTat_1.1 RLG_scTat_1.5 RLG_scTat_1.4 RLG_scTat_1.2 RLG_scTat_1.3 99 99 99 99 57 98 52 98 98 97 61 57 0 88 52 68 91 83 75 48 62 68 93 97 92 66 96 94 93 68 56 93 75 55 63 90 73 79 73 66 99 98 0.1
DEL/Tekay
Reina
TAT/Athila
CRM/CR
Galadriel
Figure 1Neighbour-joining (NJ) phylogenies ofCopiaandGypsyfamilies. NJ phylogeny ofGypsyfamilies based on reverse transcriptase, with schematic representations of sugarcane elements. Sequences from the Gypsy database [8] are denoted with a plus symbol, those from Du et al. [7] with a star. Robustness of the nodes was estimated by 500 bootstrap replications. Bootstrap values below 50% are not shown. Lineages
are indicated by names and colored blocks. A star indicates the sequences used as probes for fluorescentin situhybridization (Figure 3).
Schematic representations were created using domain draw [17]. A scale and a key for the domains represented in the schematic
The distribution of theDelprobe was compared on the same 10 metaphases visualized with anti-digoxigenin-rhodamine (Red) or with NeutrAvidin-Oregon Green-488 (Green) (Additional file 2). The distribution of the
probe signal was similar in all 10 metaphases, and there-fore the signal was considered to be valid. Similarin situ hybridization conditions were used for all subsequent experiments. A BAC clone (SCHRBa_239_N21), Figure 2Neighbour-joining (NJ) phylogenies ofCopiaandGypsyfamilies. NJ phylogeny ofCopiafamilies based on reverse transcriptase, with schematic representations of sugarcane sequences. Sequences from the Gypsy database [8] are denoted with a plus symbol, those from Wicker and Keller [6] with a star. Robustness of the nodes was estimated by 500 bootstrap replications. Bootstrap values below 50% are not
shown. Lineages are indicated by names and colored blocks. A star indicates the sequences used as probes for fluorescentin situhybridization
identified by our group [16], contains known sugarcane centromeric repeats [18,19]. This BAC clone hybridized to the middle region of the chromosome, which consists mainly of centromeric specific sequences (Figure 3b). Seven LTR-RT probes were used, three of which are from Gypsysuperfamily members and four fromCopia superfamily members, representing all the major lineages already described. No convincing signal was obtained for the Reina1, Ivana1 and Angela1 probes,
using the same conditions that were used for the other LTR-RT probes.
The probe from one of the two Gypsylineages, Del1, localized almost exclusively in a broad band around the centromeres. This observation suggests that it is a het-erochromatic or pericentromeric specific element (Fig-ure 3e). The second Gypsy element examined, Tat2, displays a generally strong broad dispersed pattern, but with some concentration along some chromosome arms (data not shown).
Two Copia probes were found dispersed along the chromosome arms and none localized exclusively at or near the centre of the chromosomes. The Ale1 lineage probe was found in high concentrations along particular chromosome arms (Figure 3c). Signals from the Maxi-muslineage probe were generally dispersed (Figure 3d).
Transcriptional activity of sugarcane LTR retrotransposons We associated 84 ESTs from the sugarcane cultivar SP80-3280 related to full-length LTR retrotransposons. The largest number of transcripts was identified from the root libraries (Figure 4b), followed by the internode, lateral bud and calli libraries.
TheCopiasuperfamily was more highly represented in the EST database than the Gypsy superfamily, with 51 and 33 sequences, respectively (Figure 4a). Previously described full length cDNA sequences [20] were assigned to 8 of the 35 families we identified from BAC sequences (Additional file 3). In this study, no ESTs were identified for 14 families (Figure 4a). We assigned ESTs to another 14 families not previously described as transcriptionally active [11,20] (Figure 4a), however for
Table 1 General features of sugarcane LTR-RT lineages Superfamily/Lineage Size (kb) LTR (bp) Families Sequences
Copia
Ale 4.7-5.9 116-238 5 8
Angela 6.5-8.5 434-461 3 3
Ivana 5-5.9 238-454 6 8
Maximus 10.2-13.6 1607-2004 4 13
Total Copia 18 32
Gypsy
DEL 11.3-16.7 2762-5139 6 12
Reina 5.1-5.7 315-416 4 4
TAT 9.2-17.7 458-1345 7 12
Total Gypsy 17 28
Overall Total 35 60
Figure 3Fluorescentin situhybridization patterns observed for sugarcane LTR-RTs. A pair of representative chromosomes is shown underneath the metaphase spreads. Chromosomes are stained with DAPI, probes were labelled with Digoxigenin (DIG) and detected with Anti-DIG-Rhodomine (red signal) or with Biotin and
detected with NeutrAvidin-Oregon Green (green signal)(a)DAPI
counterstaining only.(b)BAC SCHRBa_239_N21 which contains
known sugarcane centromeric repeats(c)scAle probe (euchromatic
pattern).(d)scMaximus probe (dispersed pattern)(e)scDELprobe
(centromeric/pericentromeric pattern). The LTR-RT probes were 1.9-2.9 kb and included the reverse transcriptase domain.
Figure 4Transcriptional activity of sugarcane LTR-RTs. ESTs from the cultivar SP80-3280 available from NCBI were assigned to an LTR-RT family, using the criteria described by Wicker et al. (2007)
[5].(a)Total normalized number of ESTs assigned to each LTR-RT
one family,Ale3, for which a previously described cDNA sequence was assigned, no ESTs were identified.
RT-PCR analysis confirmed the transcriptional activity of sugarcane LTR-RTs in leaves and lateral buds. We also experimentally confirmed transcriptional activity for five new families:Ale2,Ivana6,Del2, Reina1and Reina3. The most represented family in the EST data, Ale1, had an intense band, confirming its transcriptional activ-ity, and had the same intensity of signal in both leaves and lateral buds. Transcriptional patterns differed between tissues and LTR-RT families (Figure 5a). The Ivana and Reina lineages illustrate that individual families have distinct transcriptional patterns: for instance, the Ivana6signal is more intense than that of Ivana1; moreover, Ivana1 has higher transcriptional activity in lateral buds, while Ivana6is more active in leaves. Reina1 andReina3 are both transcriptionally active in lateral buds, but clear differences in band intensity can be observed (Figure 5a).
Distribution of small RNAs among LTR retrotransposon lineages
We divided the sRNA population into two major classes: 20-22nt and 23-25nt sRNA sequences. We refer here-after to these classes as 21-nt class (20-22nt) and 24-nt class (23-25nt). In this analysis we allowed a 0-2 nt mis-match between the sRNA and LTR-RT reference sequences, in which 25% and 22% of the 21 and 24 ntRNAs class, respectively, showed a perfect match with the LTR-RTs sequences. All identified lineages had at least one family with sRNA from both classes mapped to LTR-RTs. In the Copia superfamily, all families within the Maximus lineage had more than 8000 sRNAs mapped, mostly belonging to the 24-nt class (Additional file 4: Figure S5 and Additional file 5). These elements had the highest sRNA counts, about 1.5 to 5.5 fold higher than other lineages and these counts mapped chiefly to the LTRs (Additional file 4: Figure S5). Del1 is the only representative of the Gypsy superfamily that has comparable sRNA counts. The Ivana and Reina lineages were the lineages with the least number of sRNA counts (Additional file 5). Within the Ivana line-age, the element RLC_scIvana6.1 had the highest num-ber of sRNA matches, most of which belong to the 21-nt class (Additional file 5). The same pattern was observed in RLG_Reina3.1. The remaining Ivana and Reina families had lower sRNA counts.
To evaluate whether sRNAs preferentially matched specific regions of each LTR-RT, we compared the sRNA distribution within LTRs and coding domains (Additional file 4: Figure S1-S7). Various distribution patterns, both within the LTRs and the coding domains were observed. Families of the Maximus lineage and Del1 had the high 24-nt sRNA counts within the LTRs.
The 5’region of both LTRs from Del2 and Del3 families had a peak of 21-nt sRNAs. Most LTR-RT families did not have high sRNA counts within the coding domains, but some cases of high counts of sRNAs were noted. The Ale1 family had > 1000 counts of the 24-nt class sRNAs within the integrase and protease domains and the Tat2 family had > 6000 counts of the 24-nt class sRNAs within the RnaseH domain (Additional file 4: Figure S4, Figure S3). All other cases of high counts in coding domains are related to 21-nt class sRNAs, as seen in the Ivana6 and Reina3 families, both with around 300 counts. Interestingly, Angela2 had peaks of > 200 24-nt sRNA counts in a 3.5 kb non-coding region between the 5’LTR and the gag domain (Additional file 4: Figure S5).
Discussion
We characterized LTR-RTs in the sugarcane genome using BAC sequences available from the BIOEN project and publicly available genomic and EST resources, which allowed us to provide the most complete over-view of the structural and phylogenetic diversity of these elements to date. The 35 LTR-RT families identified belong to four lineages from theCopiasuperfamily and to three from the Gypsysuperfamily. Among all these families we observed distinct patterns of differences in structural features, chromosomal distribution, transcrip-tional activity, and sRNAs targeting.
Sugarcane LTR-RTs are structurally diverse and belong to evolutionary lineages shared by monocots and eudicots Previous surveys of LTR-RTs in plants defined six major common evolutionaryCopialineages [6] and six major common evolutionaryGypsylineages [8].Biancawas the onlyCopiasuperfamily lineage in which sugarcane LTR-RTs were not found. Absence ofBiancain the sugarcane genome dataset analyzed may be explained by its rela-tively low representation in other plants. Indeed, rice has fewBiancafamilies [6] and soybean has none [7].
We also did not find sugarcane LTR-RTs elements from the Galadrieland CRM lineages in Gypsy super-family. The Galadriel lineage seems to be an under-represented lineage among monocots, since there are only reports ofGaladriel elements in banana [21].CRM elements are also minor components ofGypsy retrotran-sposons in the model grass rice [7], which may explain its low representation in sugarcane.
Ale1 (30)
Ale2 (32)
Ivana1 (32)
Ivana6 (34)
Del1 (32)
Del2 (32)
Reina1 (34)
Reina3 (34)
25S (21)
RT-
a. b.
1000
600
1 2 3 4 5
200 0 0
21nt 24nt
length (kb)
sRNA
hits
6 0 1 2 3 4 5
scAle_2.1
1 2 3 4 5
0
1 2 3 5 4
0 6 7 8 9 10 11 12 13 14 15 16 17
scDel_1.1
1 2 3 5 4
0 6 7 8 9 10 11 12 13 14
scDel_2.1
organ/tissue Leaf Lateral PCR- blade bud
0 1 2 3 4 5
scIvana_1.1
1 2 3 4 5
0 6
scIvana_6.1
1 2 3 4 5
0
scReina_1.1
1 2 4 3 5
0
scReina_3.1 scAle_1.2
Figure 5Mapping of small RNAs in confirmed transcriptionally active LTR-RTs families.(a)Sugarcane TEs are transcriptionally active in leaf
and bud tissues. Expression profiles of selected TEs in leaf blade and developing lateral buds of the sugarcane hybrid SP80-3280. Ribosomal25S
gene (Sc25S) was used as a loading control. RT- (reaction without RT) and PCR- (reaction without cDNA) are shown as negative controls.
Numbers in parentheses represent PCR cycles for each amplicon.(b). Mapping of sRNA within 8 LTR-RT families. 20-22nt sRNAs are represented
Sugarcane LTR-RT families have distinct chromosomal distributions
Transposable elements are not distributed randomly along eukaryotic chromosomes [24]. In particular, Gypsy elements tend to be found in heterochromatic regions, Copia elements are more dispersed throughout the gen-ome [25,26]. In addition, heterochromatic and pericen-tromeric regions are enriched in TEs, such as those of theCR/CRMand Tatlineages, compared with euchro-matic regions [27-29]. Using fluorescence in situ hybri-dization (FISH), we examined the distribution of representatives from seven lineages identified within the Gypsy and Copia superfamilies in sugarcane chromo-somes. No detectable FISH signal was obtained for the Angela,Ivana andReinalineages; in the case of Ivana preliminary estimates from the R570 BAC library sug-gests that there is approximately 50 copies ofIvana1 per haploid genome in sugarcane (data not shown), which suggests that the lack of signal is due to low copy number. We suspect that this observation may be also valid forAngelaandReina.
The two Copia probes, Ale1and Maximus1, had the expected euchromatic patterns, but they were distinctly different. The signals from the Aleprobe had localized clusters along particular chromosome arms, while those of the Maximus1probe were widespread and dispersed, without any signs of concentration in particularly regions (Figure 3d). It has been suggested that as TEs accumulate in a genome, even if they insert randomly, they are more likely to insert within other TEs, forming clusters of TEs. Because these clusters of TEs are most likely selectively neutral, they will be free to expand [24]. TheAledistribution pattern observed in sugarcane is reminiscent of such clusters of TEs.
The sugarcane BAC SCHRBa 239_N21 used as a cen-tromeric-specific probe in this study contains the SCEN repeat interspersed with LTR-RTs from theTatlineage [16]. Previous studies in sugarcane [18,19] identified a centromere-specific repeat (SCEN) and centromere associated LTR-RTs, classified asCR/CRM-like. We did not identify any full length LTR-RTs from the CR/CRM lineage in this study, but sequence from a relatedGypsy lineage, Del1, did hybridize to a broad region around and within the centromeric region (Figure 3b and 3e). Del lineage sequences have been identified at other plant centromeres [28], however our results suggest that the Delsequence we used as a probe is not strictly cen-tromeric specific, but is rather preferentially found in and around heterochromatic regions of the centromeric repeats. The Tat sequences identified in the BAC SCHRBa 239_N21 clustered with the Tat1, Tat4, Tat5 andTat6families, (data not shown) which is quite dis-tinct from the Tat2 family (Figure 1). The Tat FISH probe used is most closely related to the Tat2sequences
(Figure 1) and had a clusters of localization along some chromosomes, like those seen with theAle1 probe, but with much more intense signals.
Modern sugarcane cultivars are interspecific hybrids betweenSaccharum officinarumandS. spontaneumand backcrossed withS. officinarum [30]. The resulting gen-omes are highly polyploid, 70-80% of which is from S. officinarum, 10-23% fromS. spontaneum, the rest being recombinants [10,31]. The derivation of the modern sugarcane genome suggests that, rather than being the result of TEs inserting into clusters of TEs, the distribu-tion ofTat2 andAle1 may be the result of differential transmission of TEs from the parental genomes. Future work using genomic in situ hybridization [31] combined with FISH should enable us to distinguish between these two hypotheses.
Transcriptional activity of LTR-RTs and their associated sRNAs
Transposable elements make up a substantial proportion of plant genomes, and are often transcriptionally active. A very stringent search for sugarcane ESTs associated with TEs confirmed that transcriptional activity appears to be a general feature of some sugarcane LTR-RTs, as reported for other monocots [32,33]. Since we do not have detailed information about cDNA library prepara-tion of EST data, we cannot identify if transcribed sequences were in sense or antisense orientation. Inter-estingly, within each lineage, the number of transcripts mapped to each family was variable (Figure 4a). The most striking example is theAle lineage, which has the highest number of transcripts, all of which mapped to a single family,Ale1. There is a similar, but not as defini-tive pattern in all other lineages, except for Maximus, where all families have similar numbers of transcripts.
In terms of tissue specificity (Figure 4b), the highest number of LTR-RT associated transcripts was identified from the root libraries, followed by the internode, lateral bud and calli libraries. A previous macroarray analysis identified calli as the tissue with the highest number of TEs being expressed in sugarcane [20], however in this study only calli, apical meristem, leaf roll and flower were analyzed. These differences in expression according to tissue, in particular that leaf is the tissue with least number of ESTs identified, may help guide future stu-dies of transposable elements in sugarcane.
Two main classes of siRNAs are generated, the 21-nt class regulates post-transcriptionally related mRNAs while the 24-nt class is involved in RNA-dependent DNA methylation (RdDM) and heterochromatin mainte-nance and therefore suppresses gene expression at tran-scriptional level [34].
Previous studies mapping sRNAs to LTR-RTs in wheat and maize genomes [35,36], presented an overall study of TE superfamilies and described a pattern of concentration of 24nt sRNA in the LTRs. Our work, which focused on mapping to individual LTR-RT ele-ments, identified distinct patterns of sRNA targeting within sugarcane LTR-RT lineages and families.
The previously described ‘24nt LTR’ pattern was observed for all references sequences in the Maximus families, and for Del1andTat3 (Additional file 5). For all other reference sequences a different type of pattern was observed. For almost half of the families (18 out of 33) very few sRNAs(< 2000 counts) were mapped to the reference copy (Additional file 5). Two other patterns were observed, one in which high numbers of 21nt sRNAs mapped along the coding region, represented by Ivana6 andReina3 (Additional file 5), and one in which a very large number of 24nt sRNAs mapped within the coding region, seen only inAle1.
Very few mapped sRNAs indicates that elements from those families either are not transcriptionally active, or they are very recently activate and have not yet triggered the host small RNA-dependent silencing machinery. If they are not transcriptionally active, silencing may be being maintained by ancient methylation. A previous study has shown that ~63% of methylated regions were maintained without persistent targeting by sRNAs [37], explaining the absence of both 21 and 24nt sRNAs.
The high numbers of 21nt sRNAs mapped to the cod-ing region of some families suggests that they are becod-ing regulated primarily post-transcriptionally. This has been previously reported for MITEs [36] and may indicate recent activation of transcription, pior to triggering of the RdDM machinery.
The unique pattern observed in theAle1 family sug-gests that the RdDM machinery is guiding methylation to the coding region of the element, not the promoter region. The “body-methylated gene” concept was first described in plants in 2006, when Zhang and collabora-tors showed that over one third of Arabidopsis expressed genes were methylated in the coding region, but not in the promoter region [37]. The Ale1family has a distinct profile, it has a‘body-gene’-like sRNA pat-tern, it is the most transcriptionally active LTR-RT in sugarcane and is concentrated in euchromatic regions and gene-rich BAC sequences ([12] and Figure 3c). At this point it is difficult to make conclusions from these
observations, however these results are intriguing and warrant further investigation.
Conclusions
This is the first study to perform a concomitant survey of phylogenetic diversity, chromosomal distribution, structure, transcriptional activity and interaction with sRNAs of LTR-RTs in a plant genome. We assigned 60 LTR-RT elements to 35 families within four Copiaand three Gypsylineages. Two lineages, one Copiaand one Gypsylineage, showed distinct patterns of signal cluster-ing along some chromosomes in the FISH analysis. Given that the modern sugarcane cultivars are hybrids with highly unequal contributions from the ancestral genomes, the FISH patterns suggest that for these lineages there has been higher numbers of elements from one ancestral genome than the other. For the tran-scriptional and sRNA mapping analyses we chose to analyze at the family level. Individual families had dis-tinct transcript and sRNA mapping profiles, suggesting that they are differentially expressed and regulated. The Ale1 family was particularly unusual in that it had ‘body-gene’-like sRNA pattern, it is the most transcrip-tonally active LTR-RT in sugarcane and is concentrated in euchromatic regions. Overall, our results indicate that LTR-RTs could impact the genome in different ways at the family levels.
Methods
Identification and retrieval of sugarcane LTR retrotransposon sequences
All BACs used are from the R570 sugarcane cultivar library [38]. BACs sequenced for the BIOEN Project [16] and public sugarcane BAC sequences available at the National Center for Biotechnology Information (NCBI) website as at 01/02/2011 were screened for full-length LTR elements using LTR_STRUC [39] with the most thorough stringency (1). Sixty sequences were retrieved and provisionally assigned to the Gypsy or Copia superfamily by submission against cores in the Gypsy Database (GyDB) [8] using BLASTX. To deter-mine whether the sequences were complete elements, we identified target site duplications (TSDs) by submit-ting the full length sequences as a query and subject to a blast2seq [40] on the NCBI website.
Phylogenetic analysis
For both phylogenies we downloaded RT alignments from the Gypsy database (GyDB) [8], and removed non-plant sequences.Gypsysequences were also taken from Du et al. (2010) [7],Copia sequences were taken from Wicker and Keller (2007) [6]. All sequences were renamed to reflect published lineage names. Sequences were aligned using MUSCLE with default settings [41] and manually adjusted by eye. The optimal model of amino acid substitution was estimated using MEGA5 [42] with default settings. Neighbor-joining and maxi-mum-likelihood phylogenies were estimated with MEGA5 [42] using the highest-ranked substitution model available and a bootstrap of 500 replicates.
Assignment to Families within Lineages and naming of sequences
Sugarcane LTR-RTs were assigned to families within lineages on the basis of 80% sequence identity in at least 80% of their LTRs [5]. Although previous reports assign names to some sugarcane LTR-RT families [11,14,20], we opted to standardize the name of sugarcane LTR-RT sequences, using a more straightforward strategy, based in the proposed universal classification of TEs by Wicker et al. (2007) [5]. Sequences were named ‘RLC’ (Copia) or‘RLG’(Gypsy),‘sc’for‘sugarcane’, the lineage name e.g. ‘Ale’, the family number e.g. ‘1’, then each sequence within a family was numbered sequentially. For example‘RLC_scAle_1.1’is the first sequence named within theAlelineage, family 1, superfamilyCopia.
Analysis of the structure of Sugarcane LTR-RTs
Coding domains were identified using Pfam, or by align-ment with MUSCLE [41] against the domain alignalign-ment from the GyDb [8]. Full-length sequences were aligned and analyzed using BioEdit [43], using the toggle trans-late option so that we could align the coding domains as well as the LTRs, TSDs, and the regions between the LTRs and the coding domains. LTRs were identified by submitting the sequence of the entire sugarcane LTR-RT as both a query and subject to a MEGABLAST [40] analysis. The beginning of the LTRs, regions between the LTRs and the coding domains, and the TSDs were manually aligned in BioEdit [43]. Co-ordinates of the beginning of all features of each element were recorded in an Excel table and the information submitted to domain draw [17] to create a schematic representation of each sugarcane LTR-RT.
General features of each sequence, as element size, LTR size, Target Side Duplications (TSD) and GenBank accession numbers are presented in Additional file 6.
Sugarcane EST database screening
All full-length LTR-RTs were used as queries in a BLASTN search against EST sequences from the
sugarcane cultivar SP80-3280. The ESTs were obtained using ENTREZ at NCBI http://www.ncbi.nlm.nih.gov/ Entrez/. A total of 155,354 sugarcane ESTs were ana-lyzed, all of them from the SUCEST (Sugarcane EST) project [44].
ESTs similar to LTR-RTs were assigned to a family according to the criteria based on Wicker et al. [5]: 80% coverage with 80% nucleotide identity.
The number of hits for each library was normalized by dividing the raw number of hits by the total number of valid reads. The normalized numbers of hits per library were then combined according to tissue type. The final number was multiplied by 100,000, so that in Figure 4 the X axis represents the number of ESTs per 100,000 transcripts from each tissue.
Association of cDNAs to full-length LTR-RTs
Thirty manually curated sugarcane cDNAs related to LTR-RTs [20], described using an older nomenclature, were assigned to a family according to the same criteria used for the ESTs.
RNA extraction and Reverse Transcriptase (RT) PCR Analysis
Leaf blade tissues were collected from one-month-old sugarcane plants (cultivar SP 80-3280) grown under greenhouse conditions. Mature eight-month-old plants of the same cultivar were used to obtain lateral buds. Stalk pieces with one bud (single eye sets) were planted in plastic trays containing a commercial planting mix (Plantmax, Eucatex, Brazil). After five days, developing buds were collected for RNA extraction. Two indepen-dent biological replicates were collected for leaf blade and lateral bud tissues. Total RNA was extracted using TRizol reagent (Invitrogen) according to the manufac-turer’s instructions.
Primers were designed within the reverse transcriptase domain using Primer3Plus [45] to amplify all known ele-ments from a family. Total RNA was treated with DNAse I Amp Grade (Invitrogen) to remove any resi-dual genomic DNA. Three micrograms of DNAse-trea-ted RNA was used to generate the first strand cDNA using ImProm II Reverse Transcriptase (Promega) according to the manufacturer’s instructions. The reac-tion mixture was placed in a GeneAmp9700 thermocy-cler (Applied Biosystems) and incubated at 16°C for 30 minutes, followed by 60 cycles of pulsed reverse tran-scription at 30°C for 30 seconds, 42°C for 30 seconds, and 50°C for one second. cDNA dilutions were used in PCR reactions as following: 1.0 μL of cDNA, 10 pmol of
each primer, GoTaqmastermix, and 1 U of GoTaq DNA Polymerase (Promega) in a total volume of 25 μL. The
appropriate cycle numbers of 94°C for 30 seconds, 55°C or 60°C for 30 seconds, and 72°C for 45 seconds. All reactions were repeated at least twice.
Small RNA library construction and bioinformatic analysis To evaluate the small RNA “landscape” of sugarcane LTR-RTs, we prepared a sRNA library from leaves of one-month old SP80-3280 sugarcane cultivar plants, grown under greenhouse conditions. Ten micrograms of total RNA, prepared using TRizol reagent (Invitrogen) according to the manufacturer’s instructions, were used to generate sRNA library following Illumina’s modified protocol. The sRNA fraction of 19-28 nt was purified by size fractionation on a 15% TBE-Urea polyacrylamide gel. A 5’-adenylated single-stranded adapter was first ligated to the 3’-end of the RNA using T4 RNA ligase without ATP, followed by a second single-stranded adapter ligation at the 5’-end of the RNA using T4 RNA ligase in the presence of ATP. The resulting products were fractioned on a 10% TBE-Urea polyacrylamide gel and then used for cDNA synthesis and PCR amplifica-tion. The resulting library was sequenced on an Illumina Genome Analyzer (GA-IIx) following the manufacturer’s protocol available at http://www.fasteris.com.
A total of 4,388,665 20-25nt raw sequences were retrieved in a FASTQ formatted file and the adapter sequences were removed using Perl Scripts. After trim-ming of adapter sequences, the inserts were sorted into separate files according to their lengths. We used the program MAQ [46] to map 20-25 ntsRNA reads against sugarcane LTR-RT reference sequences (sequence 1 from each family). MAQ is a program that rapidly aligns short reads to reference genome sequences, and in this study we allowed 0-2 nt mismatches between the sRNA and LTR-RTs sequences. Three percent of the total library, that is, 131,641 high quality raw 20-25nt sequences matched against the sugarcane LTR-RT sequences. These sRNAs sequences have been submitted to the NCBI Gene Expression Omnibus database http:// www.ncbi.nlm.nih.gov/geo under accession number GSE35143.
Fluorescence in situ hybridization (FISH)
The distribution of the sugarcane LTR-RTs was ana-lyzed by fluorescence in situ hybridization (FISH) on metaphase chromosomes. In order to compare the dis-tribution of the LTR-RT relative to the centromere, a centromeric BAC [16] was also used as a probe. A single representative probe was used for each evolutionary lineage (Figure 3). The sequence of each probe was sub-mitted as a query to a BLASTN analysis against a data-base of sugarcane cDNAs related to TEs identified in our lab [11,20] to check that, at 85% stringency, it would not hybridize against other elements.
All LTR-RT probes were 1.9 to 2.9 kb and covered the reverse transcriptase domain. For theAle1 andIvana1 families, probes were selected from previously reported cDNA sequences [11,20]. For Ale1, we used cDNA TE137 (GenBank accession [GenBank:JN786875]) and TE049 for scIvana1 (GenBank accession [GenBank: DQ115032]) on the basis of size (> 1.9 kb) and the pre-sence of the reverse transcriptase domain. For all other lineages primers were designed from alignments of the RT domain using Primer3Plus [45]. All kits were used according to the manufacturer’s instructions. The probe sequences were PCR amplified from R570 cultivar geno-mic DNA using Elongase (Invitrogen) or GoTaq (Pro-mega) with 2 mM MgCl2, 0.2 mMdNTPs, 0.2 μM
primers, 1 ng/μL genomic DNA and 0.025units/uL of
Enzyme. Cycling conditions were as described in the Expand Long Template PCR System (Roche). The resulting amplicons were separated on 1% agarose, gel-purified using the NucleoSpin Extract II kit (Macherey Nagel), ligated into the pGEM T-Easy Vector (Promega), and cloned into DH10B electrocompetent cells accord-ing to standard procedures [47]. Minipreps from three clones from each PCR reaction and from the cDNA clones were prepared using standard alkaline precipita-tion methods [47], and sequenced using the vector pri-mers M13F/R. In order to obtain a probe that consisted of just the probe, one miniprep for each lineage was diluted 1:1000 and used as template in 100 μL PCR
reaction with M13F/R primers to amplify the insert only, using GoTaq (Promega) in same reaction condi-tions as above, but with the following cycling condicondi-tions, initial denaturation 95°C 3 min, 35cycles of 95°C 1 min, 55°C 30 sec, 72°C 2 min, followed by a final extension of 72°C for 3 min. The resulting amplicons were sepa-rated on 1% agarose, gel purified using the NucleoSpin Extract II kit (Macherey Nagel) and quantified using a NanoDrop Spectrometer (ThermoScientific). For the centromeric BAC probe, BAC DNA was extracted using the Large-Construct Kit (Qiagen).
Between 350-700 ng of probe DNA was used in a 20
μL nick translation reaction with Digoxigenin
(DIG)-11-dUTP (Invitrogen) or Biotin-16-(DIG)-11-dUTP (Invitrogen) and the NT mix (Roche). Labeling efficiency was tested according to Heslop (2000) [48] (protocol 4.7). The probe was only used if the 1:1000 dilution was clearly visible.
0.2% macerozyme/20% pectinase or 1% cellulase/0.2% macerozyme for 2 1/2 to 3 hours (depending on how large the root tip was) at 37°C.
Hybridization and detection was performed accord-ing to Heslop (2000) [48] usaccord-ing protocols 8.1, 8.4, 9.1 and 9.2, with the following conditions: the slide was dried for 30 min at 50-60°C and pretreated with both RNAse A and pepsin (20 min at 37°C); 1 μL of each
labeled probe was added to a 20μL hybridization mix
of 50% formamide/2xSSC/10% dextran sulphate/1% SDS; the slide was denatured in 50 mL of 70% forma-mide/2xSSC at 70°C for 2 min and then dehydrated through an ice-cold ethanol series (70%, 85%, 100% ethanol); washes were 80-82% stringent, 20% forma-mide with 0.1 or 0.2 xSSC at 42°C; DIG-labeled probes were detected with anti-digoxigenin-rhodamine (Roche), biotin-labeled with NeutrAvidin-Oregon Green-488 (Molecular Probes).
The slide was stained with DAPI, observed and photo-graphed with an Zeiss AxioPlan2 microscope and cap-tured using an Axiocam MR camera and the Isis Fluorescence Imaging System (MetaSystems). Nine to 25 metaphases were photographed for each probe. Slides were stripped by carefully removing the immersion oil, soaked in 4xSSC/0.1% Tween 20 at 37°C until the cover-slip floated off, transferred to fresh 4xSSC/0.1% Tween 20 for 3 hours with gentle shaking, transferred to 3:1 ethanol:acetic acid fixative for 30 min and then dehy-drated through an ethanol series (70%, 85%, 100% etha-nol) for 5 min each at room temperature and air dried for 1 hour.
Additional material
Additional file 1:GypsyandCopiaMaximum Likelihood
phylogenies. Maximum-likelihood phylogeny ofGypsyfamilies (Figure 1) based on reverse transcriptase. Sequences from the Gypsy database [8] are denoted with a plus symbol, those from Du et al. [7] with a star.
Maximum-likelihood phylogeny ofCopiafamilies (Figure 2) based on
reverse transcriptase. Sequences from the Gypsy database [8] are denoted with a plus symbol, those from Wicker and Keller [6] with a star. Robustness of the nodes was estimated by 500 bootstrap replications. Bootstrap values below 50 are not shown.
Additional file 2: Fluorescence in situ hybridization with the DEL probe. Figure of fluorescencein situhybridization using theDelprobe, prepared and labelled twice, once with Digoxigenin (DIG) and detected with Anti-DIG-Rhodomine (red signal) and once with Biotin and detected with NeutrAvidin-Oregon Green(green signal). The probes were hybridized to the same slide in consecutive FISH experiments under the same conditions. The same pattern was observed for both probes, suggesting that the signal was real, and the same FISH conditions was used for all LTR-RT probe.
Additional file 3: Assignment of previously described cDNA sequences to LTR-RT families. Thirty manually curated sugarcane cDNAs related to LTR-RTs [20] were assigned to a family according Wicker et al. [5]: 80% coverage with 80% nucleotide identity.
Additional file 4: sRNA mapping to individual LTR-RT elements. Mapping of sRNAs within each LTR-RT family (Figures 1 to 7). 20-22nt sRNAs are represented as blue lines, 23-25ntsRNAs as red lines. Each
figure shows a different lineage, and includes all the families of that lineage. A scaled schematic (also shown in Figures 1 and 2), is shown below each sRNA map.
Additional file 5: Total 20-22nt and 23-25nt sRNA counts for each LTR-RT family. Total 20-22nt (black) and 23-25nt (grey) sRNA counts for each LTR-RT family, with a mismatch of 2nt allowed.
Additional file 6: LTR-RT information. Name assigned in this paper, pre-existing name from [14,20], GenBank accession number, size of full-length element, full-length of 5’and 3’LTRs, and sequence of 5 and 3’TSDs,
for individual LTR-RT sequences.
Acknowledgements
The authors thank Dr Marguerite Rodier-Goud (CIRAD, Montpellier, France), Dr Angélique D’Hont (CIRAD, Montpellier, France), Dr Reginaldo Carvalho
(Universidade Federal Rural de Pernambuco, Recife, Brazil) and Dr.Ana Christina Brasileiro Vidal (Universidade Federal de Pernambuco, Recife, Brazil) for help with the preparation of metaphases from sugarcane and fluorescence in situ hybridization. We also thank GaTE Lab members Dr Nathalia de Setta, Andréia Prata, Edgar Andres Ochoa-Cruz and Kleber Alves Gomes for their help with sugarcane BAC sequencing under the BIOEN project. This work was partly funded by FAPESP-BIOEN 2008/52074-0 and CNPq grants to MAVS. DSD, GMQC and CJM are supported by fellowships from FAPESP. DSD was also supported by a fellowship from CAPES.
Author details
1GaTE Lab, Depto. de Botânica, Inst. de Biociências, Universidade de São
Paulo, Rua do Matão, 277, 05508-090 São Paulo, Brazil.2Depto. de Genética,
Inst. de Biociências, Universidade Estadual Paulista, campus de Botucatu, Distrito de Rubião Jr., s/n, 18618-000 Botucatu, Brazil.3Systems Biology Laboratory, Centro de Biologia Molecular e Engenharia Genética, Universidade Estadual de Campinas, Av. Cândido Rondon, 400, 13083-875 Campinas, Brazil.4Plant Biotechnology Laboratory, Instituto Agronômico do
Paraná, Rod. Celso Garcia Cid (PR-445), km375, 86047-902 Londrina, Brazil.
Authors’contributions
The project was designed by MAVS, DSD and GMQC, and co-ordinated by MAVS. DSD, GMQC and CJM did the bio-informatic analyses. CJM carried out the FISH assays. FTSN and RV made the sRNA library and did the sRNA analyses. CSA did the RT-PCRs. DSD, GMQC, CJM, FTSN, RV and MAVS wrote the manuscript. All authors read and approved the final manuscript.
Competing interests
The authors declare that they have no competing interests
Received: 27 October 2011 Accepted: 16 April 2012 Published: 16 April 2012
References
1. Ainouche ML, Jenczewski E:Focus on polyploidy.New Phytol2010,186:1-4. 2. Parisod C, Alix K, Just J, Petit M, Sarilar V, Mhiri C, Ainouche M, Chalhoub B,
Grandbastien M:Impact of transposable elements on the organization
and function of allopolyploid genomes.New phytol2010,186:37-45. 3. Hirochika H, Okamoto H, Kakutani T:Silencing of retrotransposons in Arabidopsis and reactivation by the ddm1 mutation.Plant cell2000,
12:357-368.
4. Feschotte C, Jiang N, Wessler SR:Plant transposable elements: where
genetics meets genomics.Nature reviews Genetics2002,3:329-341. 5. Wicker T, Sabot F, Hua-Van A, Bennetzen JL, Capy P, Chalhoub B, Flavell A,
Leroy P, Morgante M, Panaud O, Paux E, SanMiguel P, Schulman AH:A
unified classification system for eukaryotic transposable elements.Nat Rev Genet2007,8:973-982.
6. Wicker T, Keller B:Genome-wide comparative analysis of copia
retrotransposons in Triticeae, rice, and Arabidopsis reveals conserved ancient evolutionary lineages and distinct dynamics of individual copia families.Genome Res2007,17:1072-1081.
7. Du J, Tian Z, Hans CS, Laten HM, Cannon SB, Jackson SA, Shoemaker RC,
LTR-retrotransposons in flowering plants: insights from genome-wide analysis and multi-specific comparison.Plant J2010,63:584-598. 8. Llorens C, Futami R, Covelli L, Domínguez-Escribá L, Viu JM, Tamarit D,
Aguilar-Rodríguez J, Vicente-Ripolles M, Fuster G, Bernet GP, Maumus F,
Munoz-Pomer A, Sempere JM, Latorre A, Moya A:The Gypsy Database
(GyDB) of mobile genetic elements: release 2.0.Nucleic Acids Res2011,
39:D70-D74.
9. Souza GM, Berges H, Bocs S, Casu R, D’Hont A, Ferreira JE, Henry R, Ming R,
Potier B, Van Sluys M-A, Vincentz M, Paterson AH:The Sugarcane Genome
Challenge: Strategies for Sequencing a Highly Complex Genome.Tropical Plant Biology2011,4:145-156.
10. Piperidis G, Piperidis N, D’Hont A:Molecular cytogenetic investigation of chromosome composition and transmission in sugarcane.Molecular Genet Genomics2010,284:65-73.
11. Rossi M, Araujo PG, Van Sluys M-A:Survey of transposable elements in sugarcane expressed sequence tags (ESTs).Genet Mol Bio2001,
24:147-154.
12. Jannoo N, Grivet L, Chantret N, Garsmeur O, Glaszmann JC, Arruda P,
D’Hont A:Orthologous comparison in a gene-rich region among grasses
reveals stability in the sugarcane polyploid genome.Plant J2007,
50:574-585.
13. Wang J, Roe B, Macmil S, Yu Q, Murray JE, Tang H, Chen C, Najar F, Wiley G, Bowers J, Van Sluys M-A, Rokhsar DS, Hudson ME, Moose SP, Paterson AH,
Ming R:Microcollinearity between autopolyploid sugarcane and diploid
sorghum genomes.BMC Genomics2010,11:261.
14. Garsmeur O, Charron C, Bocs S, Jouffe V, Samain S, Couloux A, Droc G, Zini C, Glaszmann J-C, Van Sluys M-A, D’Hont A:High homologous gene conservation despite extreme autopolyploid redundancy in sugarcane.
New Phytol2010,189:629-642.
15. Bennetzen JL, Coleman C, Liu R, Ma J, Ramakrishna W:Consistent over-estimation of gene number in complex plant genomes.Current Opin Plant Biol2004,7:732-736.
16. Setta N, Cruz G, Cruz E, Gomes K, Campos R, Hotta C, Vilela M, Vincentz M, Vautrin S, Souza G, Bérgès H, Gaiarsa J, Kitajima J, Van Sluys M:Sugarcane genome: a snapshot from 100 sequenced BACs.Plant and Animal Genomes XIX Conference San Diego2011, USA.
17. Fink J, Hamilton N:DomainDraw: A Macromolecular Schematic Drawing
Program.In Silico Biol2007,7:14.
18. Nagaki K, Tsujimoto H, Sasakuma T:A novel repetitive sequence of sugar cane, SCEN family, locating on centromeric regions.Chromosome Res
1998,6:295-302.
19. Nagaki K, Murata M:Characterization of CENH3 and
centromere-associated DNA sequences in sugarcane.Chromosome research2005,
13:195-203.
20. de Araujo PG, Rossi M, de Jesus EM, Saccaro NL, Kajihara D, Massa R, de Felix JM, Drummond RD, Falco MC, Chabregas SM, Ulian EC, Menossi M, Van Sluys M-A:Transcriptionally active transposable elements in recent hybrid sugarcane.The Plant journal2005,44:707-717.
21. Hribová E, Neumann P, Matsumoto T, Roux N, Macas J, Dolezel J:Repetitive part of the banana (Musa acuminata) genome investigated by low-depth 454 sequencing.BMC Plant Biol2010,10:204.
22. Wang H, Liu J-S:LTR retrotransposon landscape in Medicago truncatula:
more rapid removal than in rice.BMC Genomics2008,9:382. 23. Park M, Jo S, Kwon J-K, Park J, Ahn JH, Kim S, Lee Y-H, Yang T-J, Hur C-G,
Kang B-C, Kim B-D, Choi D:Comparative analysis of pepper and tomato
reveals euchromatin expansion of pepper genome caused by differential accumulation of Ty3/Gypsy-like elements.BMC Genomics
2011,12:85.
24. Hua-Van A, Le Rouzic A, Boutin TS, Filée J, Capy P:The struggle for life of the genome’s selfish architects.Biology Direct2011,6:19.
25. Heslop-Harrison JS, Brandes A, Taketa S, Schmidt T, Vershinin A, Alkhimova EG, Kamm A, Doudrick RL, Schwarzacher T, Katsiotis A, Kubis S, Kumar A, Pearce SR, Flavell A, Harrison GE:The chromosomal distributions of Ty1-copia group retrotransposable elements in higher plants and their implications for genome evolution.Genetica1997,100:197-204. 26. Paterson AH, Bowers JE, Bruggmann R, Dubchak I, Grimwood J,
Gundlach H, Haberer G, Hellsten U, Mitros T, Poliakov A, Schmutz J, Spannagl M, Tang H, Wang X, Wicker T, Bharti AK, Chapman J, Feltus FA, Gowik U, Grigoriev IV, Lyons E, Maher CA, Martis M, Narechania A, Otillar RP, Penning BW, Salamov AA, Wang Y, Zhang L, Carpita NC,et al:The
Sorghum bicolor genome and the diversification of grasses.Nature2009,
457:551-556.
27. Mizuno H, Ito K, Wu J, Tanaka T, Kanamori H, Katayose Y, Sasaki T,
Matsumoto T:Identification and mapping of expressed genes, simple
sequence repeats and transposable elements in centromeric regions of rice chromosomes.DNA Res2006,13:267-274.
28. Theuri J, Phelps-Durr T, Mathews S, Birchler J:A comparative study of retrotransposons in the centromeric regions of A and B chromosomes of maize.Cytogenetic Genome Res2005,110:203-208.
29. Weber B, Schmidt T:Nested Ty3-gypsy retrotransposons of a single Beta
procumbens centromere contain a putative chromodomain.
Chromosome Res2009,17:379-396.
30. Grivet L, Arruda P:Sugarcane genomics: depicting the complex genome
of an important tropical crop.Current Opin Plant Biol2001,5:122-127.
31. D’Hont A:Unraveling the genome structure of polyploids using FISH and
GISH; examples of sugarcane and banana.Cytogenetic Genome Res2005,
109:27-33.
32. Vicient CM:Transcriptional activity of transposable elements in maize.
BMC Genomics2010,11:601.
33. Echenique V, Stamova B, Wolters P, Lazo G, Carollo L, Dubcovsky J:
Frequencies of Ty1- copia and Ty3- gypsy retroelements within the Triticeae EST databases.Theoretical Appl Genet2002,104:840-844. 34. Baulcombe D:RNA silencing in plants.Nature2004,431:356-363. 35. Nobuta K, Lu C, Shrivastava R, Pillay M, De Paoli E, Accerbi M,
Arteaga-Vazquez M, Sidorenko L, Jeong DH, Yen Y, others:Distinct size distribution of endogenous siRNAs in maize: Evidence from deep sequencing in the mop1-1 mutant.Proc Natl Acad Sci USA2008,105:14958-14963. 36. Cantu D, Vanzetti LS, Sumner A, Dubcovsky M, Matvienko M, Distelfeld A,
Michelmore RW, Dubcovsky J:Small RNAs, DNA methylation and
transposable elements in wheat.BMC Genomics2010,11:408. 37. Zhang X, Yazaki J, Sundaresan A, Cokus S, Chan SW-L, Chen H,
Henderson IR, Shinn P, Pellegrini M, Jacobsen SE, Ecker JR:Genome-wide high-resolution mapping and functional analysis of DNA methylation in Arabidopsis.Cell2006,126:1189-1201.
38. Tomkins J, Yu Y, Miller-Smith H, Frisch D, Woo S, Wing R:A bacterial artificial chromosome library for sugarcane.Theoretical Appl Genet1999,
99:419-424.
39. McCarthy EM, McDonald JF:LTR_STRUC: a novel search and identification
program for LTR retrotransposons.Bioinformatics2003,19:362-367. 40. Sayers EW, Barrett T, Benson DA, Bolton E, Bryant SH, Canese K,
Chetvernin V, Church DM, DiCuccio M, Federhen S, Feolo M, Fingerman IM, Geer LY, Helmberg W, Kapustin Y, Landsman D, Lipman DJ, Lu Z, Madden TL, Madej T, Maglott DR, Marchler-Bauer A, Miller V, Mizrachi I, Ostell J, Panchenko A, Phan L, Pruitt KD, Schuler GD, Sequeira E,et al:
Database resources of the National Center for Biotechnology Information.Nucleic Acids Res2011,39:D38-D51.
41. Edgar RC:MUSCLE: multiple sequence alignment with high accuracy and
high throughput.Nucleic Acids Res2004,32:1792-1797.
42. Tamura K, Peterson D, Peterson N, Stecher G, Nei M, Kumar S:MEGA5:
Molecular Evolutionary Genetics Analysis using Maximum Likelihood, Evolutionary Distance, and Maximum Parsimony Methods.Mol Biol Evol
2011,28:2731-2739.
43. Hall TA:BioEdit: a user-friendly biological sequence alignment editor and analysis program for Windows 95/98/NT.Nucleic Acids Symp Ser1999,
41:95-98.
44. Vettore AL, Silva FRD, Kemper EL, Arruda P:The libraries that made SUCEST.Genet Mol Biol2001,24:1-7.
45. Untergasser A, Nijveen H, Rao X, Bisseling T, Geurts R, Leunissen JA:
Primer3Plus, an enhanced web interface to Primer3.Nucleic Acids Res
2007,35:W71-W74.
46. Mapping and Assembly with Qualities.[http://maq.sourceforge.net]. 47. Sambrook J, Fritsch EF, Maniatis T: InMolecular Cloning: A Laboratory ManualEdited by: Irwin N, Ford N, Nolan C, Ferguson M Cold Spring Harbor Laboratory Press , 2 1989.
48. Heslop-Harrison P, Schwarzacher T:Practical In situ HybridizationOxford, UK: BIOS Scientific Publishers Ltd; 2000.
doi:10.1186/1471-2164-13-137
Cite this article as:Domingueset al.:Analysis of plant
LTR-retrotransposons at the fine-scale family level reveals individual