UNIVERSIDADE FEDERAL DO RIO GRANDE DO NORTE INSTITUTO DO CÉREBRO
CONTRIBUIÇÕES PARA O ESTUDO DO
CÓDIGO NEURAL
Tese apresentada ao Curso de Pós-Graduação em Neurociências, Instituto do Cérebro, Universidade Federal do Rio Grande do Norte, como requisito parcial para a obtenção do título de Doutor em Neurociências.
Orientador: Sidarta TG Ribeiro Co-orientador: Adriano BL Tort Co-orientador no exterior: Rodrigo Quian Quiroga
Natal 2015
- 2 -
FICHA CATALOGRÁFICA
Lopes dos Santos, Vítor
Contribuições para o estudo do código neural – Natal, 2015.
85 páginas
Área de concentração: Neurofisiologia.
- 3 -
A IDÉIA
De onde ela vem?! De que matéria bruta Vem essa luz que sobre as nebulosas Cai de incógnitas criptas misteriosas Como as estalactites duma gruta?! Vem da psicogenética e alta luta Do feixe de moléculas nervosas, Que, em desintegrações maravilhosas, Delibera, e depois, quer e executa!
Vem do encéfalo absconso que a constringe, Chega em seguida às cordas do laringe, Tísica, tênue, mínima, raquítica ...
Quebra a força centrípeta que a amarra, Mas, de repente, e quase morta, esbarra No mulambo da língua paralítica.
- 4 -
S
UMÁRIO
Resumo _________________________________________________________________ 5
Introdução ______________________________________________________________ 6
Capítulo 1: Detectando assembleias em populações neuronais ___________________ 11
Capítulo 2: Extraindo informação de padrões temporais de disparo _______________ 30
Discussão ______________________________________________________________ 50
Anexo I: Detectando assembleias com análise de componentes principais __________ 62
Anexo II: On the neurophysiology of serotonergic hallucinogens __________________ 79
-- 5 --
R
ESUMO
Os recentes avanços técnicos das duas últimas décadas para o registro de sinais neuroeletrofisiológicos foram essenciais para que se testassem hipóteses há muito propostas acerca de como células nervosas processam e armazenam informação. No entanto, ao permitir maior detalhamento dos dados coletados, as novas tecnologias levam inevitavelmente ao aumento de sua complexidade estatística e, consequentemente, à necessidade de novas ferramentas matemático-computacionais para sua análise.
- 6 -
I
NTRODUÇÃO
O trabalho seminal de Adrian e Zotterman (1926) foi o primeiro a demonstrar que células nervosas poderiam transmitir informação, disparando pulsos elétricos (potenciais de ação) em resposta a estímulos externos. Hoje, depois de décadas de pesquisa, acredita-se, axiomaticamente, que a atividade elétrica dos neurônios é o elemento mais fundamental para o processamento de informação no sistema nervoso. O estudo do código neural a que me refiro no título desta tese é, portanto, a investigação científica acerca de como os bilhões de neurônios espalhados nas diversas áreas do encéfalo codificam informação por meio da emissão de potenciais de ação.
Nesses já quase cem anos transcorridos desde os resultados de Adrian e Zotterman, diversas tentativas de compreensão dos mecanismos de codificação têm se sucedido (Abeles, 2009; Buzsáki, 2010; Harris, 2005; Hebb, 1949; Izhikevich, 2006; Marr, 1970; Singer, 1993), produzindo avanços científicos, e compartilhando uma característica fundamental. Todas elas podem ser definidas com base em dois eixos ortogonais: o populacional e o temporal.
O que designo como eixo populacional de uma teoria do código neural é o modo de interação entre células que ela propõe. Em um extremo do eixo populacional, situam-se as hipóteses anedóticas de células da avó (Gross, 2002); as teorias de codificação localista. Para elas, cada objeto é codificado por poucas células e cada célula codifica no máximo alguns poucos objetos. Percorrendo esse eixo populacional, encontramos teorias de codificação menos esparsas, até chegarmos às teorias de codificação densa ou populacional. Nesse outro extremo encontramos a hipótese de equipotencialidade apresentada por Karl Lashley (1950), Segundo a qual a representação de qualquer objeto está completamente distribuída no sistema nervoso e o conhecimento do estado de uma célula específica não possui nenhum significado.
- 7 -
as assembleias. Visto do outro extremo, no entanto, Hebb propõe um código distribuído, pois a representação de objetos estaria espalhada em diversas células.
No que concerne ao eixo temporal, o posicionamento de uma teoria nessa dimensão é dado pelo modo como ela incorpora a importância dos padrões temporais de disparo dos neurônios para a codificação. Em um extremo do eixo temporal, estariam as hipóteses de codificação por taxa de disparo (rate coding), as quais afirmam que células neurais respondem a estímulos modulando a quantidade de potenciais de ação emitidos em uma longa janela de integração temporal.
Percorrendo esse eixo, deparamo-nos com teorias para as quais os padrões temporais de disparo possuem informação além da taxa de disparos. Esse esquema é chamado de codificação temporal (temporal coding). O leitor poderia argumentar que a teoria hebbiana, assim como outras hipóteses populacionais, teria necessariamente que adotar a codificação temporal, pois a integração de uma população (como uma assembleia) seria feita pela coordenação de disparos no domínio do tempo. No entanto, de acordo com a definição que emprego nesse texto, a ideia de padrão temporal de ativação é essencialmente ortogonal à de sincronia de assembleias. Por exemplo, Hebb apenas exige que uma célula, ao co-ativar-se com membros de uma asco-ativar-sembleia, aumente sua taxa de disparo. Em cada ativação de uma assembleia, seus membros podem disparar de forma não consistente, contanto que aumentem sua taxa de disparo. Hebb ainda propôs o encadeamento temporal de assembleias (phase sequences) como o mecanismo para conectar diferentes compartimentos de informação em processos mais complexos. No entanto, Hebb ainda nesse ponto não se preocupa com padrões temporais, apenas com sequências de ativação. A teoria do binding (binding theory), ao reescrever a teoria hebbiana, adiciona um elemento relevante que move a teoria no eixo temporal: a sincronização de membros de assembleias por oscilações (Singer, 2007). Por sua vez, Moshe Abeles (2009) vai além no eixo temporal com a hipótese que a sucessão de assembleias é realizada em uma sequência estereotipada, as synfire chains. Nesse caso, o intervalo entre a ativação de assembleias deve ser consistente e com precisão da ordem de poucos milissegundos.
A Figura 1.1 ilustra esse espaço de acordo como eu entendo diversos modelos de codificação.
- 8 -
e Dostrovsky, 1971). Paralelamente, o código neural parece tornar-se cada vez mais esparso conforme subimos a ordem da área analisada. Por exemplo, o código é densamente distribuído no início da via ventral (ventral stream) do sistema visual, mas torna-se cada vez mais esparso até chegar ao córtex temporal inferior onde respostas são extremamente seletivas e invariantes (e.g., células de conceito - concept cells; Quian Quiroga, 2012). Esse percurso no espaço dimensional é bem ilustrado pelo trabalho no sistema nervoso de insetos de Gilles Laurent (revisado em Laurent, 2002). A teoria que considero mais longe da origem dos eixos é a policronização de Izhikevich (2006). Voltarei a ela no Capítulo 4.
Figura 1.1. Representação dos modelos teóricos de codificação neural.
- 9 -
Nesta tese, apresentamos dois novos métodos computacionais (Lopes-dos-Santos et al., 2013; Lopes-Dos-Santos et al., 2015) aplicáveis à investigação da codificação neural, cada um deles para o estudo de um dos eixos definidos acima.
O primeiro deles, apresentado no Capítulo 2 desta tese, trabalha no eixo populacional. Como será revisado, por muitos anos o estudo de interações entre neurônios se limitou a observações de células individuais ou a análises par-a-par. Apenas mais recentemente, ferramentas começaram a ser apresentadas com a intenção de analisar uma população neural como um todo (ver Capítulo 2 para detalhes). Nesse contexto, contribuímos com um novo método, baseado na análise de componentes independentes, para a detecção e rastreamento de assembleias neurais. De forma não-supervisionada, nosso método é capaz de extrair padrões de co-ativação em trens de disparo imersos em uma grande população neuronal registrada simultaneamente. Demonstramos que essa ferramenta supera dificuldades de outros métodos publicados na detecção de significância estatística de assembleias e no isolamento entre padrões de co-ativação independentes. Um trabalho prévio a este, elaborado durante meu mestrado e publicado no início de meu doutorado (Lopes-dos-Santos et al., 2011), é incluído nesta tese no Anexo I.
No Capítulo 3 descrevo outro método que se aplica ao eixo temporal. A investigação de um potencial código temporal foi impossibilitada por décadas, dadas as limitações experimentais que impedem uma prolongada sessão de apresentação de estímulos a um animal. Considerar padrões temporais na atividade de uma célula, e não só o número total de disparos, leva inevitavelmente ao aumento da dimensionalidade das respostas. Várias técnicas foram propostas para reduzir o viés estatístico dessas análises nos últimos anos. Aqui, usamos decomposição wavelet para extrair componentes em trens de disparo que representem de maneira eficiente seus padrões temporais. Demonstramos que esse método supera os métodos mais usados em vários aspectos.
É relevante uma observação sobre a aplicabilidade dessas ferramentas. Métodos computacionais dão a oportunidade para que dados possam ser entendidos e processados contribuindo de maneira imprescindível para o estudo de uma hipótese. Porém, seria ingênuo concluir que elas são suficientes para tal. Métodos de análise devem ser usados complementarmente a paradigmas experimentais adequados. Por exemplo, no próximo capítulo demonstramos que assembleias podem ser detectadas no hipocampo e sua dinâmica pode ser caracterizada por nossa ferramenta. Porém, ainda falta ser demonstrado que as assembleias per se impactam o comportamento do animal.
- 10 -
elaboradas na presente tese podem vir a ser úteis, especialmente para gerar novos modelos de codificação e decodificação neural.
ContentslistsavailableatScienceDirect
Journal
of
Neuroscience
Methods
j o ur na l h o me p a g e :w w w . e l s e v i e r . c o m / l o c a t e / j n e u m e t h
ComputationalNeuroscience
Detecting
cell
assemblies
in
large
neuronal
populations
VítorLopes-dos-Santos∗,SidartaRibeiro,AdrianoB.L.Tort
BrainInstitute,FederalUniversityofRioGrandedoNorte,Brazil
a r t i c l e i n f o Articlehistory:
Received6January2013
Receivedinrevisedform11April2013 Accepted17April2013
Keywords:
Cellassemblies
Principalcomponentanalysis Independentcomponentanalysis Assemblyvectors
a b s t r a c t
Recentprogressinthetechnologyforsingleunitrecordingshasgiventheneuroscientificcommunitythe opportunitytorecordthespikingactivityoflargeneuronalpopulations.Atthesamepace,statisticaland mathematicaltoolsweredevelopedtodealwithhigh-dimensionaldatasetstypicalofsuchrecordings. Amajorlineofresearchinvestigatesthefunctionalroleofsubsetsofneuronswithsignificantco-firing behavior:theHebbiancellassemblies.Herewereviewthreelinearmethodsforthedetectionofcell assembliesinlargeneuronalpopulationsthatrelyonprincipalandindependentcomponentanalysis. Basedontheirperformanceinspiketrainsimulations,weproposeamodifiedframeworkthat incorpo-ratesmultiplefeaturesofthesepreviousmethods.Weapplythenewframeworktoactualsingleunit recordingsandshowtheexistenceofcellassembliesintherathippocampus,whichtypicallyoscillateat thetafrequenciesandcoupletodifferentphasesoftheunderlyingfieldrhythm.
© 2013 Elsevier B.V. All rights reserved.
Contents
1. Introduction... 149
2. Reviewofthemethods ... 150
2.1. Constructionofthespikematrix... 150
2.2. Determinationofthenumberofcellassemblies... 150
2.3. Extractionofcellassemblypatternsandestimationofcellassemblyactivity... 153
2.3.1. Principalcomponentanalysis... 153
2.3.2. Assemblyvectorestimation... 156
2.3.3. Independentcomponentanalysis... 158
2.3.4. Otherexamples... 158
3. Realdataapplications... 162
4. Discussion... 164
4.1. Limitations ... 165
5. Conclusion... 165
Acknowledgements... 165
AppendixA. Supplementarydata ... 165
References... 165
1. Introduction
Amainconcerninsystemsneuroscienceistounderstandhow singleneuronsformfunctionalneuronalcircuits ultimately giv-ingrisetocomplexinformation processingandbehavior. Much ofthecurrentknowledgehasbeenderivedfromtheanalysisof
∗Correspondingauthorat:BrainInstitute,FederalUniversityofRioGrandedo Norte,RuaNascimentodeCastro,2155–LagoaNova,Natal,RN59056-450,Brazil. Tel.:+558432152709.
E-mailaddress:vitor@neuro.ufrn.br(V.Lopes-dos-Santos).
thefiringrateofsingleunits(AdrianandZotterman,1926;Hubel andWiesel,1959;OkeefeandDostrovs,1971;Perrettetal.,1982), pairwisecorrelations(WilsonandMcNaughton,1994),and syn-chronybetweensinglecellsandlocalfieldpotentials(Siapasetal., 2005).Recenttechnologicaladvanceshaveopenedthepossibility ofrecordinglargepopulationsofneuronssimultaneously(Buzsaki, 2004).Theserecordingscreatedanewdemandformathematical andstatisticaltoolstoanalyzetheactivityofneuronalensembles as a whole, insteadof each unit at a time. New methods with differentstrategieshavebeenemployed,suchastemplate match-ing(LeeandWilson,2002;LouieandWilson,2001;Ribeiroetal., 2004),principalcomponentanalysis(ChapinandNicolelis,1999;
Lopes-dos-Santosetal.,2011;Peyracheetal.,2010),independent componentanalysis(Laubachetal.,1999),shufflingmethodsfor detectingrepeatedfiringsequences(AbelesandGat,2001;Abeles andGerstein,1988;Bergeretal.,2010;GanselandSinger,2012), andmethodsbasedoninformationtheory(Arabzadehetal.,2004; QuirogaandPanzeri,2009),amongothers.
Inthis reviewwefocusonlinearmethodsfor detectingand trackingtheactivityof cellassemblies embeddedinlarge neu-ronalpopulations.Here we definecellassemblies assubsets of neuronswithsignificantco-activationbehavior, asproposedby
Hebb(1949).Wecomparethree methodsthatrelyonprincipal componentanalysis(PCA).Basedontheirefficiencyinsimulated neuronalnetworks,weproposeamodifiedframeworkthat incor-poratesmultiplefeaturesofthesemethods.Weaimedtoprovidean intuitiveviewofthemethodsandtheirpossibleapplications. Rigor-ousmathematicalderivationscanbefoundinthereferencescited alongthetext.MATLABcodesandatutorialforrunningthe meth-odscanbeobtainedfromthecorrespondingauthoruponrequest.
2. Reviewofthemethods
Thegeneralprocedurecanbestructuredinthreemainsteps: (1)Constructionofthespikematrix,wherespiketrainsarebinned andnormalized;(2)Determinationofthenumberofcell assem-blies,whereanullhypothesisdistributionforcellassemblyactivity is generated; and (3) Extraction of cell assembly patterns and estimationofcellassemblyactivity,whereco-activationpatterns arefoundand usedtotracktheactivityofcellassemblieswith single-binresolution.Step1isstandardforallmethodsreviewed here,whilesteps2and 3maydiffer.Regardingstep2,herewe comparesurrogatemethodswithananalyticalthresholdrecently introducedinPeyracheetal.(2009),and,regardingstep3,we com-parepreviouslypublishedmethods(ChapinandNicolelis,1999; Laubachetal.,1999;Lopes-dos-Santosetal.,2011;Peyracheetal., 2010)andsuggestimprovements.
2.1. Constructionofthespikematrix
Allmethodsstudiedhereusematrixrepresentationsofspike trains.Inthissectionweshowhowtoconstructthespikematrix.
ToppanelofFig.1showstheactivityof20simulatedneurons bymeansofaspikerasterplot,inwhicheachblackmarkdenotes anactionpotentialofagivenneuron(verticalaxis)inagiventime (horizontalaxis).Thespikematrixisconstructedbybinningthe rasterplotandcountingthenumberofspikeselicitedbyeach neu-ronwithineachbin(Fig.1middle);Atthispointeachmatrixentry denotesthenumberofspikesofagivenneuron(rows)inagiven timebin(columns).Inthisexampleweemployabinsizeof100 mil-liseconds.Next,thespikecountofeachneuron(i.e.,eachrowofthe matrix)isnormalizedbyz-scoretransformation(Fig.1bottom):
zib=sib−si
si
wherezibisthez-scoredspikecountofneuroniintimebinb,sib isthenumberofspikesofneuroniinbinb,Siisthemeanspike countofneuronioveralltimebins,andSiisthestandarddeviation ofthespikecountsofneuronioverbins.Thus,inthez-scoredspike matrixeachneuronissettohavenullmeanandunitaryvariance.
2.2. Determinationofthenumberofcellassemblies
Beforeextractingassemblypatternsitisimportanttoknowhow manycellassembliesaretheretobefound.Peyracheetal.(2010, 2009)introducedtheuseofeigenvalueanalysisfordetermining thestatisticalsignificanceofassemblypatterns.Weprovidesome toyexamplesbelowtoillustratethisprocedure.
Fig.1.Pre-processingofspikingactivitydata.Toppanel:spikerasterplotof20 simulatedneurons.Dotsrepresentspiketimesandbluelinesdenotetheboundaries of100-mstimebins.Middlepanel:Non-normalizedspikematrix.Eachelementof thematrixisthenumberofspikesofagivenneuron(row)withinagiventime bin(columns).Bottompanel:Normalizedspikematrix.Thespikingactivityofeach neuronisz-scored.(Forinterpretationofthereferencestocolorinthisfigurelegend, thereaderisreferredtothewebversionofthearticle.)
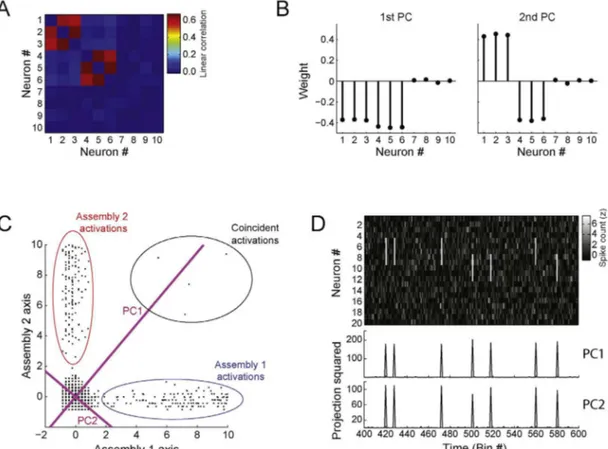
Fig.2showstwoscatterplotsinwhicheachpointrepresentsthe normalizedspikecountofapairofneuronsatthesametimebin. ThespikingactivityoftheneuronpairdisplayedinFig.2Ais cor-related,whiletheactivityofthepairinFig.2Bisnotcorrelated. Noticethatthevarianceofthedataconcentratesinagiven direc-tionwhenvariablesarecorrelated(Fig.2A),whilethevarianceis homogeneouslydistributedacrossalldirectionswhenvariablesare notcorrelated(Fig.2B).
Fig.2.Principalcomponentsandspikecountcorrelations.(A,B)Panelsshowscatterplotsofthespikingactivityoftwoneurons.Eachpointdenotesthez-scoredspiking activityofapairofsimulatedneurons(100-mstimebinswereused;eachneuronisrepresentedbyanaxis).Redandbluearrowsdenotefirstandsecondprincipalcomponents, respectively.Colorednumbersinformthevarianceofthedataintheaxesspannedbytheprincipalcomponents(coloredlines;samecolorconvention).PanelAshowsa correlatedpairofneuronsandpanelBshowsanuncorrelatedpair.(Forinterpretationofthereferencestocolorinthisfigurelegend,thereaderisreferredtothewebversion ofthearticle.)
andunitaryvariance,inourcasethecovariancematrixisequalto thecorrelationmatrix,andcanbecalculatedas:
C= ZZ
T
Ncolumns
whereZisthe(z-scored)spikematrix,Tthetransposeoperator, andNcolumnsisthenumberoftimebinsofZ.Thus,theelementat
thei-thcolumnandj-throwofCisthelinearcorrelationbetween neuronsiandj.SinceCisnecessarilyrealandsymmetric,itfollows fromthespectraltheoremthatitcanbedecomposedas:
C=ixixiT
wherexiisthei-theigenvectorofC(thatis,thei-thPCofZ)andi itscorrespondingeigenvalue.Moreover,theouterproductxixiTis
theprojectionmatrixontothedirectionofxi,andiisthevariance ofthedataalongthesameaxis.
InFig.2theredandbluelinesrepresentthefirstandsecond PCs,respectively,andtheireigenvalues(i.e.,variances)areshown withsamecolorlabels.Asmentionedabove,whenspiketrainsare uncorrelated,asinFig.2B,thevarianceofthedataprojectedonto anydirectionisroughlythesame.Infact,theywouldbeexactly equalifinfinitesampleswereanalyzed.Randomfluctuationsdue toundersamplingproduceadirectionwithslightlylargervariance thatisdetectedasthefirstPC.In thecaseofcorrelatedactivity (Fig.2A),thevariance issignificantly moreconcentrated inthe directionof thefirstPC. These observationscan begeneralized forhigherdimensionalsignals:datavariancewillbesignificantly largerina givendirectionifthereisa linearlycorrelatedgroup ofcells.Followingthisreasoning,apossiblestrategytoestimate thenumberofcellassemblies(subsetsofneuronswithcorrelated activity)istofindthenumberofPCsofthespikematrixwith sig-nificantlylargeeigenvalues.
Peyrache et al. (2009, 2010) proposed the use of the
Marˇcenko–Pasturdistributionasanullhypothesisforthe exist-enceofcellassemblies.MarˇcenkoandPastur(1967)demonstrated thattheeigenvaluesofthecorrelationmatrixofanormalrandom matrixMwithstatisticallyindependentrowsfollowaprobability functiondescribedby:
p()= q
22
(max−)(−min)
,
withq=Ncolumns/Nrows≥1,where2isthevarianceoftheelements
ofM(inourcase2=1duetoz-scorenormalization),N columnsis
thenumberofcolumnsandNrowsthenumberofrows.maxand
min arethemaximumandminimumbounds,respectively,and
arecalculatedas:
maxmin =2(1±1/q)2
Thisprobabilityfunctionhasfinitesupportgivenbytheinterval
min≥≥max.Thus,iftherowsofMarestatisticallyindependent,
theprobabilityoffindinganeigenvalueoutside theseboundsis zero.Inotherwords,thevarianceofthedatainanyaxiscannotbe largerthanmaxwhenneuronsareuncorrelated.Therefore,max
canbeusedasastatisticalthresholdfordetectingcellassembly activity(Peyracheetal.,2010).Thatis,thenumberofeigenvalues abovemaxcanbeusedtoestimatethenumberofcellassemblies
inthespikematrix.
Althoughthistheoreticalboundwasderivedforlargematrices, itisalsoarobustthresholdforsmallermatrices(Lopes-dos-Santos etal.,2011;Plerouetal.,2002).Nevertheless,Peyracheetal.(2010)
proposedtheuseofafinitesamplebiascorrectionbasedonthe Tracy–Widomdistribution(TracyandWidom,1994).Inaddition, itshouldbenotedthatalthoughtheMarˇcenko–Pasturdistribution wasprovedforrandommatriceswhoseentriesarederivedfrom Gaussiandistributions,empiricalsimulationsshowthatthis dis-tributionalsoprovidesagoodboundforeigenvaluesofmatrices composedbyindependentrows(inourcase,uncorrelatedneurons) originatedfromotherrandomprocesses(Birolietal.,2007; Lopes-dos-Santosetal.,2011;Seba,2003).Moreover,weneverobserved “falsepositive”eigenvaluesinsimulationsemployingPoisson neu-rons,i.e.,thenumberofeigenvaluessignificantlylargerthanchance wasalwaysequaltoorlessthantherealnumberofassemblies.
tionistodefineastatistical thresholdbasedonsurrogatedata. Thisprocedure entailsthe shuffling of time binsfor each neu-ronindependently in order todestroy their temporal relations whilemaintainingthedistributionofspikecountsunchanged.The eigenvaluesofcorrelationmatricesobtainedfromshuffledspike matricescanbeusedtoconstructanulldistribution;forexample, theeigenvaluesoftheoriginalspikematrixthatarelargerthan a certainpercentile(e.g.,95%or99%) ofthedistributionofthe maximaleigenvaluescomputedfromshuffleddataareregardedas significant(thatis,inthisframeworkeachsurrogatematrix con-tributesitsmaximaleigenvaluetothechancedistribution,whichis amoreconservativeapproachthanconsideringallsurrogate eigen-values).
Inordertocomparetheanalyticalandshufflingmethods,we simulatedspikematriceswith32neuronsand10,000bins.Neurons weremodeledasPoissonprocesseswithunitarymean. Addition-ally,binsofeachneuronwererandomlychosenasactivationbins, inwhichthespikecountwasderivedfromauniformrandom dis-tributionfrom0to6spikes,thuslikelyabovetheoverallmean.In ordertosimulateassemblies,wesetfivesubsetsofneurons(i.e., fivecellassemblies)tohavecoincidentactivationbins(assembly activations).Note thatalthoughassembly membersincrease fir-ingtogether,eachassemblyactivationisuniquesincethefiringof assemblymembersisstochastic.ThetoppanelsofFig.3Bdisplay resultsforspikematriceswiththefollowingassembly composi-tion:assembly1neurons:#1,#2,#3,#4;assembly2:#5,#6,#7, #8;assembly3:#9,#10,#11,#12;assembly4:#13,#14,#15, #16;assembly5:#17#18,#19,#20.Linesrepresentthemeanover 150simulationsandbarsindicatestandarddeviation.Thisexample showsthattheanalyticalandtheshufflingmethodsconvergetothe correctnumberofassembliesafteracertainnumberofactivations haveoccurred.ThebottompanelsofFig.3Bshowsimilarresultsbut forasetofassembliesinwhicheachassemblysharesneuronswith atleasttwootherassemblies(assembly1neurons:#1,#2,#3,#4, #5;assembly2:#5,#6,#7,#8,#9;assembly3:#9,#10,#11,#12, #13;assembly4:#12,#13,#14,#15;assembly5:#15,#16,#17, #1).Theanalyticalandtheshufflingmethodsalsoconvergetothe correctnumberofassembliesinthiscase,althoughmore assem-blyactivationsarenecessarythaninthecaseofnon-overlapping assemblies.
Next,wecompareanalyticalandnumericaldistributionsof ran-domeigenvaluesfordatawithamorerealisticstructure.Insteadof usingPoissonneurons,wecreated20neuronsbasedonthespike trainsofaneuronrecordedfromtherathippocampus.Spikeswere binnedinto10-mswindows(120,000bins,or20min,intotal)and newspiketrainswerecreatedbytwosurrogatemethods.Thefirst ofthemisthesamebinshufflingmethodusedforFig.3B.The sec-ondisachievedbymeansofacircularrandomshift.Thatis,for eachneuronatimepointisrandomlychosenandusedtodividethe spiketrainintwonon-overlappigsegmentswhichswitchposition. Thismethodcreatessurrogateneuronswithsamerateand vari-anceoftheoriginalneuron,andvirtuallythesameautocorrelation andinter-spike-interval(ISI)distribution.
Weestimatedthedistributionofeigenvaluesforindependent activityby computingthe averageeigenvalue histogram across 1000simulationsforeachsurrogatemethod.Sincethedistribution isaffectedbytheratioq=Ncolumns/Nrows,werepeatedthe
proce-dureformatriceswithdifferentnumberofbins (Ncolumns) while
keepingthenumberofneuronsfixed.Fig.3Cdisplaysthe eigen-valuedistributionestimatedbyeachsurrogatemethodalongwith theMarˇcenko–Pasturdistributionforeachq.Finally,wecompare the95percentiledrawnfromthenumericaldistributionswiththe upperboundoftheanalyticaldistributioninthebottomrightpanel ofFig.3C.Surprisingly,the95percentileofthecircularshiftmethod matchesverycloselytheupperboundoftheanalyticaldistribution.
theupperanalyticalboundforallvaluesofqstudied.Altogether, theresultsindicatethatthetheoreticalboundderivedfromthe Marˇcenko–Pasturdistributioniswellsuitedfortrackingthe num-berofcellassemblies,sincesurrogatemethodsgivesimilarresults butarecomputationallydemanding.Moredetailedparametrical studiesontheMarˇcenko–Pasturdistributioncanbefoundin Lopes-dos-Santosetal.(2011).Itisneverthelessadvisabletocomparethe analyticalandshufflingmethodswhenworkingwithactualspike recordings,sincethespecificstatisticalpropertiesofagivendataset maybedifferentfromthesimulatedexamplesemployedhere.In thisregard,avaluablefeatureofthesurrogatemethodisthat sur-rogatespikematricescanbegeneratedinsuchawaythatneurons preservetheirISIdistributionandautocorrelation,thuspreserving morestatisticalpropertiesoftheoriginaldata.
2.3. Extractionofcellassemblypatternsandestimationofcell assemblyactivity
Inlinearmodels,theactivityofacellassemblyisassumedto bealinearcombination(aweightedsum)ofthespikeactivityof allneurons.Thus,eachco-activationpattern(alsocalledassembly pattern)isavectorthatattributesweightstoeachneuron.Foreach pattern,cellassemblyneuronscanbeidentifiedasthosewiththe largestweights.
Inmathematicalterms,theactivityofacellassemblyinagiven timebinbcanbedefinedas:
Rb=
i=Nneurons
wizib=wTZb,
where Nneurons isthenumber ofneurons,zib isthe z-scored activityofneuroniatthetimebinb,wiistheweightofthe corre-spondingneuronintheassembly,wisacolumnvectorcontaining theweightsofallneuronsintheassemblyandZbistheb-thcolumn ofthespikematrixZ.
Thissectiondealswiththeproblemoffindingco-activation pat-ternswforeachcellassembly.Westudythreedifferentmethodsfor obtainingw,whicharebasedonPCA(ChapinandNicolelis,1999; Peyracheet al.,2010), assembly vectors(AV)(Lopes-dos-Santos etal.,2011),andindependentcomponentanalysis(ICA)(Laubach etal.,1999).
2.3.1. Principalcomponentanalysis
Nicoleliset al.(1995)employedPCAtostudytheactivityof thalamo-corticalassembliesduringtheoccurrenceofmurhythm inrats,usingthePCsthemselvesasco-activationpatternstotrack ensembleactivity(ChapinandNicolelis,1999).Later,Peyracheetal. (2010) introduceda template-matchprotocol by which assem-blypatternsidentifiedduringlearningepochsareusedtoassess assembly activityduringpre- and post-learningsleep episodes. Employingthisframework, theyshowedthatsubsets ofmedial prefrontal.Cortexneuronsthatwereco-activeduringrewarded runsinaT-masktaskalsoco-activatedduringsubsequent slow-wavesleep,mainlyduringhippocampalrippleevents(Peyrache etal.,2009).Morerecently,Benchenaneetal.(2010)usedthePCA approachtoshowthattheco-firingofassemblyneuronsoccursat apreferredphaseofthethetarhythm.
Fig.4.Detectingcellassembliesandtrackingtheiractivityusingprincipalcomponentanalysis.(A)Leftpanel:Non-normalizedspikematrixcomposedby20simulated neurons(totalsimulationtime:8000bins).EachneuronwasmodeledasaPoissonprocesswithmeanrateof1spike/bin.Additionally,250activationbins(around3%ofthe totalnumberofbins)wererandomlychosenforeachneuron:inthesebins,thespikecountwasderivedfromauniformdistributionbetween0and6spikes.Inorderto simulateassemblies,subsetsofneuronsweresettohavecoincidentactivationbins.Inthisexample,twoassembliesarepresent:assembly1(neurons#14,#15,#16,#17) andassembly2(neurons#18,#19and#20).Rightpanel:Correlationmatrix.(B)Principalcomponentsandeigenvalues.Toppanelshowstheeigenvaluesofthecorrelation matrixshowninA.Reddashedlinedenotestheanalyticalsignificancethreshold.Twoeigenvaluesaresignificantinthiscase.Bottompanelshowsprincipalcomponents associatedwiththeeigenvaluesshownabove.(C)Toppanelsdisplaytheprincipalcomponentsassociatedwiththeeigenvaluessignificantlyabovechance.Lowerpanels showthecorrespondingouterproductsofeachprincipalcomponent,whichareprojectorsofthespikematrixusedforcomputingcellassemblyactivitywithsingle-bin resolution.(D)ToppanelshowsarepresentativetimeintervalofthesamespikematrixasinAafterz-scorenormalization.Lowerpanelshowstheactivityofthedetected assembliesestimatedbytheprincipalcomponentsshowninC.Notethatthepeaksofassemblyactivitycorrespondtoco-activationsofthecorrespondingassemblymembers. (Forinterpretationofthereferencestocolorinthisfigurelegend,thereaderisreferredtothewebversionofthearticle.)
wasuniformlydistributedbetween0and6spikes.Twoassemblies wereprogrammed:assembly1,composedbyneurons#14,#15, #16,#17; andassembly2, composedbyneurons#18,#19and #20.Fig.4BdisplaysthePCsalongwiththeirassociated eigen-values.Thereddashedlinerepresentsthesignificancethreshold providedby theMarˇcenko–Pasturdistribution.Inthis example,
Fig.5. Examplesoflimitationsofassemblypatternestimationbyprincipalcomponents.(A)Correlationmatrixofasimulatedspikematrixwith8000binsand10neurons. Twoassemblieswereprogrammedwiththefollowingcomposition:assembly1,neurons#1,#2,#3;assembly2,neurons#4,#5,#6.Neuronsandassembliesweresimulated asinFig.4.Eachassemblywasactivefor200bins,wherethespikecountofassemblymembersassumedauniformdistributionfrom0to30.(B)Significantprincipal componentsofthecorrelationmatrixshowninA.(C)Projectionofthecolumnsofthespikematrixontothesubspacespannedbytheidealassemblypatterns.Idealassembly patternshavesameweightsforassemblymembersandnullweightsforotherneurons.Pointsrepresentingactivationsofassembly1and2arecircumscribedbyblueand redellipses,respectively.Binsinwhichbothassemblieswereactivearecircumscribedbyablackellipse.Axesspannedbytheprincipalcomponentsarerepresentedby magentalines.(D)Toppanel:Atimeintervalofasimulatedspikematrixwith20neuronsshowingactivationsoftwoassemblieswithoverlappingmembership(assembly 1,neurons#6,#7,#8,#9;assembly2,neurons#8,#9,#10,#11).Bottompanels:assemblyactivitiesestimatedwhenprincipalcomponentsareusedtodefineassembly patterns.AdaptedfromLopes-dos-Santosetal.(2011).(Forinterpretationofthereferencestocolorinthisfigurelegend,thereaderisreferredtothewebversionofthe article.)
Thenextstepistousetheassemblypatternstocomputethe timecourseofeachcellassemblyactivitywithsingle-bin resolu-tion.Theactivityofeachassemblycanbeestimatedbyprojecting thecolumnsofthespikematrixontotheaxisspannedbythe cor-respondingassemblypattern(inthiscase,assumedtobethePCs). TheprojectionofacolumnZbontoanaxiscanbecalculatedas:
proj=PZb,
wheretheprojectionmatrixPisdefinedas:
P=w⊗w=wwT,
where⊗istheouterproductoperatorandwisaunitaryvector thatspanstheaxis.Thevectorwistheassemblypattern.Ateach timebin,thelengthoftheprojectionisameasureofthesimilarity betweentheactivityofthewholepopulationandtheassembly pat-tern.Thislengthiscalculatedbytakingtheinnerproductbetween theassemblypatternwandZb(i.e.,aweightedsumofthe normal-izedspikecounts).Alternatively,thestrengthoftheprojectionwas definedbyPeyracheetal.(2010)asthesquareoftheprojection length,whichcanbecalculatedas:
Rb=ZT
bPZb,
wherePis theouterproductoftheassemblypattern.Hereafter wewilladoptthisdefinitionofassemblyactivity.Theprojection matricesfortheassemblypatternsinthelastexampleareshown inFig.4C bottompanels. Ofnote,sincewe areconcernedwith
co-activationpatterns,themaindiagonalofPissettozero,which assuresthatisolatedactivationsofassemblymembersdonot con-tributetoR(Lopes-dos-Santosetal.,2011;Peyracheetal.,2010).
Fig.4DshowsatimeintervalofthespikematrixZalongwiththe estimatedtimecourseoftheactivityofthetwocellassemblies. Notethatthepeaksoftheblacktime-coursearecoincidentwith theco-activationofneuronscomposingassembly2,whilethered
time-coursepeakswiththeactivationsofassembly1.
idealassemblypatternsshouldhavelargeweights(withthesame sign)onlyforthemembersofthecorrespondingassembly.Fig.5C showstheprojectionofthedataontothespacespannedbythe idealassemblypatterns(alargevalueinagivenaxismeansthatthe correspondingassemblywasactiveatthattimebin).Theaxesof thesignificantPCsaredisplayedasmagentalines.Notethatlength oftheprojectionsontotheaxisdefinedbythefirstPCaresimilar forbothassemblies;therefore,inthisexampletheactivitytime courseestimatedbytheouterproductofthefirstPCpeakswhen eitherassembly1or2isactive(notshown).
Thisproblemgetsmorecriticalwhenassembliesshareneurons (Lopes-dos-Santosetal.,2011).Asharedneuronshouldideallyhave largeweightinbothassemblypatterns;however,thiscannotbe representedbyPCssincePCsareorthogonalbydefinition.Inorder toillustratethisissue,aspikematrixwassimulatedwith20 neu-ronsmodeledasPoissonprocesseswithunitarymeanfor8000time bins.Foreachassembly,40binswererandomlychosenas assem-blyactivations,inwhichassemblymemberselicited6spikes.Two assemblieswereincluded:assembly1composedbyneurons#6, #7,#8and#9,andassembly2composedbyneurons#8,#9,#10, #11and #12.Fig.5Dshows atimeinterval ofthespikematrix alongwithassemblyactivitiescomputedfromtheouterproductof thesignificantPCs.Noticethatbothtimecoursespeakwhenever assembly1or2isactive.
Inanattempttoovercometheselimitations,Lopes-dos-Santos etal.(2011)haveproposedamethodthatsearchesforclusters ofneuronsinthesubspacespannedbythePCs.Wereview this frameworkinthefollowingsection.
2.3.2. Assemblyvectorestimation
ThePCweights(loadings)carryinformationaboutcellassembly membership,inthesensethatlargeweightedneuronsarepartof anassemblywhileneuronswithnearzeroweightsarenot. How-ever,howlargeshouldtheweightofaneuronbeinordertomakeit partofanassembly?Theassemblyvector(AV)estimationmethod wasdevelopedtoidentifythemembershipofcellassembliesin additiontoextractingassemblypatterns(Lopes-dos-Santosetal., 2011).TheframeworkissummarizedinFig.6.Aspikematrix com-posedof32neuronswassimulatedasintheexampleofFig.4.Two assemblieswereprogrammed:assembly1withneurons#27,#28, #29,#30;andassembly2withneurons#29,#30,#31,#32.Fig.6A showsthecorrelationmatrix(leftpanel)alongwithitseigenvalues distribution(rightpanel).Asinthepreviousmethod,thenumber ofcellassembliesisdeterminedbymeansoftheMarˇcenko–Pastur distribution.
NotethatevenwhenthePCsmixassemblypatterns,the thresh-old derived from the Marˇcenko–Pastur distribution still holds (Lopes-dos-Santosetal.,2011).Thishappensbecauseactivations ofdifferentassembliescannotlieinthesameaxis(otherwisethey wouldbeasingleassembly),andthereforevarianceincreasesinthe samenumberofaxesasthenumberofassemblies.Moreover,note thatwhentwoneuronsarecorrelated,thevarianceconcentrates inagivenaxis(theassemblyaxis)anddecreasesintheorthogonal axis(Fig.2A),whichleadstooneeigenvaluesignificantlyabove chancedistributionandanothersignificantlybelow.Thiscanbe generalizedfor groupsofneurons: forexample,iffourneurons participateinoneassembly,thevariancewillincreaseinoneaxis anddecreaseinotherthree.Followingthisreasoning, Lopes-dos-Santosetal.(2011)haveshownnumericallythatthenumberof eigenvaluesoutsidethetheoreticaldistributioncanbeusedto esti-matethenumberofassemblyneurons.Thus,intheAVframework thenumberofneuronscomposingatleastoneassemblyis esti-matedbycountingthetotalnumber ofeigenvaluesoutsidethe Marˇcenko–Pasturdistribution,i.e.,aboveorbelowthetheoretical bounds(Lopes-dos-Santosetal.,2011).Theseboundsareindicated intherightpanelofFig.6Abydashedredlines.Inthisexample,
sixeigenvalueslieoutsidethedistribution(2aboveand4below), whichmatchesthenumberofneuronsparticipatingincell assem-blies.
Inordertoidentifycellassemblyneurons,thecolumnsofthe correlationmatrixareprojectedontothesubspacespannedbythe PCsassociatedwithsignificantlylargeeigenvalues(i.e.,abovethe upperlimitoftheMarˇcenko–Pasturdistribution):
Ni=PASCi,
whereCiisthei-thcolumnofthecorrelationmatrixandPASisthe projectionmatrixoftheassemblyspace,definedas:
PAS=
i
PciPciT=PcPcT,
wherePciisthei-thsignificantPCandPcisamatrixcontainingall significantPCs(columns).
In this framework, this subspace is called Assembly Space
(Fig.6B),andthecolumnsofthecorrelationmatrixprojectedonto thissubspace(Ni)arecalledneuronvectors.
Sincesixeigenvalueslieoutsidethetheoreticaldistribution,the sixneuronswithlargestneuronvectorsareregardedassignificant neurons.Notethatneuronsthathavesimilarcorrelationpatterns willhaveneuronvectorsclusteredtogetherintheAssemblySpace. On theotherhand,ifneurons haveorthogonalcorrelation pat-ternstheirneuronvectorswilltendtobeseparatedinthisspace. Followingthisreasoning,theinnerproductsbetweenallneuron vectorsandthoseofthesignificantneuronsisameasureof simi-laritybetweentheirco-activationpatterns.Thematrixcontaining theseinnerproductsiscalledInteractionMatrix(Fig.6C),whichcan beformallydefinedas:
Mi,j=NiTNj,
whereMi,jisitselementatrowiandcolumnj,Niistheneuron vectorofneuroniandNjistheneuronvectorofsignificantneuron
j.
Inprinciplethesamecouldbedonebythedirectuseofthe columnsof thecorrelationmatrix.However, itis reasonableto assumethatassemblypatternscanbedescribedbyalinear combi-nationofthesignificantPCs(asinFig5B,C).Thus,PCsareusedto
filterthedataandtheinnerproductsaretakeninsidetheAssembly Space.
Ideally,thedistributionofinnerproductsisbimodal,andthere isathresholdthatseparateslargeandlowvalues(Fig6D,left)and canbeusedtodigitalizetheinteractionmatrix(‘1’isassignedto val-uesabovethethresholdand‘0’toothers).Automatedalgorithms, suchasstandardk-means,canfindsuchathreshold.Aclustering algorithmisthenappliedtothedigitalizedinteractionmatrixto identifyassemblymembership(Fig.6D,right),undertheconstraint thattherearetwoassemblies(whichcorrespondtothenumberof eigenvaluesabovetheMarˇcenko–Pasturdistributioninthis exam-ple).Finally,theAVsaredefinedasthemeanofallneuronvectors exclusivetoanassembly(Fig.6E):
AVa=1
na
i Ni,
whereNiistheneuronvectorofanexclusiveneuronofthe corre-spondingassemblyandnaisthenumberofexclusiveneurons.
activityofindividualcellassemblies,whichcannotbeachievedby theoriginalPCAmethodinthiscase(Fig.6G).
DespitebeinganimprovementovertheoriginalPCAframework, theAVmethodhaslimitations.First,theAVmethodbydefinition requireseach assembly tohaveat leastoneexclusive member. Moreover,theseparationbetweensmallandlargeinnerproducts intheAssemblySpace(Fig.6C)isnotalwaysclear.Thisis criti-calbecausek-meanssplitsthedataintotwogroupsirrespectiveof whethertheyareclearlyseparatedornot,whichmayleadto spu-riousseparation.Belowwedescribeanothermethodforextracting assemblypatternsthatalsoreliesonfirstanalyzingthespikematrix usingPCA,andthenproceedswithICAtoidentifyassemblypatterns evenwhencellassemblieshavenoexclusiveneuron.
2.3.3. Independentcomponentanalysis
Laubachetal.(1999,2000)introducedICAtoquantify interac-tionsamongneurons.InthissectionwereviewbasicICAtheory andshowhowthistoolcanbeusedtoestimateassemblypatterns. Roughlyspeaking,ICAisamethodtoextractstatistically indepen-dentnon-Gaussiancomponentsofamultivariatesignal.Rigorous mathematicalderivationscanbefoundelsewhere(Comon,1994; HyvarinenandOja,1997;JuttenandHerault,1991).Assumingthat thetimecourseoftheactivityofanassemblyisdescribedas:
R=wTZ,
notethatweonlyknowZ(thespikematrix)andmustestimate bothwandR.
ICAreliesontheCentralLimitTheorem,whichstatesthat(under certainconditions)themixoftwoindependentrandomvariables ismoreGaussianthantheoriginalvariables.Inotherwords,any linearcombinationofindependentassemblyactivitiesisexpected tobemoreGaussianthantheindividualassemblyactivities them-selves.Fromthisreasoning,ICAiterativelyrotatestheaxesofan initialrandom vectorwin ordertominimizesomeGaussianity measureofy=wTZ.AsnotedbyHyvarinenandOja(2000),there
areseveralmeasuresofGaussianity(ornon-Gaussianity).Herewe employthefastICAalgorithm(Hyvarinen,1999;HyvarinenandOja, 1997)whichusesapproximatingnegentropy,definedas:
Jappr(y)=
i
[E{Gi(y)}−E{Gi(v)}]2,
wherevisaGaussianvariablewithzeromeanandunitaryvariance,
andGiarethenon-quadraticfunctions:
G1(u)=1
alogcoshau, G2(u)=−exp(− u2
2),
where1≤a≤2.Forfurtherdetailsonapproximatingnegentropy andotherGaussianitymeasuresseeHyvarinenandOja(2000).
UsingICA,Laubachetal.(1999, 2000)studiedhow neuronal ensemblesin the motor cortex of rats evolved as the animals learnedtoperformareaction-timetask.Intheirwork,however, theauthorsassumedthatthenumberofeigenvalueslargerthan 1representedthenumberofsignificantindependentcomponents (andhencethenumberofassemblypatternsconsideredforfurther analyses).Thisprocedureconsiderablyoverestimatesthenumber ofcellassembliesinthenetwork,which,asreviewedabove,should betakenasthenumberofeigenvaluesabovetheupperlimitofthe Marˇcenko–Pasturdistribution.Weobservedthroughsimulations thattheincorrectdeterminationofthenumberofassembliesmay leadtospuriousresults(notshown).Thisbecomesmorecritical ifICAisperformedintheoriginaldataspace,i.e.,withnoprior dimensionalityreduction.Inthiscase,assemblypatternsare bro-kenintotwoormoreindependentcomponents.Inaddition,since ICAbydesigndoesnotextractco-activationpatterns,some inde-pendentcomponentsmayrepresenttheactivityofsingleneurons
thatdonotfirefollowingaGaussiandistribution.Toavoidthese issues,herewesuggestamodificationoftheoriginalICAapproach whichisachievedbyincorporatingtheuseoftheMarˇcenko–Pastur distributioninordertoestimatethenumberofcellassemblies.This modifiedapproachinvolvesfirstreducingthedimensionalityofthe spikematrixZbyprojectingZontothesubspacespannedbythe significantPCs,andthencomputingtheindependentcomponents throughthefastICAalgorithm.Insimpleterms,thenewframework firstfindsthesignificantPCsandthenrotatesthemtomatchthe
idealassemblypatterns.
Fig.7illustratestheperformanceofPCAandmodifiedICA frame-works in extracting non-orthogonal assembly patterns.A spike matrixwassimulatedasbefore,butwith20neurons.Assembly membershipwas:assembly1,neurons#11,#12,#13,#14; assem-bly2,neurons#14,#15,#16,#17;andassembly3,neurons#18, #19,#20.Notethatneuron#14participatesinassemblies1and2. ThecorrelationmatrixisshowninFig.7A,alongwithits eigenvec-torsandeigenvalues.Sincetherearethreecellassemblies,three eigenvalues lie above thetheoretical threshold. The significant PCsandtheindependentcomponentsareshowninFig.7B.Note thatwhiletheindependentcomponentscorrectlyattributelarger weightstotheproperassemblymembers,thePCsfailtocorrectly segregateassemblypatterns.Fig.7Cshowsatimeintervalofthe spikematrixalongwiththetimecourseofassemblyactivity esti-matedbybothmethods.Notethattheblueassemblycomputed bythePCAmethodpeaksfortheactivationsofbothassemblies 1and 2, whileassembly activitiescomputedfromindependent componentscorrectlytrackindividualassemblyactivations.
2.3.4. Otherexamples
For further comparisons, we applied the three methods describedabovetotwootherexamples.Inbothcases,assemblies werehighlydistributedandthusdifficulttosegregate.
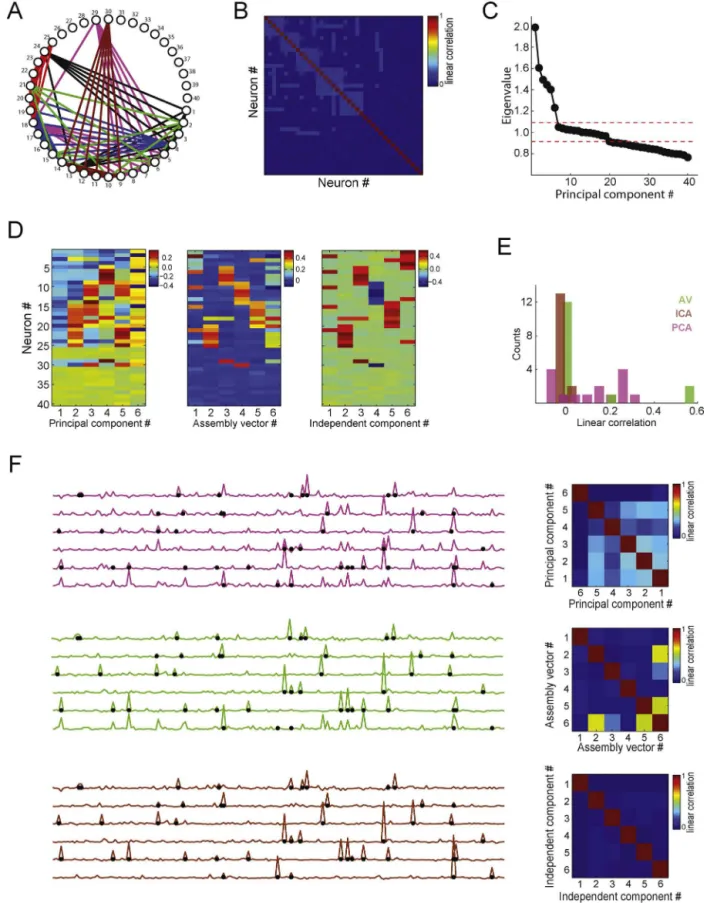
Thefirstexampleisshown inFig.8.Aspikematrixwith40 neurons(1spike/binmeanrate)and20,000timebinswas simu-lated;eachneuronhad800activationbins.AsshowninFig.8A,the assemblyidentitieswere:assembly1,neurons#1,#2,#3,#4,#5, #13,#24;assembly2,neurons#4,#5,#6,#7,#8,#9,#18,#29; assembly3,neurons#9,#10,#11,#12,#13,#14,#30;assembly4, neurons#3,#14,#15,#16,#17,#18,#19,#20;assembly5, neu-rons#18,#20,#21,#22,#23,#24,#25;assembly6,neurons#2, #6,#10,#15,#21,#31.Fig.8Bshowsthecorrelationmatrix;the eigenvaluedistributionisshowninFig.8C.Sixeigenvalueslieabove theupperboundandtwenty-twobelowthelowerthreshold,which matchesthenumberofsimulatedassemblies(6)andthenumber ofassemblyneurons(28).
Fig.8Dshowshoweachmethodestimatedtheassembly pat-terns.While PCAmixed theassemblypatterns,theAV and ICA methodscorrectlyattributedlargerweightswithsamesignsfor assembly memberswithina pattern. For instance,independent component#1andassembly vector#1representedassembly6 (greenassemblyinFig.8A).Sinceactivationbinsareindependent amongassemblies, assemblyactivitiesshouldideally not corre-late.Fig.8Eshowsthehistogramoflinearcorrelationcoefficients obtainedforallpossiblepairsofassemblyactivities.Notethatthe PCAmethodestimatesassemblyactivitiesthataremorecorrelated thanwhenestimatedbytheAVandICAmethods.Theleftpanelsin
Fig.7.Detectingandtrackingcellassemblyactivityusingindependentcomponentanalysis.(A)Left:Correlationmatrixofaspikematrix(notshown)with20neurons.Inthis example,3assemblieswerepresentinthenetwork(assembly1:neurons#11,#12,#13,#14;assembly2:neurons#14,#15,#16,#17;assembly3:neurons#18,#19,#20). Right:Associatedeigenvaluesandprincipalcomponents.Notethatthreeeigenvaluesaresignificant.(B)Assemblypatternsestimatedbyprincipalcomponents(left)and byindependentcomponents(right).Notethatassemblypatternsarebettersegregatedinthelattercase,i.e.,eachassemblypatternhaslargeweightsforitscorresponding members.(C)Representativetimeintervalofaspikematrix(top)andassemblyactivitytimecourseestimatedbyprincipalcomponentanalysis(PCA)andindependent componentanalysis(ICA)(bottom).Differentcolorsrepresentprojectionsobtainedusingdifferentassemblypatterns(asbefore,projectorsaredefinedbytheouterproduct ofassemblypatterns).NotethatthebluetraceinthePCAframeworkpeaksforactivationsofbothassemblies1and2.Ontheotherhand,assemblyactivityestimatedbyICA properlysegregatesthethreeassemblies.(Forinterpretationofthereferencestocolorinthisfigurelegend,thereaderisreferredtothewebversionofthearticle.)
in Fig.8E);again, notice lowercorrelations for theAV and ICA methods.
Fig.9showsa casein whichtheAV methodfails. Thespike matrix wassimulated as in the last example but witha slight differencein assembly composition: neuron #31 wasremoved fromassembly6,andthusthisassembly hadnoexclusive neu-ron(Fig.9A).Thecorrectnumberofassembliesisstilldetectedby theanalysisoftheeigenvaluesofthecorrelationmatrix(Fig.9B,C).
Theassemblypatternsestimatedbyallthreemethodsareshownin
Fig.9.PCA,ICAandAVmethodperformanceforcellassemblieswithnoexclusiveneurons.40neuronsweresimulatedasinFig.8.(A)Simulatedcellassemblies.Same asFig.8,exceptthatneuron#31doesnotpertaintoassembly6,whichconsequentlyhasnoexclusiveneuron(thatis,allneuronsinassembly6participateinatleastone otherassembly).(B)Correlationmatrix.(C)Eigenvaluedistribution.(D)Assemblypatternsestimatedbyeachmethod.NotethatforthiscasetheAVframeworkdoesnotfind assembly6.(E)SameasFig.8E.(F)SameasFig.8F.NotethattheAVmethoddoesnotproperlytracktheactivityofassembly6,whichisestimatedasamixtureofmultiple assemblies.(Forinterpretationofthereferencestocolorinthisfigurelegend,thereaderisreferredtothewebversionofthearticle.)
notethatwhiletheactivitiesofthefirstfiveassembliesarewell estimated,theactivityofthesixthassemblyismostlyamixture ofthethirdandthefifthcellassemblies(leftpanel),ascanalso beseenfromthecorrelationcoefficientsshownintherightpanel.
Finally,noticethat,asinFig.8,theICAmethodstillprovidesagood estimationforallcellassemblies.
Fig.10.ApplicationoftheICA-basedframeworktorealisticsimulations.Eachneuronofthespikematrixwascreatedfromacircularshiftofactualspiketimesofahippocampal neuron(sameprocedureasinFig.3C).Twocellassembliesweresimulatedbyincludingcommonspikestoassemblymembers,whichweredrawnfromindependentPoisson processesforeachassembly(meanrate:2Hz).Assembly1wascomposedbyneurons#9,#13,#15and#16;assembly2byneurons#6,#13,#14and#16(notice50%of overlapbetweenassemblies).Topleftpanelshowsatimeintervalofthespikematrix;circlesmarkco-firingofassemblymembers.Rightpanelshowsassemblypatterns extractedbytheICA-basedframework.Bottompanelshowsestimatedtimecourseofassemblyactivitycomputedfromtheassemblypatterns.EventsofthePoissonprocesses usedtogenerateassemblyactivationsareindicatedbycoloreddots.(Forinterpretationofthereferencestocolorinthisfigurelegend,thereaderisreferredtotheweb versionofthearticle.)
actualspiketrainsasinFig.3C.Inordertosimulateacellassembly, commonspiketimesgeneratedbyaPoissonprocesswithmeanrate of0.02spikes/bin(2Hz)wereaddedtothespiketrainsofagroupof neurons.Wesimulatedtwooverlappingcellsassemblies: assem-bly1,composedbyneurons#6,#13,#14and#16;andassembly 2,composedbyneurons#9,#13,#15and#16.Accordingly,the ICA-basedmethodextractedtwo assemblypatterns,which cor-respondedtotheprogrammedcellassemblies(Fig.10topright panel).Weshowarepresentativetimeintervalofthespikematrix inthetopleftpanelofFig.10.Dashedcirclesshowco-activationsof assemblymembers.Thebottompanelshowsestimatedassembly activitiesalongwithcoloreddotsthatindicateeventsofthe Pois-sonprocessesusedtogenerateassemblyactivations.Notethatthe timecoursesofassemblyactivitiesestimatedbytheICAmethod peakaccordingly.
3. Realdataapplications
In this section we analyze spike trains of 19 single-units recordedfromtheCA1regionofthehippocampusofafreely mov-ingratexploringanopenfield.Thedatawasdownloadedfrom theCollaborativeResearchinComputationalNeuroscience(CRCN) webpage(http://crcns.org/).Detailedinformation onrecordings, behaviorandsurgerycanbefoundinMizusekietal.(2009).The spikematrixwasconstructedusing10-msbins.Toestimatethe numberofcellassemblies,theeigenvaluesofthecorrelationmatrix were compared to the theoretical threshold derived from the Marˇcenko–Pasturdistribution.Assemblypatternswereextracted fromthespikematrix usingthemodified ICA-basedframework described above. We here further adapted this framework by increasingitstimeresolution.Sinceneuronalfiringcanoccurin differentbinsevenwhenspikesareseparatedbyafew millisec-onds,weestimatedthetimecourseofassemblyactivitybydirectly applyingtheprojectoroperatorstospiketrainsaftersmoothing themwithaGaussiankernel(maximumvalue=1,standard devia-tion=12ms).Inthisframework,therefore,assemblyactivitiescan
becomputedwiththesametimeresolutionasthelocalfield poten-tial(LFP),andcouplingbetweenthesesignalscanbeevaluated.
Atimeintervalofthespikerasterplotoftheneuronal popu-lationisshowninthetopleftpanelofFig.11A.Therightpanels showthreeassemblypatternsextractedfromtheassociatedspike matrix.Neuronswithlargeweightsinasamepatternaredisplayed withsamecolor.Estimatedassemblyactivitiesareshowninthe plotunderneaththerasterplot.Noticethatonlytheblueassembly isactiveinthedepictedperiod,andthatassemblyactivitypeaks whenmostofitsneuronsareco-active;incontrast,isolatedfiring ofthesameneuronsdoesnotaffectassemblyactivity.Theongoing LFPisshowninthebottompanel.Examplesfromthesame recor-dingsessioninwhichthemagentaandredassembliesareactiveare showninSupplementaryFig.1.
Weusedstandardanalysistechniquestostudytheactivityof CA1cellassembliesidentifiedbythisframework.Althoughitis usu-allyassumedthatneuronswithhigherfiringprobabilityatthesame phaseofanongoingoscillationarepartofthesamecell assem-bly,non-overlappingassemblieswithsamephasepreferencehas beenpreviouslyshownbyHarrisetal.(2003).Inaccordancewith thisresult,herewealsoobservedthatindependentassembliescan havesimilarphasepreferences.Fig.11Bshowstheautocorrelation ofthethreeassemblieshighlightedinFig.11A alongwiththeir correspondingtheta-phasedistributionsofassemblyactivations. Theta-phasedistributions wereobtainedby(1)filteringtheLFP intothethetarange(6–10Hz),(2)computingtheinstantaneous thetaphasesusingtheHilberttransform,(3)localizingthephases associatedwiththepeaksofassemblyactivity,and(4)expressing thephasesbymeansofacircularhistogram.Noticethattheblue andmagentaassemblieshavesimilarpreferredphase,whilethered assemblywasmostactiveinadifferentthetaphase.Allassemblies weresignificantlycoupledtoongoingthetaoscillations(Rayleigh test,p<10−6).
2 4 6 8 10 12 14 16 18 Neuron # 0 40 80
Assembly activity (z)
814.3 814.5 814.7 814.9 815.1
−2 0 2
Time (s)
Amplitude (z)
0 0.5 1 0 0.5 1
Assembly template weight
0 0.5 1
A
B
100 200 5 15 30 210 60 240 90 270 120 300 150 330 180 0 20 60 0.05 0.15 0.25 Linear correlationC
0.05 0.15 0.25 Linear correlation 30 210 60 240 90 270 120 300 150 330 180 0−0.5 −0.3 −0.1 0.1 0.3 0.5
Lag (s) 0.05 0.15 0.25 Linear correlation 30 210 60 240 90 270 120 300 150 330 180 0
Theta phase histogram
25 50 50 100 Inactive Active 0 0.1 0.2 0.3 0.4 0.5 0.6 0.7
Spike−theta phase coherence
30 210 60 240 90 270 120 300 150 330 180 0 30 210 60 240 90 270 120 300 150 330 180 0 Assembly state Active Inactive
Fig.11.Realdataapplications.(A)Top-leftpanelshowsatimeintervalofthespikerasterplotof19single-unitsrecordedfromthehippocampalCA1pyramidallayer. Top-rightpanelsshowthreeassemblypatternsdetectedbytheICA-basedmethod.Theneuronswithlargestweightsineachassemblywerecolor-coded.Estimatedassembly activitiesareshownbelowtherasterplot.Thebottompanelshowstheongoinglocalfieldpotential(LFP).AssemblyactivitiesandLFParez-scored.Notethattheco-activation oftheblueneuronsisindicatedbythepeaksofthecorrespondingassemblyactivity.(B)LeftpanelsshowautocorrelationsofthesamecellassembliesasinA.Rightpanels showthetheta-phasehistogramofassemblyactivations.Noteclearcouplingbetweenassemblyactivityandhippocampalthetaoscillations.(C)Leftpanelsshowthetheta phasedistributionofspikesforanassemblyneuroninside(bottom)andoutside(top)assemblyactivations.Rightpanelshowsmeanspike-thetaphasecoherenceofassembly neuronswhenthecellassemblywasinactiveoractive(blackcircle;errorbarsdenotestandarddeviation).Individualcasesareshowningray.(Forinterpretationofthe referencestocolorinthisfigurelegend,thereaderisreferredtothewebversionofthearticle.)
asassemblyactivityaboveitsmean+2standarddeviations).The remainingspikeswereusedtoconstructtheseconddistribution.A representativeexampleisshowninFig.11C:thebottomleftpanel showsthedistributionofspikephasesduringassemblyactivations, whereasthetopleftpanelshowsthephasedistributionforspikes occurring when the cell assembly was inactive. Note that the neuroninthisexampleis stronglycoupledtothethetarhythm
when its assembly is active. To compute a group result, for eachassembly neuronwecalculatedthespike-phasecoherence inside and outsideassembly activations. Spike-phasecoherence wasdefinedasthelengthofthemeanphasoreiϕ,whereisa
each case and bars indicate standard deviations. These results showthatneuronscouplemorestronglytothethetarhythmwhen firing in synchrony with other assembly members (p=0.0039, Wilcoxonranksumtest).
4. Discussion
Recentadvanceshaveopenedthepossibilityoftesting influen-tialtheoriesonnetworkfunctioninganditsrelationtobehaviorand memory.Herewereviewedthreelinearmethodsforcomputing cellassemblyactivity.WebeganbyintroducingtheoriginalPCA approach,whichwasthefirstemployedtotrackcellassemblies (Nicolelisetal.,1995),andisstillusefulnowadaysingenerating insightsaboutorganizedspikingactivity(Benchenaneetal.,2010; Peyracheetal.,2009).Next,we showedthat assemblypatterns estimatedbyPCshaveimportantlimitationsthatcanbeovercome theAVframework(Lopes-dos-Santosetal.,2011),whichidentifies cellassembliesbasedoncorrelationpatternswithinthesubspace spannedbythesignificantPCs.Finally,wepresentedamodified versionof a previously described ICAapproach (Laubach et al., 1999),whichincorporatesthestatisticalthresholdprovidedbythe Marˇcenko–Pasturdistribution.Weshowedthatthismethod pro-videsevenmorerobustestimatesofassemblypatternsthantheAV method.
Thelargeinterestinthisfieldledtothedevelopmentof analyti-caltoolsabletoidentifyhigh-ordercorrelationsthatcanpotentially replacepair-wiseanalyses(StevensonandKording,2011). How-ever,severalmethodscanonlybeappliedtosmallnetworksdueto combinatorialexplosion(Bergeretal.,2010;Grunetal.,2002;Tetko
andVilla,2001).Inordertoovercomethisproblem,someauthors haveproposedmethodologiesthatdetecthigh-ordercorrelations ignoringhowcellsareinvolvedinthecoalitions(Louisetal.,2010; Staudeetal.,2010a,b).Themethodsreviewedherecanbeapplied tolargeneuronal populations,andneuronal activityisassessed asawholethroughtheuseofeigenvalueanalysis.Additionally, theMarˇcenko–Pasturdistributionopens thepossibilityofusing ananalyticalandreliablestatisticsinsteadofsurrogatemethods employedinpreviousframeworks(Abeles,2009;AbelesandGat, 2001;AbelesandGerstein, 1988;Humphries,2011; Maldonado etal.,2008;Shmieletal.,2006).Inadditiontobeing computation-allydemanding,aprobleminherenttotheuseofsurrogatesisthe factthatthereisnoconsensusaboutwhichstatisticalproperties shouldbepreservedinthesecontroldata(Bergeretal.,2010;Grun, 2009).Forexample,wehaveshownherethatsurrogatemethods that preserveISI counts and auto-correlationsprovidedifferent thresholdsforstatisticalsignificancethanlessconservative shuf-flings(Fig.3C).
We note that although ICA assumesa linear model for cell assemblies,it employsnonlinearequationsin ordertoquantify Gaussianity,whichcanbegreatlyoptimizedbythefastICA algo-rithm (Hyvarinen and Oja, 1997). In fact, while the ICA-based frameworkismorecomputationallydemandingthanthePCAand AVmethods,itisstillfasterthanmostnonlinearalgorithms.In gen-eral,frameworksemployingmorecomplexmathematicsrequire extensivedatacrunchingthatoftenyieldresultsdifficultto inter-pretbynon-specializedresearchers.Themethodsstudiedhereare intuitiveandgenerate resultseasy visualizeinraw data,which shouldfavortheircomprehensionandbroadusebythescientific community.
Noneofrevisedmethodsisoptimal,andthereisroomfor fur-therimprovements.Forexample,ICAcannotfindassembliesifthey followaGaussiandistribution.Moreover,non-linearspike correla-tionsmayproducespuriousresultsinassemblydetectionmethods thatdependonPCA.Roughlyspeaking,whenthescatterplotof tworandomvariableshasacurvedshape,theeigenvalueanalysis mayrevealtwodimensionswithlargevariance.Byconsequence, PCA-basedmethodswouldfalselyidentifytwoassembliesinthe network,whileonlyonepairofneuronsiscorrelated.Itshouldbe notedthatothermethods,suchastheonedescribedinHumphries (2011),canbeadaptedtoothermeasuresofspiketrainsimilarity besideslinearcorrelations.
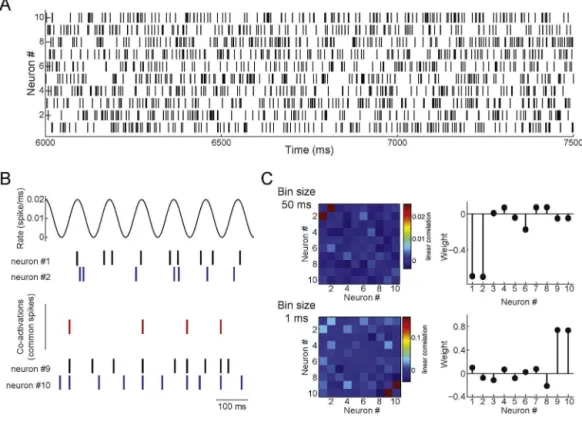
Itisalsorelevanttonotethatthebinsizeusedtocreatethespike matrix(Fig.1)definesthetimescaleofthedetectedassemblies,and thusdifferentbinsizescanyielddifferentresults.Weillustratethis possibilityinFig.12.Inthisexample,neuronsinassembly1fireata Poissonratedefinedbya10-Hzsinusoid(Fig.12Btop),while neu-ronsinassembly2firesynchronousspikesbasedontherealizations ofaPoissonprocess,despitealsoemittingindependentrandom spikesoutsideassemblyactivations(Fig.12Bbottom).Usinga 1-msbinsizetoconstructthespikematrixleadstothedetectionof assembly2(Fig.12Cbottom),whichneuronsspikeinprecise syn-chrony;assembly1isnotdetectedbecauseofthejitterinthespike timesofitsneurons.Ontheotherhand,employinga50-msbinsize leadstotheexclusivedetectionofassembly1(Fig.12Ctop),since atthistimescaleassembly1neuronsareco-activeandthe ran-domspikesofassembly2neuronsoccurringwhentheassembly isnotactivemaskassembly2activations.Thus,theextracted co-activationpatternshaveatimescaledefinedbythebinsize,which shouldbeconsideredwheninterpretingresults.
Finally, one should notethat thereviewed methods do not disambiguatebetweenstimulus-drivenandinternallygenerated spikecorrelations.Forinstance,spikecorrelationscanbedetected whenneuronshavesimilartuningcurves,irrespectiveofwhether theyare wired togetheror not. Thus, a pair of CA1 pyramidal cellswithoverlappingplacefieldscanbepotentiallyidentifiedas composinganassembly dependingonthe timescale (bin size) employedintheanalysis.However,wenotethatthisfeatureis inherenttothedefinitionofacellassembly,whichisusuallytaken asagroupofcellsthatfiretogether(andcollectivelyrepresentan object,asensation,anaction,etc.),independentlyofwhatcauses thecorrelatedfiring.Inourview,whetherneuronspresenting cor-relatedactivityduetocommonsensoryinputsshouldornotbe consideredacellassemblyisamatterofdefinition.
5. Conclusion
Linearmethodsarecomputationallylowdemanding,andyet quiteefficientfortrackingcellassemblyactivity.Hebb’sseminal workcomprises oneofthemostinfluential theoriesinmodern neuroscience.Yet,todateonlyfewstudieshaveaddressedHebb’s ideasatthesystemslevel.Wehopethatthemethodsreviewed herecanleadtoaproperestimationofco-activationpatternsand helpansweringwhethercellassemblieshaveanyfunctionalrole, asoriginallyenvisionedbyHebb.
Acknowledgements
SupportedbyConselhoNacionaldeDesenvolvimentoCientífico eTecnológico(CNPq),Coordenac¸ãodeAperfeic¸oamentodePessoal deNívelSuperior(CAPES),andFundac¸ãodeApoioàPesquisado EstadodoRioGrandedoNorte(FAPERN).WethanktheBuzsáki labformakinginvivoCA1recordingspubliclyavailablethrough
(http://crcns.org/),adatasharingwebsitefundedbytheNational ScienceFoundation.WealsothankSergioConde-Ocazionez,Enio AguiarandAdrienPeyracheforhelpfuldiscussions.Theauthors declarenocompetingfinancialinterests.
AppendixA. Supplementarydata
Supplementarydataassociatedwiththisarticlecanbefound, in the online version, at http://dx.doi.org/10.1016/j.jneumeth. 2013.04.010.
References
AbelesM.SynfireChains2009,http://www.scholarpedia.org/article/Synfirechains
AbelesM,GatI.Detectingprecisefiringsequencesinexperimentaldata.JNeurosci Methods2001;107:141–54.
AbelesM,GersteinGL. Detectingspatiotemporalfirigingpatternsamog simulta-neouslyrecordedsingleneurons.JNeurophysiol1988;60:909–24.
AdrianED,ZottermanY. Theimpulsesproducedbysensorynerve-endingsPartII. Theresponseofasingleend-organ.JPhysiol(Lond)1926;61:151–71.
ArabzadehE,PanzeriS,DiamondM.Whiskervibrationinformationcarriedbyrat barrelcortexneurons.JNeurosci2004;24:6011–20.
BenchenaneK, PeyracheA, KhamassiM,TierneyPL, GioanniY, BattagliaFP, etal. CoherentThetaoscillationsandreorganizationofspiketiminginthe hippocampal-prefrontalnetworkuponlearning.Neuron2010;66:921–36.
BergerD,BorgeltC,LouisS,MorrisonA,GrünS.Efficientidentificationofassembly neuronswithinmassivelyparallelspiketrains.ComputIntelNeurosci2010:18.
BiroliG,BouchaudJP,PottersM. Onthetopeigenvalueofheavy-tailedrandom matrices.EurophysLett2007;78:5.
Buzsaki G. Large-scale recording of neuronal ensembles. Nat Neurosci 2004;7:446–51.
ChapinJK,NicolelisMAL. Principalcomponentanalysisofneuronalensemble activityrevealsmultidimensionalsomatosensoryrepresentations.JNeurosci Methods1999;94:121–40.
ComonP. Independent componentanalsysis, a newconcept? SignalProcess 1994;36:287–314.
GanselKS,SingerW.Detectingmultineuronaltemporalpatternsinparallelspike trains.FrontNeuroinform2012:6.
GrunS.Data-drivensignificanceestimationforprecisespikecorrelation.J Neuro-physiol2009;101:1126–40.
GrunS,DiesmannM,AertsenA. Unitaryeventsinmultiplesingle-neuronspiking activity:1detectionandsignificance.NeuralComput2002;14:43–80.
HarrisKD,CsicsvariJ,HiraseH,DragoiG,BuzsakiG.Organizationofcellassemblies inthehippocampus.Nature2003;424:552–6.
HebbDO.Theorganizationofbehaviour:aneuropsychologicaltheory.NewYork: PsychologyPress;1949.
HubelDH,WieselTN.Receptivefieldsofsingleneuronesinthecat’sstriatecortex. JPhysiol(Lond)1959;148:574–91.
HumphriesMD. Spike-traincommunitiesfindinggroupsofsimilarspiketrains.J Neurosci2011.
HyvarinenA. Fastandrobustfixed-pointalgorithmsforindependentcomponent analysis.IEEETransNeuralNetworks1999;10:626–34.
HyvarinenA,OjaE.Afastfixed-pointalgorithmforindependentcomponent anal-ysis.NeuralComput1997;9:1483–92.
HyvarinenA,OjaE.Independentcomponentanalysis:algorithmsandapplications. NeuralNetworks2000;13:411–30.
JuttenC,HeraultJ. Blindseparationofsources,partI:anadaptivealgorithmbased onneuromimeticarchitecture.SignalProcess1991;24:1–10.
LaubachM,ShulerM,NicolelisM.Independentcomponentanalysesforquantifying neuronalensembleinteractions.JNeurosciMethods1999;94:141–54.
LaubachM,WessbergJ,NicolelisMAL.Corticalensembleactivityincreasingly pre-dictsbehaviouroutcomesduringlearningofamotortask.Nature2000:405.
LeeAK,WilsonMA. Memoryofsequentialexperienceinthehippocampusduring slowwavesleep.Neuron2002;36:1183–94.
Lopes-dos-SantosV,Conde-OcazionezS,NicolelisM,RibeiroS,TortA. Neuronal assemblydetectionandcellmembershipspecificationbyprincipalcomponent analysis.PLoSOne2011;6:e20996.
LouieK,WilsonM.Temporallystructuredreplayofawakehippocampalensemble activityduringrapideyemovementsleep.Neuron2001;29:145–56.
LouisS,BorgeltC,GrunS.Complexitydistributionasameasureforassemblysize andtemporalprecision.NeuralNetworks2010;23:705–12.
MaldonadoP,BabulC,SingerW,RodriguezE,BergerD,GrunS.Synchronizationof neuronalresponsesinprimaryvisualcortexofmonkeysviewingnaturalimages. JNeurophysiol2008;100:1523–32.
MarˇcenkoVA,PasturLA.Distributionofeigenvaluesforsomesetsofrandom matri-ces.MathUSSR-Sbornik1967;1:457–83.
NicolelisMAL,BaccalaLA,LinRCS,ChapinJK. Sensorimotorencodingby syn-chronousneuralensembleactivityatmultiplelevelsofthesomatosensory system.Science1995;268:1353–8.
OkeefeJ,DostrovsJ. Hippocampusasaspatialmap–preliminaryevidencefrom unitactivityinfreely-movingrat.BrainRes1971;34:171–5.
PerrettD,RollsE,CaanW. Visualneuronesresponsivetofacesinthemonkey temporalcortex.ExpBrainRes1982;47:329–42.
PeyracheA,KhamassiM,BenchenaneK,WienerSI,BattagliaFP. Replayof rule-learningrelated neuralpatternsintheprefrontalcortexduring sleep.Nat Neurosci2009;12(919),U143.
PeyracheA,BenchenaneK,KhamassiM,WienerSI,BattagliaFP.Principal compo-nentanalysisofensemblerecordingsrevealscellassembliesathightemporal resolution.JComputNeurosci2010;29:309–25.
PlerouV,GopikrishnanP,RosenowB,AmaralLAN,GuhrT,StanleyHE. Random matrixapproachtocrosscorrelationsinfinancialdata.PhysRevE2002:65.
QuirogaRQ,PanzeriS.Extractinginformationfromneuronalpopulations: informa-tiontheoryanddecodingapproaches.NatRevNeurosci2009;10:173–85.
RibeiroS,GervasoniD,SoaresES,ZhouY,LinSC,PantojaJ,etal.Long-lasting novelty-inducedneuronalreverberationduringslow-wavesleepinmultipleforebrain areas.PLoSBiol2004;2,126-37.
SebaP.RandommatrixanalysisofhumanEEGdata.PhysRevLett2003;91:4.
ShmielT,DroriR,ShmielO,Ben-ShaulY,NadasdyZ,ShemeshM,etal.Temporally precisecorticalfiringpatternsareassociatedwithdistinctactionsegments.J Neurophysiol2006;96,2645-52.
SiapasAG,LubenovEV,WilsonMA.Prefrontalphaselockingtohippocampaltheta oscillations.Neuron2005;46,141-51.
StaudeB,GrunS,RotterS.Higher-ordercorrelationsinnon-stationaryparallelspike trains:statisticalmodelingandinference.FrontComputNeurosci2010a:4.
StaudeB,RotterS,GrunS. CuBIC:cumulantbasedinferenceofhigher-order cor-relationsinmassivelyparallelspiketrains.JComputNeurosci2010b;29, 327-50.
StevensonIH,KordingKP. Howadvancesinneuralrecordingaffectdataanalysis. NatNeurosci2011;14:139–42.
TetkoIV,VillaAEP.Apatterngroupingalgorithmforanalysisofspatiotemporal pat-ternsinneuronalspiketrains,detectionofrepeatedpatterns.JNeurosciMethods 2001;105:1–14.
TracyCA,WidomH.Level-spacingdistributionsandtheairykernel.CommunMath Phys1994;159:151–74.