A Hybridized Artificial Neural Network and
Optimization Algorithms for the Diagnosis
Of Cardiac Arrhythmias
Ali Bahadorinia1, Ali Dolatabadi2 and Ahmad Hajipour3 1
Department of Electrical and Computer Engineering, Hakim Sabzevari University, Sabzevar, Iran
2 Department of Electrical and Computer Engineering, Hakim Sabzevari University, Sabzevar, Iran
3
Department of Electrical and Computer Engineering, Hakim Sabzevari University, Sabzevar, Iran
Abstract
In the recent years, the use of Intelligent Systems in Engineering Sciences, especially in the diagnosis of various diseases, is growing increasingly. In this paper, two intelligent methods for detecting cardiac arrhythmias based-on combination structure of artificial neural networks and the Optimization Algorithms are used. The optimization algorithms used in this study are Particle Swarm Optimization Algorithm and Genetic Algorithm, that have been used for optimization of weight coefficients and bias to minimize error. The results of implementing algorithms mentioned in reference data UCI from this method show a remarkable relative advantage of neural network based on PSO algorithm, with the Mean Squared Error and the Correct Classification Rate of 0.01204 and 85.36%, respectively.
Keywords: ECG arrhythmia, MLP neural network, Genetic
Algorithm, Particle Swarm Optimization
1. Introduction
The heart is one of the most important organs of the human body that is charged with the duty to regulate the flow and circulation. If the heart be removed of its natural order, the circulation is not done well. This would have serious risks for an individual. Therefore, proper and timeless diagnosis and medical care of these patients is very important. ECG is a signal that indicates the electrical activity of the heart muscle. The key components of the signal are: P wave, Complex QRS, T wave and U wave. Different parts of the signal are shown in Figure1. Any changes and distortion in the ECG signal such as changes in timing, amplitude, duration and rhythm of each of these waves can be indicative of a particular disease, called cardiac arrhythmia.
Fig.1 Structure of the ECG signal
signal, Fourier transform is not an appropriate transform for this type of signals, therefore, Wavelet Transform is used for the feature extraction [11,12]. After extracting the proper features of the Electrocardiography signals, it is necessary to use of one suitable classifier for detecting various arrhythmias of the heart. Several methods for the classification of cardiac arrhythmias have been proposed in the past decade. A kernel difference weighted k-nearest neighbor classifier for the detection of cardiac arrhythmia has been proposed in [13]. An Artificial immune identification system with fuzzy weighted pre-processing, designed for arrhythmia classification, also has been presented in [14]. Different types of neural network, utilized to identify cardiac arrhythmia and classification accuracies, have been also described in [15-18].
Generally, neural networks are the most successful usage of classifiers that have been widely used to categorize the various cardiac arrhythmias. The main objective of this study is the structure optimization of neural networks in order to decrease the detect errors in the network. A description on the data used in this study, along with data preprocessing and feature selection are presented in the second and third sections of this paper, respectively. Furthermore, a brief description on the artificial neural networks and the optimizedalgorithms used in this study are given in the two next sections, respectively. The evaluation criteria are summarized in the section six. In the section seven the performance and the efficiency of the proposed structure are compared with the classical method. Finally, the results are discussed in the section eight, followed by the conclusion and the suggestions for future works.
2. Database Representation
In the use of neural networks, is the basic problem of having information that the network is trained with it. And also some data is required for the obtained network testing in order to test the accuracy and integrity of the network. So in order to detect and classification cardiac arrhythmias, we use from the available data in the UCI database [19]. The data consists of 452 samples and 280 columns. The first 279 columns are related to characteristics of each person and the last column is the result of the tests such that states the type of person arrhythmias. And also the samples are categorized in 16 classes. Notable in this database is the numbers of samples with normal label have been placed in Class A, compared to some examples is very high and this imbalance may reduce the accuracy of the neural network. To resolve this issue, which has a higher frequency in the database 5 classes are selected and we review efficiency of the proposed methods on samples of these four classes. These classes are: Normal function, Right bundle branch block
(RBBB), Bradycardia and Ischemic changes. Fifth grade also refers to arrhythmias other than the above. Data used in this study, are 206 samples that to determine the number of training and test data, we consider three different modes as shown in the Table 1.
Table 1: Data Set Group Partitions
Data Set Training
% age
Testing % age
Training instances
Testing Instances
Dataset 1 (DS1)
60 40 124 82
Dataset 2 (DS2)
70 30 144 62
Dataset 3 (DS3)
80 20 165 41
3. Preprocessing
3.1 Data Normalization
Since the interval changes of features are not identical, characteristics of large amounts that do not necessarily mean they are more important in designing the classifiers have a greater impact on classification and the cost function and therefore, it is considered an adverse effect. To resolve this problem, the input data must be normalized .i.e. the data must be taken into the number range between zeros to one or between negative one to positive one. There are several methods for normalizing data for example, to locate the data in the interval between zero and one, can use from one convert.
Current Value Min Value New Value
Max Value Min Value
(1)
3.2
Dimensions Reduction and Feature Selection
Since the performance of each classification method depends to select the suitable features of the model, Apart from the features that do not contribute to the resolution of data, can increase classification accuracy. In this paper, to reduce the dimension of features has been used of Principal Components Analysis method. In the principal component analysis method, new coordinate axes are defined for data. So that the first axis is placed in a direction that maximum is the variance of the data. The second axis is perpendicular to the first axis and is considered in the direction that variance of the data is maximum. And so, the next axis perpendiculars to all previous axes are such that the variance of the data is in the maximum direction [20]. As mentioned previously, the feature vector for each sample included 279 samples, which14 components fell by using principal component analysis.
Artificial neural networks have been innovated by inspiring the human brain model. Use of artificial neural networks in the various sciences has grown increasingly due to the characteristics of artificial neural networks, such as learning capability generalize capability , high speed because of the parallel processing and the ability to model systems with complex and nonlinear input and output. One of the most widely used artificial neural networks is Multi Layer Perceptron neural networks [21]. This neural network consists of an input layer, one or more hidden layers and an output layer. Adjustment of neural network parameters such as the number of middle layers and number of neurons of each of these layers plays an important role in the network performance and achievement to the best solution. There are no precise criteria for determining the number of neurons in the middle layers, but it should be noted that the excessive increasing of number of neurons in the middle layer reduces the speed of convergence. While, excessive reduction in number of neurons, decrease also ability of the network analysis [22,23].
5. Optimization Algorithms
5.1 Genetic Algorithm (GA)
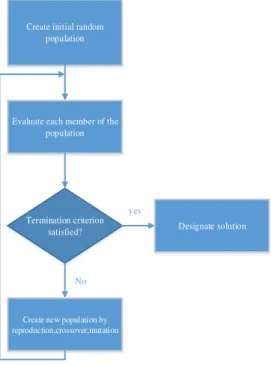
The basic idea of evolutionary algorithms in 1960 by was proposed by Richenberg, whose research was about the development strategies [24]. Later, his theories were studied by many researchers that cause to the design of genetic algorithms. In fact, the genetic algorithm is a computer search method based on optimization algorithms and is based on the structure of chromosomes and genes that was introduced in 1975 at the University of Michigan by John Holland and it was developed after him by a group of his students like Goldberg and Ann Arbor[25]. In this algorithm, at first the solution of the different problems is shown as the population of chromosomes and each chromosome represents a solution of the problem. The algorithm aim is to achieve optimal chromosomes through reproduction of the best chromosomes in each generation. Chromosomes are often displayed as a string of zero-one which every bit of this field can be a representative in a gene. A criterion for detection the optimal responses or evaluation the best chromosome should be selected, this measure is often as a mathematical function that is applied on the chromosomes and is called merit function or cost function. So this algorithm begins with the number of the initial population, each of them is called a chromosome. Then the numbers of the best chromosomes, based on the cost function of each, are selected as parents. After selection, comes to reproduce the selected chromosome. It is done by two integrates functions Cross Over and Mutation. In the integration phase, selected chromosomes
randomly are combined to produce new chromosomes for the next generation. In mutation phase, magnitude of some genes will change by accident, and then the cost function is calculated for each chromosome. To end, it can use of one of the ending criteria of algorithm such as achieve to a particular competence level, the maximum number of generation, maximum number of generations without changes in fitness or a combination of these criteria[26]. Flowchart of the genetic algorithm is shown in Figure2.
Fig. 2 Genetic algorithm flowchart
5.2 Particle Swarm Algorithm (PSO)
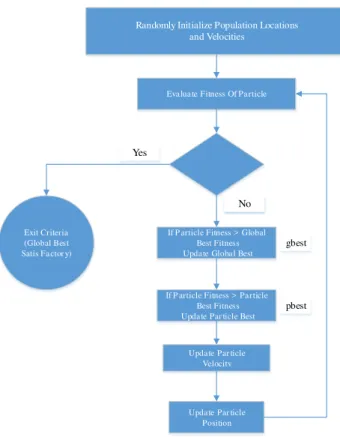
James Kennedy and Eberhart are the original owners of Particle Swarm algorithm idea [27]. This algorithm is derived from the observation of social behavior in birds and fish. Such as genetic algorithms, particle swarm optimization method also contains a population of solutions. But in this method, the solutions are attributed to particles, as solutions are attributed to individuals in the genetic algorithm. Thus, each particle is a representative of question's answer that moves in the space of question. Displacement of each particle in the search space is influenced by its experience and its neighbors; therefore position of the other particles, can affect on the quality of search a particle. The algorithm has been used in many fields of study, such as neural network training, dynamic economic problems and optimization of issues by many dependent factors [28]. Suppose that x and v, respectively are the position and velocity of each particle, the particle until it has reached to the top position is recognized with p-best and the best position of the best particle in the
Create initial random population
Evaluate each member of the population
Termination criterion satisfied?
Create new population by reproduction,crossover,mutation
Designate solution yes
whole group is recognized as g-best. Velocity of each particle is changed according to equation 2.
1 1 1 2 2
t t best t best t
v v c r p x c r g x
(2)
Where t is counting of the repetitions ,vt is particle velocity at t iteration, xt is position of the particle at t
iteration, ω is inertia weight, r1 and r2are also random
numbers with uniformly distribution between zero and one. c1 and c2 are two positive and constants coefficients, respectively are known Cognitive and social coefficients and are usually considered to be equal to 2 [28] . Appropriate selection of c1 andc2 values can increase the speed of convergence. In reference [29], an extensive study has been done on the cognitive and social coefficients related to PSO. The new position of each particle also is determined by the sum of the previous position and the new velocity with equation 3 [28].
1 1
t t t
x x v
(3)
Flowchart of the Particle swarm optimization (PSO) is shown in Figure3.
6. Performance Evaluation Methods
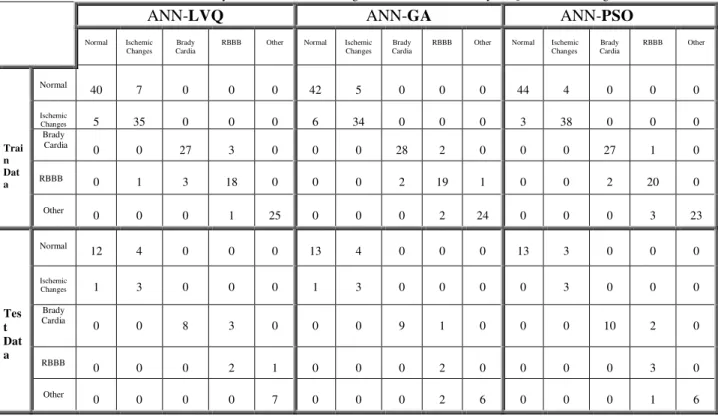
In order to assess the success of classifiers we use from 3 evaluation criterion. These criteria are Confusion Matrix, Correct Classification Rate and mean square error. As the first assessment criteria, we make up a square matrix in the size of classes number where the array ij indicates how many dates of my i class is placed in a j class. This matrix is called the Confusion Matrix. Best state occurs when the matrix is a diagonal matrix. Because it shows that no data of my i class are located in my j class and all of my data of my i class are located in their respective classes. Whatever it might be a diagonal matrix indicates higher performance of classifiers. We have 5 classes in the problem studied in this paper, so this matrix is a 5 × 5 matrix. The correct classification rate is also expressed as the second criteria of assessment like proportion of the number of the correct classifications to the total number of classifications. The third criteria of assessment performance are considered, the average sum of squared error between artificial neural networks outputs, outputs correspond to the inputs.
7. Experimental Results
In this section, at first the classical method of Levenberg – Marquardt algorithm is used to train the mlp neural network. Then, it will be used of two evolutionary
Randomly Initialize Population Locations and Velocities
Eva lua te Fitness Of Pa rticle
Exit Criteria (Global Best Satis Fa ctor y)
Yes
No
If P article Fitness > Global Best Fitness Upda te Globa l Best
Upda te Par ticle Velocitv
Upda te Par ticle Position
No
gbest
pbest If P article Fitness > Pa rticle
Best Fitness Upda te Par ticle Best
Fig. 3 Particle Swarm Optimization algorithm flowchart
optimization method of genetic algorithm and particle swarm algorithm to train the neural network and to determine its weights and biases. Finally, comparing the success rate and performance of these three different neural networks will be discussed. Table 7 also provides comparability our study (LVQ, GA and ANN-PSO) types classification accuracy and reliability obtained by some recent works [13-18].
7.1 First Experiment:
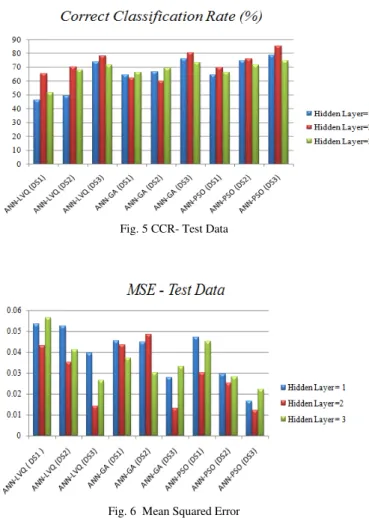
an artificial neural network trained by Levenberg-Marquardt algorithm.For this purpose, a feed forward neural network has been used. we have changed one to three numbers of hidden layers. The number of hidden layers neurons, experimental and trial and error were calculated. Activation function is 3 of the first layer of the sigmoid type and the fourth layer of linear. From Figure 5 and 6 it is obvious that, DS3 have provided better results on ANN-LVQ model with two numbers of hidden layers. The correct classification rate and mean squared error for test dataset DS3 of this type of neural networks, respectively is, 78.04 percent, 0.01423.
In this part, we will utilize Genetic algorithm as a training instrument for neural network. Although, there are many various plans for training ANNs utilizing GAs, the easiest is also the most commonly used. Consider the network revealed in Figure 4.
Fig. 4 Weights of neural networks as a chromosome
All of the weights in the network are joined to create one string. This string is then applied in the GA as a person in the population. Each string shows the weights of a total network. Continue the process has been previously described. Genetic algorithm parameters used in this paper are shown in Table 2.
Fitness function was proposed as
follows:
Ischemic Changes Brady Cardia RBBB Other
5
Normal
PC PC PC PC PC
fitness (4)
Where, PC is represents the percent of classes are
correctly classified.
Table2: The GA parameters used determine weight and bias value
Population size 350
Mutation operator, Pm 0.02
Crossover operator, Pc 0.7
Number of Generations 70
Selection type Tournament
Crossover type Double Point
From figure 5 and 6 it is obvious that, DS3 have provided better results on ANN-GA model with two numbers of hidden layers. The correct classification rate and mean squared error for test dataset DS3 of neural network trained by genetic algorithm, respectively is, 80.48 percent, 0.01301.
7.3
Third
Experiment:
Using particle swarm optimization algorithm for neural network learning.In this section, Particle Swarm Optimization is used to train feed forward neural network for improving the rate of convergence and learning process. All of the weights in
the neural network, Constitute a set of particles. In other words, When thePSO algorithm isutilized in improving weights of feed forward neural network, every particle represent a set of weights. The particle will move within the weight space trying to decrease learning error. The process has already been described. Network performance is also calculated using the Mean Square Error. Particle swarm algorithm parameters used in this paper are shown in Table 3.
Table3: The PSO parameters used determine weight and bias value
Particle size 135
Local Constant , c1 2
SocialConstant ,c2 2
Maximum Iteration 100
From figure 5 and 6 it is obvious that, DS3 have provided best performance on ANN-PSO model with two numbers of hidden layers.The correct classification rate and mean squared error for the test dataset DS3 of neural network trained by particle swarm optimization algorithm, respectively is, 85.365 percent 0.01204.
Fig. 5 CCR- Test Data
Details of the results related to the various neural networks for the test data and train data are shown in Tables 4-6 and also in Figures 5 and 6. The outcomes results states the relative superiority of neural network based on Particle Swarm algorithm upon other neural networks. Also, our experimental results proved that Neural network based on Particle Swarm algorithm has high accuracy comparing to other methods as shown in Table7.
Table 5: Correct Classification Rate of Neural networks trained using LVQ , GA and PSO for test
Table 6: Mean Squared Error of Neural networks trained using LVQ , GA and PSO for test DS3.
Table 4: The Confusion Matrix for ECG arrhythmias classification using Neural networks trained by LVQ , GA and PSO algorithm for test DS3.
ANN-
LVQ
ANN-
GA
ANN-
PSO
Normal Ischemic Changes
Brady Cardia
RBBB Other Normal Ischemic Changes
Brady Cardia
RBBB Other Normal Ischemic Changes
Brady Cardia
RBBB Other
Trai n Dat a
Normal
40 7 0 0 0 42 5 0 0 0 44 4 0 0 0
Ischemic
Changes 5 35 0 0 0 6 34 0 0 0 3 38 0 0 0
Brady Cardia
0 0 27 3 0 0 0 28 2 0 0 0 27 1 0
RBBB 0 1 3 18 0 0 0 2 19 1 0 0 2 20 0
Other
0 0 0 1 25 0 0 0 2 24 0 0 0 3 23
Tes t Dat a
Normal
12 4 0 0 0 13 4 0 0 0 13 3 0 0 0
Ischemic
Changes 1 3 0 0 0 1 3 0 0 0 0 3 0 0 0
Brady Cardia
0
0 8 3 0 0 0 9 1 0 0 0 10 2 0
RBBB
0 0 0 2 1 0 0 0 2 0 0 0 0 3 0
Other
0 0 0 0 7 0 0 0 2 6 0 0 0 1 6
Table7: Our Work (ANN-LVQ, ANN-GA and ANN-PSO Models) classification accuracy for ECG Arrhythmia Classification Problem With classification accuracies obtained by other methods
KDFW-KNN [13]
Fuzzy weighted AIRS [14]
HLVQ [15]
NEWFM [16] A novel pruning approach [17]
SVM with Gaussian Kernel [18]
Our works
ANN- LVQ ANN- GA ANN-PSO
70.66 80.71 76.92 81.32 68.47 76.1 78.04 % 80.48 % 85.36 %
MSE ANN-LVQ ANN-GA ANN-PSO
Train Data 0.006810 0.00531 0.00442
Test Data 0.014230 0.01301 0.01204
CCR inPercent ANN-LVQ ANN-GA ANN-PSO
Train Data 87.87 89.09 92.12
8. Conclusions and Recommendations
In this paper, the structure of artificial neural networks for the detection and classification of cardiac arrhythmias was used. Three different algorithms; a classical algorithm and two intelligent optimization algorithms, were applied on the training neural networks. The comparison between the results of Particle Swarm algorithm and the other two algorithms indicates relatively improvement in the learning neural network compared to the other algorithms in the classification implementation. The study also gives an improved result with respect to the average classification accuracy in comparison with the results of some other methods, presented in [13-18]. The other structures of neural networks such as RBF and SVM can be also used for the classification stage and can be continuously considered for the other neural networks. In addition to train the weights and biases of these types of networks by using Evolutionary Algorithms, for the best answer achievement the algorithms can be also used to detect the number of neurons of the first and the middle layer and to select the type of activation function.
References
[1] M. Kundu, M. Nasipuri, D.K. Basu, “Knowledge-based ECG interpretation: A critical review”, Pattern Recognition, Vol. 33, 2000, pp. 351-373.
[2] R. Hoekema, H. Uijen, A. v. Oosterom, “Geometrical aspects of the inter individual variability of multi lead ECG recordings”, IEEE Transactions on Biomedical Engineering, Vol. 48, 2001, pp. 551–559.
[3] Y. Kutlu, D. Kuntalp, “Feature extraction for ECG heart beats using higher order statistics of WPD coefficients”, Computer Methods and Programs in Biomedicine, Vol. 105, 2012, pp.257–267.
[4] T.H.Yeap, F. Johnson, and M. Rachniowski, “ECG beat classification by a neural network,” in Proceedings of the Twelfth Annual International Conference of the IEEE, Engineering Medicine and Biology Society, 1990, pp. 1457–1458.
[5] P. deChazal, R.B.Reilly, “Automatic classification of ECG beats using a waveform shape and hear beat interval features”, International Conference on Acoustics, Speech and Signal Processing, 2003, Vol.2, pp. 269-272.
[6] F. de. Chazal, R.B. Reilly, “A patient adapting heart beat classifier using ECG morphology and heartbeat interval features”, IEEE Transactions on Biomedical Engineering, Vol.53, 2006, pp.2535- 2543.
[7] Y. H. Hu, S. Palreddy, W. J. Tompkins, “A patient-adaptable ECG beat classifier using a mixture of experts approach”, IEEE Transactions on Biomedical Engineering, Vol.44, 1997, pp. 891–900.
[8] G.E.Oien, N.A.Bertelsen, T.Eftestol, J.H.Husoy, “ECG rhythm classification using artificial neural networks”,
IEEE Digital Signal Processing workshop proceeding, 1996, Vol.44, pp.514-517.
[9] D. Romberg, J. Langel, H. Theres, P. Kohlstrung , K. Bethge , K. Stangl , G. Baumann, “Correlation between SAECG and HRV parameters in individual patient after myocardial infarction, Computers in Cardiology”, IEEE conference, 1996, pp.321-323.
[10] K. Minami, H. Nakajima, and T. Toyoshima, “Real-time discrimination of ventricular tachy arrhythmia with Fourier- transform neural network”, IEEE Transactions on Biomedical Engineering, Vol. 46,1999, pp. 179–185. [11] O. T. Inan, L. Giovangrandi, and G. T.A. Kovacs, “Robust
neural network-based classification of premature ventricular contractions using wavelet transform and timing interval features”, IEEE Transactions on Biomedical Engineering, Vol.53, 2006, pp.2507- 2515.
[12] D. Cvetkovic, E. D. Ubeyli and I. Cosic, “Wavelet transform feature extraction from human PPG, ECG, and EEG signal responses to ELFPEMF exposures: A pilot study”, ELSEVIER, Digital Signal Processing, 2008, Vol.18, pp. 861-874.
[13] Zuo, W.M.; Lu, W.G.; Wang, K.Q.; Zhang, H., “Diagnosis of cardiac arrhythmia using kernel difference weighted KNN classifier", Computers in Cardiology, 2008, pp. 253- 256.
[14] K. Polat, S. Şahan, S. Güneş, A new method to medical diagnosis: Artificial immune recognition system (AIRS) with fuzzy weighted pre-processing and application to ECG arrhythmia, Expert Systems with Applications, Vol. 31, August 2006, Issue 2, pp. 264-269.
[15] Alaa M. Elsayad, “Classification of ECG arrhythmia Using Learning Vector Quantization Neural Networks”, International Conference on Computer Engineering & Systems, 14-16 Dec. 2009, pp. 139 – 144.
[16] S.H Lee, J.K Uhm, and Joon S. Lim, “Extracting Input Features and Fuzzy Rules for Detecting ECG Arrhythmia Based on NEWFM”, International Conference on Intelligent and Advanced Systems, Division of Software, Kyung won University, Korea.
[17] A. Mirza Mahmood and M. Rao Kuppa, “A novel pruning approach using expert knowledge for data-specific pruning”, Engineering with Computers, vol. 28, 2012, pp. 21-30.
[18] A. Uyar, Gurgen F., "Arrhythmia Classification Using Serial Fusion of Support Vector Machines and Logistic Regression," Intelligent Data Acquisition and Advanced Computing Systems: Technology and Applications. IDAACS 2007. 4th IEEE Workshop on,2007, pp.560-565. [19] A. Frank and A. Asuncion, “UCI machine learning
repository”, 2010. [Online]. Available: http://archive.ics.uci.edu/ml.
[20] Yu, S.-N., & Chou, K-T, “Integration of independent component analysis and neural networks for ECG beat classification”, Expert Systems with Applications, vol. 34, 2008, pp. 2841-2846.
[21] S. Haykin, Neural Networks and Learning Machines ,third Edition, Prentice Hall, New York,NY,2009.
[23] Z.H.Che, “PSO-based back-propagation artificial neural network for product and mold cost estimation of plastic injection molding”, Computers and Industrial Engineering, Vol. 58, 2010, pp. 625-637.
[24] R.L. Haupt and E. Haupt, Practical Genetic Algorithms, Second Edition, John Wiley and Sons, New York, 2004. [25] S.N. Sivanandam and S.N. Deepa, Introduction to Genetic
Algorithms, Springer-Berlin Heidelberg New York, ISBN 978-3-540-73189-4, 2008.
[26] D.E. Goldberg, Genetic Algorithm in search, optimization and machine learning, New York: Addison –Wesley, 1989. [27] J. Kennedy and R. C. Eberhart, "Particle Swarm Optimization", Proceedings of IEEE International Conference on Neural Networks, 1995, Vol. 4, PP. 1942-1948.
[28] E. Onwunalu, J. Durlofsky, “Application of a particle swarm optimization algorithm for determining optimum well location and type”, Computational Geosciences, Vol. 14, 2010, pp.183–198.