BGD
8, 9943–9976, 2011Free and protected soil organic carbon dynamics respond
S. Meyer et al.
Title Page
Abstract Introduction
Conclusions References
Tables Figures
◭ ◮
◭ ◮
Back Close
Full Screen / Esc
Printer-friendly Version Interactive Discussion
Discussion
P
a
per
|
Dis
cussion
P
a
per
|
Discussion
P
a
per
|
Discussio
n
P
a
per
|
Biogeosciences Discuss., 8, 9943–9976, 2011 www.biogeosciences-discuss.net/8/9943/2011/ doi:10.5194/bgd-8-9943-2011
© Author(s) 2011. CC Attribution 3.0 License.
Biogeosciences Discussions
This discussion paper is/has been under review for the journal Biogeosciences (BG). Please refer to the corresponding final paper in BG if available.
Free and protected soil organic carbon
dynamics respond di
ff
erently to
abandonment of mountain grassland
S. Meyer1, J. Leifeld1, M. Bahn2, and J. Fuhrer1
1
Agroscope Research Station Reckenholz-T ¨anikon ART, Air Pollution/Climate Group, Reckenholzstrasse 191, 8046 Z ¨urich, Switzerland
2
Institute of Ecology, University of Innsbruck, Sternwartestrasse 15, 6020 Innsbruck, Austria
Received: 24 August 2011 – Accepted: 15 September 2011 – Published: 6 October 2011
Correspondence to: J. Leifeld ([email protected])
BGD
8, 9943–9976, 2011Free and protected soil organic carbon dynamics respond
S. Meyer et al.
Title Page
Abstract Introduction
Conclusions References
Tables Figures
◭ ◮
◭ ◮
Back Close
Full Screen / Esc
Printer-friendly Version Interactive Discussion
Discussion
P
a
per
|
Dis
cussion
P
a
per
|
Discussion
P
a
per
|
Discussio
n
P
a
per
|
Abstract
Land-use change (LUC) and management are among the major driving forces of soil carbon (C) storage. Abandonment of mountain grassland promotes accumulation of aboveground biomass and litter, but related responses of soil organic matter (SOM) dynamics are uncertain. To determine SOM-C turnover we sampled 0–10 cm of soils
5
along land-use gradients (hay meadows, grazed pastures and abandoned grasslands) in the European Alps varying in management intensity at Stubai Valley (MAT: 3◦C, P: 1097 mm) in Austria and Matsch Valley (MAT: 6.6◦C, P: 527 mm) in Italy. We de-termined C input and decomposition rates of labile water-floatable and free particulate organic matter (wPOM, fPOM<1.6 g cm−3) and stable aggregate-occluded particulate
10
and mineral-associated organic matter (oPOM<1.6 g cm−3, mOM>1.6 g cm−3) using bomb radiocarbon.
At both sites C turnover decreased from w- and fPOM (4–8 yr) to oPOM (76–142 yr) to mOM (142–250 yr). Following abandonment C input pathways shifted from root-derived towards litter-root-derived C. The decomposition rates of labile wPOM-C declined
15
with a decrease in litter quality, while both C input and C decomposition rates of labile fPOM increased with an increase in litter quantity. In contrast, protected stable SOM-C (oPOM-C, mOM-C) dynamics remained relatively unaffected by grassland abandon-ment. Carbon accumulation rates of labile POM fractions decreased strongly with time since LUC (10, 25 and 36 yr). For wPOM-C, for example, it decreased from 7.45±0.99
20
to 2.18±1.06 to 0.82±0.21 g C m−2yr−1. At both sites, most C was sequestered in the first years after LUC and labile SOM fractions reached new steady state within 20–40 yr.
We concluded that w-and fPOM-C vs. oPOM-C dynamics respond differently to grassland management change and thus POM does not represent a homogeneous
25
BGD
8, 9943–9976, 2011Free and protected soil organic carbon dynamics respond
S. Meyer et al.
Title Page
Abstract Introduction
Conclusions References
Tables Figures
◭ ◮
◭ ◮
Back Close
Full Screen / Esc
Printer-friendly Version Interactive Discussion
Discussion
P
a
per
|
Dis
cussion
P
a
per
|
Discussion
P
a
per
|
Discussio
n
P
a
per
|
1 Introduction
The potential for carbon (C) storage is high in grassland soils and both management type and intensity influence the efficiency of C storage (Conant et al., 2001; Post and Kwon, 2000). Throughout the European Alps ongoing socio-economic changes have strongly influenced land-use and management intensity (Cernusca et al., 1999;
5
Tappeiner et al., 2008) which in turn induced fundamental changes in ecosystem struc-ture and functioning (Tasser et al., 2005). While management abandonment has led to an accumulation of live and dead aboveground plant biomass in mountain grass-lands (Tasser and Tappeiner, 2002; Tasser et al., 2005; Gamper et al., 2007) related responses of soil organic matter (SOM) are contradictory (Rubatscher, 2008;
Martin-10
sen, 2010; Leifeld and Fuhrer, 2009; Steffens et al., 2011), predominately because of differences in management intensity, such as mowing and grazing frequencies, and time since land-use change (LUC). Related effects on rates of soil C changes are still uncertain.
Litter decomposition studies along gradients of grassland management type and
in-15
tensity showed that with abandonment reduced litter quality, expressed as wide C/N ratio, high lignin and low nutrient content, and higher proportion of fungal biomass re-tards decomposition, thereby inducing accumulation of relatively undecomposed plant litter (Zeller et al., 2001; Gamper et al., 2007). Schmitt et al. (2010) monitored net ecosystem exchange of CO2, gross primary productivity and ecosystem respiration 20
rates in subalpine grasslands and found that all measures decreased with decreas-ing land-use intensity and concluded that abandonment leads to reduced productivity and C exchange between soil and atmosphere. Decomposition and respiration studies allow to analyze C dynamics on hourly to monthly basis and thus predominately quan-tify the short-term C turnover. Both methods integrate over SOM fractions varying in
25
BGD
8, 9943–9976, 2011Free and protected soil organic carbon dynamics respond
S. Meyer et al.
Title Page
Abstract Introduction
Conclusions References
Tables Figures
◭ ◮
◭ ◮
Back Close
Full Screen / Esc
Printer-friendly Version Interactive Discussion
Discussion
P
a
per
|
Dis
cussion
P
a
per
|
Discussion
P
a
per
|
Discussio
n
P
a
per
|
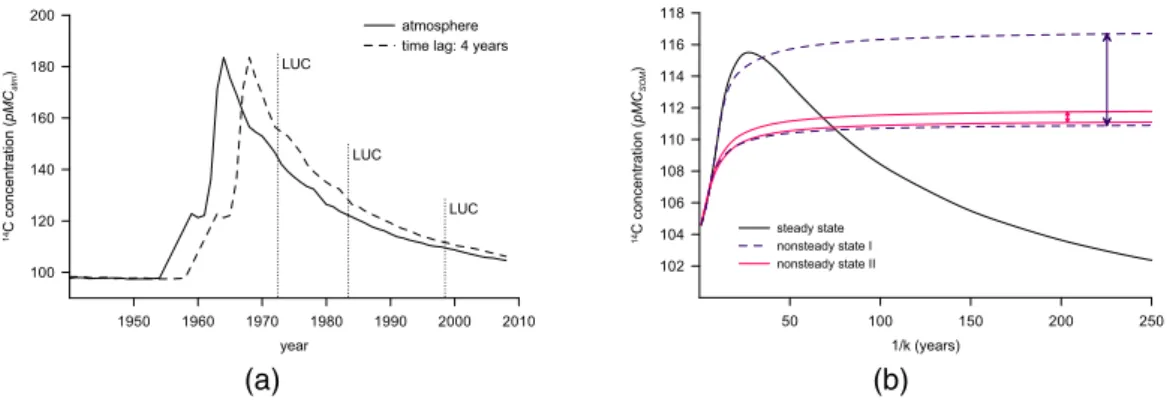
To derive soil SOM-C dynamics in response to LUC we used bomb radiocarbon, a tool to estimate C exchange on decadal timescales. Bomb radiocarbon reflects the time since14C atoms, produced by atmospheric nuclear weapons testing in the late 1950s and early 60s (Fig. 1a), were fixed from the atmosphere by plants. After adding a time lag between photosynthetic fixation and C storage in SOM, the degree to which bomb
5
radiocarbon is found in SOM fractions provides a direct measure of decomposition rates (Trumbore, 2009). Lag times are difficult to measure but can be estimated from root turnover and should be incorporated into C models (Torn et al., 2009). Gaudinski et al. (2000) estimated that the C in fine roots was fixed on average 7±1 yr ago. One draw-back using bomb radiocarbon as an indicator of soil C exchange rates arises from
10
the shape of the atmospheric record curve leading to two different time allocations for the same 14C concentration: one before and one after the bomb spike in 1963. Thus, it is essential to use models to derive decomposition estimates from radiocarbon signature and compare fluxes with estimated rates of C inputs such as litter quantity and quality, and losses such as respiration (Trumbore, 2009). However, we know of
15
no such study in abandoned grasslands, which is the dominant form of LUC in the European Alps (Tappeiner et al., 2008; Zimmermann et al., 2010).
While soil respiration measurements most probably overestimate SOM turnover rates,14C measurements on bulk soil at a single point in time clearly underestimate C fluxes (Gaudinski et al., 2000; Torn et al., 2009). Decomposition rates are biased
20
towards the slow-cycling mineral-associated C building usually the major proportion of SOM-C. Therefore, modeling ecosystem C accumulation and turnover requires the separation of homogeneous SOM fractions in terms of C-cycling time variation. Physical fractionation by density has proven particularly useful to identify meaningful soil fractions to LUC with or without soil mechanical disturbance (Golchin et al., 1994b;
25
BGD
8, 9943–9976, 2011Free and protected soil organic carbon dynamics respond
S. Meyer et al.
Title Page
Abstract Introduction
Conclusions References
Tables Figures
◭ ◮
◭ ◮
Back Close
Full Screen / Esc
Printer-friendly Version Interactive Discussion
Discussion
P
a
per
|
Dis
cussion
P
a
per
|
Discussion
P
a
per
|
Discussio
n
P
a
per
|
Previous studies on mountain grasslands (Leifeld and Fuhrer, 2009; Martinsen, 2010) show contrasting responses of POM to management intensity, which is on the one hand attributed to differences in grassland type, management intensity and time since LUC, but on the other hand illustrates that POM is most probably not a chemi-cally and physichemi-cally homogeneous SOM fraction. The aggregate-based isolation of free
5
inter- and occluded intra-aggregate organic matter provides additional information on microbial and physical processes that influence turnover and stability of SOM. Studies that divided POM into sub-fractions show that free and occluded POM are functionally specific pools and free POM responds much stronger to changes in grassland man-agement intensity than occluded POM (Meyer et al., 2011; Steffens et al., 2011), partly
10
because differences in aggregation are minimal in grassland ecosystems.
Like all chemical and biochemical processes microbial decomposition of SOM is not only dependent on litter quality (Co ˆuteaux et al., 1995) but shows feedbacks with tem-perature and moisture (Davidson and Janssens, 2006). Effects of LUC on SOM-C storage and dynamics can be larger than those of climate (Torn et al., 2009;
Schindl-15
bacher et al., 2010). However, it is important to have reliable quantitative information not only of SOM-C storage but also on input and decomposition rates defining potential sinks for terrestrial C.
Gamper et al. (2007) and Rubatscher (2008) measured an increase in aboveground phytomass-C in the range of 0.9 to 2.0 t C ha−1 and 2.5 to 6.6 t C ha−1, respectively,
20
from meadow to abandoned grasslands that were abandoned 30 yr ago. The C/N ratios of plant biomass in managed grasslands were in the range of 20-27 and increased up to 35 towards abandonment consistent with an increase in dwarf shrubs (Rubatscher, 2008). Additionally litter-C increased from 0.5 to 2.5 t C ha−1(Gamper et al., 2007). As changes in aboveground biomass influence belowground microbial community
com-25
position (Wardle et al., 2004) and POM stocks depend upon mineralization of plant residues we expect a response of POM to management abandonment.
BGD
8, 9943–9976, 2011Free and protected soil organic carbon dynamics respond
S. Meyer et al.
Title Page
Abstract Introduction
Conclusions References
Tables Figures
◭ ◮
◭ ◮
Back Close
Full Screen / Esc
Printer-friendly Version Interactive Discussion
Discussion
P
a
per
|
Dis
cussion
P
a
per
|
Discussion
P
a
per
|
Discussio
n
P
a
per
|
would decrease with abandonment and thus SOM stocks would increase. Using bomb radiocarbon we additionally gain information on relevant time periods for C accumula-tion. We applied physical fractionation to soils from a grassland gradient including hay meadow, grazed pasture and abandoned grassland in two climatically different sub-alpine regions in the European Alps. Grasslands at one site were used in the context of
5
earlier studies on various aspects of the C cycle (Bahn et al., 2006, 2008; Rubatscher, 2008; Schmitt et al., 2010). This allows comparison of fluxes derived from respiration measurements versus estimated rates implied from the SOM-C stocks and turnover.
2 Methods
2.1 Site description and soil sampling
10
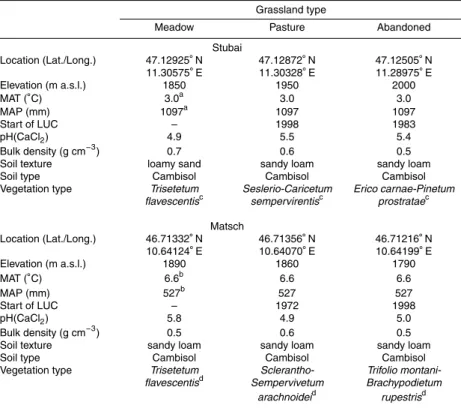
The study was carried out at two sites in cool temperate climate regions in the Eu-ropean Alps, each comprising a hay meadow, a pasture, and an abandoned grass-land, but differing in temperature and precipitation. Table 1 summarizes site and soil characteristics. Using a gradient of decreasing management intensity we substituted time by space in order to analyze in parallel three different grassland systems at two
15
regions. A first land-use gradient is located at a moist site in the Stubai Valley in Tyrol (Austria) at 1820–1950 m a.s.l. (Stubai site). A second predominantly dry site is located in the inner-alpine Matsch Valley in South Tyrol (Italy) at 1790–1860 m a.s.l. (Matsch site). At the two sites, mean annual precipitation is 1097 mm and 527 mm, and mean annual temperature is 3◦C and 6.6◦C, respectively. In October 2008, three (Stubai
20
site) or two (Matsch site) paired soil cores (490 cm3 volume, 7 cm ø) were collected in each grassland type at 0–10 cm depth. Places of soil core collection were situated at lateral distances of 20–100 m from each other.
At the Stubai site, the meadow is typically cut for hay production once a year at the end of July, manured every 2–4 yr, and has been used for light grazing by
cat-25
BGD
8, 9943–9976, 2011Free and protected soil organic carbon dynamics respond
S. Meyer et al.
Title Page
Abstract Introduction
Conclusions References
Tables Figures
◭ ◮
◭ ◮
Back Close
Full Screen / Esc
Printer-friendly Version Interactive Discussion
Discussion
P
a
per
|
Dis
cussion
P
a
per
|
Discussion
P
a
per
|
Discussio
n
P
a
per
|
the hay meadow is irrigated during dry summers, mowed twice a year and manured every year in autumn (high management intensity). Given continuous meadow man-agement SOM fractions are assumed to be at steady state. Soil temperature and moisture (ECH2O EC10 probe, Decagon Devices, Inc., Pullman, WA, USA) of 0–10 cm
depth was recorded half-hourly over a one-year period from 21 October 2008–31
Octo-5
ber 2009 in grasslands at both sites with HOBO data logger (Onset Computer, Bourne, MA, USA).
With socio-economic transformations in European mountain regions meadow man-agement was reduced and grasslands were converted to less labor-intensive pastures or left abandoned. At the Stubai site, the pasture, a former hay meadow previously
10
managed as described above, has been grazed by young cattle from mid-June until the end of September since 1998. The abandoned grassland had previously been grazed by cattle during summer months until management stopped in 1983. At the Matsch site, the pasture, formerly used as hay meadow, has been grazed in autumn by predominantly young cattle since the 1970s. The abandoned grassland has been used
15
for grazing until about 10 yr ago. Therefore, SOM fractions of pastures and abandoned grasslands have most likely not reached new steady state yet.
2.2 Physical fractionation
Physical density fractionation of soil aims to extract homogeneous SOM fractions to derive turnover times using their radiocarbon signature. Briefly, the field-moist soil core
20
was weighed and gently passed through a 6.3 mm sieve. Roots remaining on the sieve were washed and dried at 60◦C, and stones were collected. An aliquot was retrieved for moisture correction of bulk density of fine earth.
Following the aggregate and density fractionation presented in Cambardella and El-liott (1993, 1994) 100 g of dried soil <6.3 mm was wet-sieved sequentially through
25
BGD
8, 9943–9976, 2011Free and protected soil organic carbon dynamics respond
S. Meyer et al.
Title Page
Abstract Introduction
Conclusions References
Tables Figures
◭ ◮
◭ ◮
Back Close
Full Screen / Esc
Printer-friendly Version Interactive Discussion
Discussion
P
a
per
|
Dis
cussion
P
a
per
|
Discussion
P
a
per
|
Discussio
n
P
a
per
|
and isotope analysis as this distinct labile litter fraction is typical for mountain soils (Leifeld et al., 2009; Neffet al., 2009). All samples were dried at 60◦C. Stones>2 mm were collected and used together with the mass of stones>6.3 mm and roots to cor-rect bulk density calculations taking into account a density of 2.65 g cm−3of the parent material. A 5–15 g subsample of each aggregate size was suspended in centrifuge
5
glasses using 70 ml of 1.6 g cm−3sodium polytungstate. Floating fPOM was separated after two replicated centrifugation steps with stirring in between, washed with deion-ized water (to reach electrical conductivity of <0.5 S cm−1), and then dried at 60◦C. The same procedure was repeated after ultrasonication (22.5 J ml−1) to release oPOM from every aggregates size class. We define wPOM and fPOM as unprotected and
10
free of aggregates and oPOM and mOM as protected within the soil matrix. Details on the distribution of water-stable aggregates and aggregate-associated C appear in Meyer et al. (2011).
2.3 Total SOM-C and Isotope Analysis
Samples were carbonate-free, and hence SOM-C was similar to total C. Total C was
15
measured on bulk soils samples, POM fractions and roots by dry combustion in an elemental analyser (Euro EA, Hekatech, Wegberg, Germany) at Agroscope, Z ¨urich, Switzerland. Bulk soil material, POM, and roots were combusted and graphitised for AMS measurements of radiocarbon content. 14C concentrations refer to composite samples for each grassland type. This yielded in one bulk soil, wPOM and root sample,
20
and one fPOM and oPOM fraction for each meadow, pasture and abandoned grass-land at both sites. Samples were measured at the Accelerator Mass Spectrometry (AMS) facility at the ETH Zurich, Switzerland. The results were expressed as percent Modern Carbon (pMC), calculated following the protocol of Stuiver and Polach (1977) (pMCatm=∆14Catm/1000+1). ∆14C is a special nomenclature introduced for bomb
ra-25
BGD
8, 9943–9976, 2011Free and protected soil organic carbon dynamics respond
S. Meyer et al.
Title Page
Abstract Introduction
Conclusions References
Tables Figures
◭ ◮
◭ ◮
Back Close
Full Screen / Esc
Printer-friendly Version Interactive Discussion
Discussion
P
a
per
|
Dis
cussion
P
a
per
|
Discussion
P
a
per
|
Discussio
n
P
a
per
|
calculated by difference to bulk soil as the main interest in our study was the response of POM to grassland abandonment.
2.4 Modeling SOM-C dynamic with bomb radiocarbon
For SOM in C balance, losses from biological activity are balanced by organic inputs from plants, when C losses through leaching or erosion are neglected. Ecosystem
5
disturbances, such as human-induced changes in land-use have the potential to disrupt this balance (Paterson et al., 2009). SOM fractions that have accumulated C during the past 30 yr will have more bomb radiocarbon than those that have remained at steady state.
Modeling C input (I) and decomposition (k) rates using radiocarbon measurements
10
requires the record of14C in atmospheric CO2incorporated by plants. We used the 14
C record in atmospheric CO2for the Northern Hemisphere from Stuiver et al. (1998) until 1954 and from Levin (2004) for the time periods 1959–1983 and 1987–2008. For the latter period values of Jungfraujoch (3000 m a.s.l.) and Schauinsland (1200 m a.s.l.) were averaged in order to gain appropriate results for the subalpine grassland sites at
15
1900 m a.s.l. Periods between 1955–1958 and 1984–1986 were linearly interpolated. Atmospheric14C contents in 1974–1975 were taken from Levin et al. (1994). We used two approaches to model the evolution of∆14C:
Steady-state model
For SOM fractions that did not change C stock along the land-use gradient (all fractions
20
of both meadows and the pasture at Stubai site; oPOM-C and mOM-C of all grass-lands) and root-C with turnover in the range of<5 yr we used a steady-state model as presented in Torn et al. (2009)
BGD
8, 9943–9976, 2011Free and protected soil organic carbon dynamics respond
S. Meyer et al.
Title Page
Abstract Introduction
Conclusions References
Tables Figures
◭ ◮
◭ ◮
Back Close
Full Screen / Esc
Printer-friendly Version Interactive Discussion
Discussion
P
a
per
|
Dis
cussion
P
a
per
|
Discussion
P
a
per
|
Discussio
n
P
a
per
|
where pMCSOM(t) represents the steady-state reservoir of SOM in year t, k
is the decomposition rate (yr−1), pMCatm(t−tl) is the ∆14C in the atmosphere
(pMCatm(t−tl)=∆ 14
Catm(t−tl)/1000+1) in year (t−tl), wheretl represents the time lag
between photosynthetic fixation and addition to SOM (Fig. 1a), andλis the radioactive decay constant for 14C, equal to 1/8267 yr. The decomposition ratek is adjusted to
5
match14C concentrations of SOM fractions in the year of measurement 2008. The AMS precision (±1σ) is±0.4 pMC. This error was used in calculations of variation in C decomposition and accumulation rates.
Since the C stock is at steady state: I=C(t)×k, whereI is the annual C input rate to SOM fractions in kg C m−2yr−1 and C is the measured C stock in kg C m−2 in the
10
year of sampling 2008. For fPOM, oPOM and mOM fractions we added a time lag that was equal to the turnover time of roots (1–4 yr) of the respective grassland type. For the litter fraction (wPOM) we assumed that annual C additions are labeled with the14C of that years atmosphere as litter falls on the soil surface after senescence (zerotl).
C accumulation model 15
For SOM fractions that have accumulated C since reduction of management intensity (wPOM and fPOM of the pasture at Matsch site and both abandoned grasslands) we estimated changes in C storage and flux since LUC using an accumulation model (modified after (Gaudinski et al., 2000; Schulze et al., 2009)). We assumed that C accumulation started in the year of LUC (ti =1972, 1983, 1998) and that total C(t) in 20
kg C m−2 in every yeartis the sum of the existing decomposing C stockC(ti−1) and
the new C input I accumulating at a certain rate (Eq. 2). C(ti−1) was equal to the measured steady-state SOM-C stock in 2008 of the respective grassland before LUC. The radiocarbon content of the initially existing SOM-C pool before LUC pMCSOM(ti−1)
was taken from the steady-state model. Equation (3) expresses the mass-weighted
25
BGD
8, 9943–9976, 2011Free and protected soil organic carbon dynamics respond
S. Meyer et al.
Title Page
Abstract Introduction
Conclusions References
Tables Figures
◭ ◮
◭ ◮
Back Close
Full Screen / Esc
Printer-friendly Version Interactive Discussion
Discussion
P
a
per
|
Dis
cussion
P
a
per
|
Discussion
P
a
per
|
Discussio
n
P
a
per
|
C(t)=C(ti−1)×e−k(t−ti−1)+
t
X
t′=t
i
I×e−k(t′−ti), (2)
pMC
SOM(
t
)
=
C(ti−1)×pMCSOM(ti−1)×e−k(t−ti−1)+
t
P
t′=ti
I×pMCatm(t−tl)×e−k(t′−ti)
C(t) . (3)
5
Since the C stock is not at steady state (I6=C(t)×k) bothI andk, which are assumed to be constant, were adjusted to match C stock and∆14C content for the specific SOM fractions in 2008, listed in Table 2. The annual change in C was developed based on the relative (%) change in SOM-C with repect to the initial C stock before LUC in order to reflect the temporal change in C accumulation. Therefore, we added a time frame until
10
2030 to gain information about the potential of grassland abandonment to sequester C in the short or longer run. We explicitly assumed that ecosystem conditions remain constant within the next 20 yr. The rate of accumulation of C in g C m−2yr−1for a SOM fraction in 2008 is the difference in C stock calculated for 2007 and 2008.
The use of abstract models implicates various constrains that need to be considered.
15
The choice oftl is very important for fast-cycling SOM fractions and almost negligible
for intermediate or slow-cycling SOM fractions as they contain only traces of bomb C (Leifeld et al., 2009). A highertl results in a faster turnover and the exclusion causes an underestimation of turnover rate. For example, withouttl turnover of wPOM-C of the meadow at Stubai would be 7 yr. When including a tl of 4 yr the C cycling time 20
would reduce to 4 yr.
Tracking the atmospheric record of14CO2of the last century it is comprehensive that under steady-state conditions bomb radiocarbon models produce two different turnover times that may yield to the same∆14C value, if pMCSOM(2008)>pMCatm(2008).
Con-sequently, in C accumulation models that started accumulation after the bomb spike in
25
BGD
8, 9943–9976, 2011Free and protected soil organic carbon dynamics respond
S. Meyer et al.
Title Page
Abstract Introduction
Conclusions References
Tables Figures
◭ ◮
◭ ◮
Back Close
Full Screen / Esc
Printer-friendly Version Interactive Discussion
Discussion
P
a
per
|
Dis
cussion
P
a
per
|
Discussion
P
a
per
|
Discussio
n
P
a
per
|
the SOM fraction. However, C accumulation can be modeled from two turnover times for the initial C stock at steady state, which also leads to two solutions for the C accu-mulation model. The smaller the accuaccu-mulation rate the more it is likely to receive two different turnover times resulting in the same C stock. Consequently, the determination of turnover is strongly dependent on the extent of C accumulation. The stronger the
5
annual change in C stock the less important is the initial pMCSOM(ti−1) value (Fig. 1b).
Regarding the choice of appropriate turnover, roots and litter are very unlikely to have turnover>100 yr and thus we assumed a turnover in the range of<10 yr for both root-C and wPOM-C. Results from SOM studies in different grassland systems sug-gest that f- and oPOM are functionally different pools within the soil matrix
respond-10
ing differently to changes in management intensity (Steffens et al., 2009, 2011). At meadows the amount of assimilating plant matter is reduced but with cessation of cut-ting litter availability increases and fPOM accumulates, while protected oPOM remains generally unaffected by this undisturbed LUC. Therefore, we explicitly assumed that in meadows both POM fractions have low C input rates and turnover, but with time and
15
LUC C input rates to fPOM increase. The mOM-C had lower14C concentrations than all three POM fractions and 104.62 pMC, the atmospheric 14C concentration in 2008 for the used record, but the exception of the meadow at Matsch. This pattern indicates a slower turnover compared with roots or POM fractions exhibiting14C concentrations within the atmospheric bomb14C window between 1953 and today.
20
2.5 Statistics
Unavoidable pseudo-replication in sampling did not permit to the use of a One-Way ANOVA to comprehend changes in C stocks, input and decomposition rates along the land-use gradients. For this reason, we followed the suggestion of Hurlbert (1984) and Webster (2001) and interpreted the results based on means and standard errors
25
BGD
8, 9943–9976, 2011Free and protected soil organic carbon dynamics respond
S. Meyer et al.
Title Page
Abstract Introduction
Conclusions References
Tables Figures
◭ ◮
◭ ◮
Back Close
Full Screen / Esc
Printer-friendly Version Interactive Discussion
Discussion
P
a
per
|
Dis
cussion
P
a
per
|
Discussion
P
a
per
|
Discussio
n
P
a
per
|
3 Results
3.1 Soil temperature and moisture
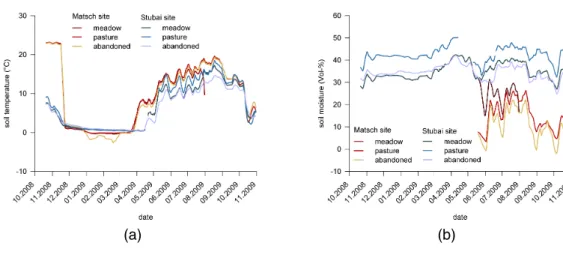
Figure 2 shows soil temperature and moisture in 0–10 cm depth of all grasslands. At both sites, soil temperature was highest in pasture and lowest in abandoned grassland. However, at Matsch differences were less pronounced. During the period from May–
5
September differences in soil temperature between pasture and abandoned grassland were 2.7◦C at Stubai and 0.2◦C at Matsch. After hay cut by the end of July soil tem-peratures of the meadow and abandoned grassland differed most at Stubai. Soil tem-perature was higher in grasslands at Matsch. For example, the abandoned grassland at Matsch was on average 4.3◦C warmer from May–September than at Stubai.
10
Soil moisture was retained under pasture and during summer month was on average 9 Vol-% and 4 Vol-% higher at Stubai and Matsch, respectively, than in abandoned grassland. The meadow at Matsch is irrigated and soil moisture was higher than at pasture and abandoned grassland before the logger ceased to record at the end of July. Comparing both sites, soil moisture was lower in grasslands at Matsch. For example,
15
from May–September the abandoned grassland at Matsch was 22 Vol-% less moist than at Stubai.
3.2 Soil C stocks
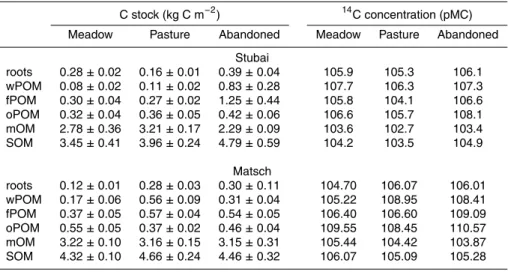
Table 2 summarizes measured C stocks in kg C m−2for the year 2008 of SOM fractions in upper 0–10 cm of three grassland soils varying in management intensity. Highest
20
bulk SOM-C stocks were measured in abandoned grassland at Stubai and pasture at Matsch. Among SOM-C the wPOM-C and fPOM-C stocks were most affected and in-creased following management reduction. The proportion of POM-C in SOM-C ranged from 11–43 % in pastures and abandoned grasslands at both sites. The oPOM and mOM showed only slight (<0.1 kg C m−2) or no accumulation of C towards
abandon-25
BGD
8, 9943–9976, 2011Free and protected soil organic carbon dynamics respond
S. Meyer et al.
Title Page
Abstract Introduction
Conclusions References
Tables Figures
◭ ◮
◭ ◮
Back Close
Full Screen / Esc
Printer-friendly Version Interactive Discussion
Discussion
P
a
per
|
Dis
cussion
P
a
per
|
Discussion
P
a
per
|
Discussio
n
P
a
per
|
pasture, but w- and fPOM-C stocks increased by 0.72 and 0.98 kg C m−2 when com-paring pasture to abandoned grassland. At Matsch wPOM-C and fPOM-C stocks in-creased from meadow to pasture and from meadow to abandoned grassland, while differences between pasture and abandoned grassland were small. The oPOM-C and mOM-C stocks were highest in meadow. In all grasslands the major part of SOM-C was
5
mineral-associated. In both managed grasslands the proportion of mOM-C in SOM-C was lower at Matsch than at Stubai.
3.3 Soil C input and decomposition rates
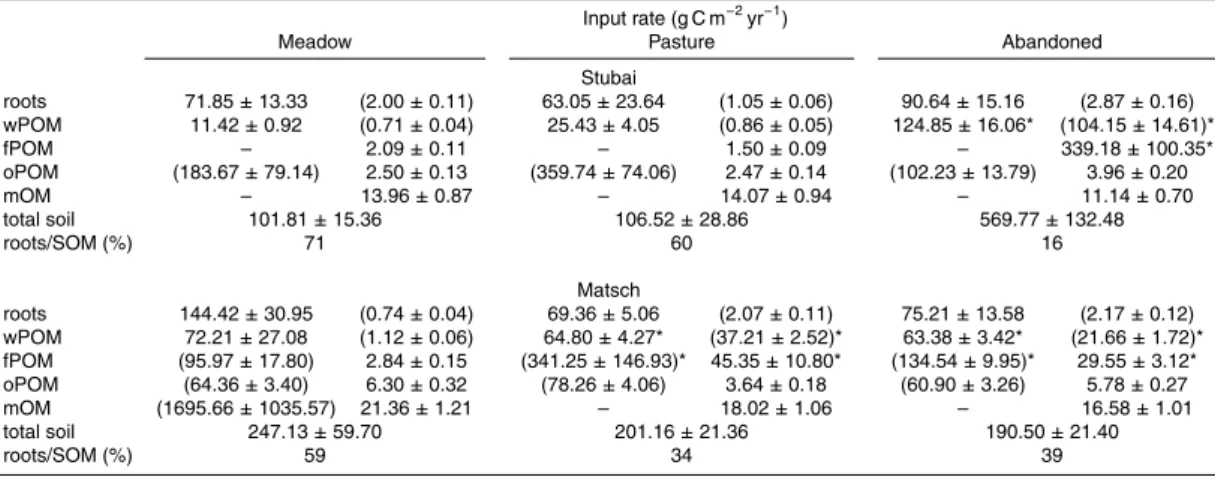
Tables 3 and 4 compare bomb radiocarbon-derived C input rates in g C m−2yr−1 and decomposition rates in years−1 necessary to maintain both steady-state and
10
nonsteady-state C stocks in 2008. In 2008 the C input to bulk SOM ranged from 101.8 to 569.8 g C m−2yr−1at Stubai and from 190.5 to 247.1 g C m−2yr−1 at Matsch. High-est C input rates were High-estimated for the abandoned grassland at Stubai and for the intensively managed meadow at Matsch. Because decomposition rates in nonsteady-state systems do not reflect the mean residence time of C atoms in certain organic
15
matter stocks, it was not reasonable to calculate the fraction-weighted mean decom-position rate for bulk SOM-C. Among SOM-C fractions decomdecom-position rates decreased from POM to mOM across grasslands at both sites. In general, C turnover ranged from years to decades and decreased from w- and fPOM to oPOM to mOM. The land-use sensitive free POM-C fractions turned over within 4–8 yr, while oPOM-C represented a
20
slower cycling pool within the range of 76–142 yr. The mOM contained the slowest cy-cling C pool turning over within 142–250 yr. This trend was consistent with results from Swanston et al. (2005); Liao et al. (2006) and Budge et al. (2011), who also calculated shorter turnover times for free POM as opposed to aggregate- or mineral-associated SOM.I andk of oPOM and mOM of all grasslands were higher at Matsch site than at
25
BGD
8, 9943–9976, 2011Free and protected soil organic carbon dynamics respond
S. Meyer et al.
Title Page
Abstract Introduction
Conclusions References
Tables Figures
◭ ◮
◭ ◮
Back Close
Full Screen / Esc
Printer-friendly Version Interactive Discussion
Discussion
P
a
per
|
Dis
cussion
P
a
per
|
Discussion
P
a
per
|
Discussio
n
P
a
per
|
relatively balanced following management change. Based on these results we con-sider unprotected w- and fPOM-C as labile and both oPOM and mOM as stable SOM fractions.
The wPOM and fPOM fractions of pasture at Matsch and both abandoned grasslands accumulated C since LUC and the two unique parameters describing soil C flux, I
5
and k, were calculated from the nonsteady-state model (Eqs. 2 and 3). Because of large changes in atmospheric 14C content since the late 1950s, the input rates for radiocarbon differs from the constant input rate assumed for SOM fractions at steady state. Therefore, it is important to note that decomposition and input rates of wPOM-C and fPOM-C in pasture at Matsch and abandoned grasslands at both sites represent
10
SOM fractions that have accumulated C for different periods of time. At Stubai C input rates of wPOM increased with abandonment. In the abandoned grassland C input was 11 and 5 times higher than in meadow and pasture, respectively. Together with only slight changes in decomposition rates the higher C input is responsible for the increase in wPOM-C stocks towards abandonment. Carbon inputs to wPOM, the litter
15
fraction, increased from 11.4 to 124.9 g m−2yr−1 at Stubai and decreased from 72.2 to 63.4 g m−2yr−1 at Matsch. Input rates are in the range of measurements from Hitz et al. (2001) who observed an annual aboveground C input of 17.9 to 60.2 g m−2yr−1 to subalpine and alpine grasslands in the Swiss Alps. Also, the increase in fPOM-C stock towards abandonment is related to higher C input rates compensating for higher
20
decomposition rates. Carbon input increased from 1.5 to 339.2 g C m−2yr−1to account for an increase in C stock of 980 g C m−2 from pasture to abandoned grassland. The sharp increase has several reasons. First, the increase in C was highest for the fPOM fraction, which means that this fraction is most affected by LUC. Second, assuming a 3 year time lag there was no solution to Eq. (3) for a fast C turnover of fPOM, which
25
BGD
8, 9943–9976, 2011Free and protected soil organic carbon dynamics respond
S. Meyer et al.
Title Page
Abstract Introduction
Conclusions References
Tables Figures
◭ ◮
◭ ◮
Back Close
Full Screen / Esc
Printer-friendly Version Interactive Discussion
Discussion
P
a
per
|
Dis
cussion
P
a
per
|
Discussion
P
a
per
|
Discussio
n
P
a
per
|
after cessation of moving and grazing the estimated decomposition ratek might reflect the initial rapid breakdown of labile compounds.
At the Matsch site C input rates of wPOM, roots, oPOM and mOM was highest in the intensively managed meadow compared to pasture and abandoned grassland. Meadow management also affected decomposition rates of roots and wPOM-C, which
5
in both cases were 3.3 and 2.1 times that of pasture and abandoned grassland, re-spectively. Decomposition rates were highest for fPOM-C in pasture, but high C input compensated the higher C efflux and led to an accumulation of 0.2 kg C m−2 within 36 yr of LUC. In meadows, all SOM fractions had slower decomposition rates in the moderately managed meadow at Stubai site, with differences being most pronounced
10
for roots and wPOM-C. For pastures C inputs to all SOM-C fractions were lower at Stubai, while there was no clear pattern for decomposition rates. The contribution of C input from roots to soil decreased with abandonment.
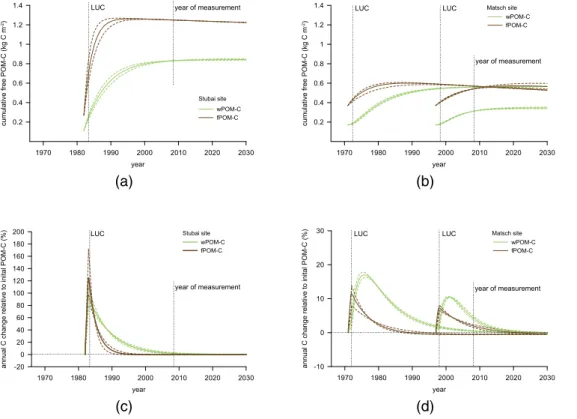
Figure 3 captures information on relevant time periods for C accumulation in labile POM fractions. In agreement with results on C accumulation from long-term studies
15
(Buyanovsky and Wagner, 1998; Johnston et al., 2009), wPOM-C and fPOM-C stocks do not accumulate indefinitely. The increase in C stock ceases as a new steady-state value is approached (Fig. 3a, b). At both sites, most C is sequestered in the first years after LUC (Fig. 3c, d).
The rates of C accumulation, as the difference in C stocks calculated for 2007 and
20
2008, decreased with time since reduction of management intensity. For wPOM-C it decreased from 7.45±0.99 g C m−2 to 2.18±1.06 g C m−2 to 0.82±0.21 g C m−2 and for fPOM annual C accumulation rates decreased from 7.30±1.60 g C m−2 to−1.27± 0.07 g C m−2 to −2.03±0.23 g C m−2. While wPOM still accumulates C after 36 yr of abandonment, which is the longest time period studied, fPOM ceased to accumulate
25
BGD
8, 9943–9976, 2011Free and protected soil organic carbon dynamics respond
S. Meyer et al.
Title Page
Abstract Introduction
Conclusions References
Tables Figures
◭ ◮
◭ ◮
Back Close
Full Screen / Esc
Printer-friendly Version Interactive Discussion
Discussion
P
a
per
|
Dis
cussion
P
a
per
|
Discussion
P
a
per
|
Discussio
n
P
a
per
|
4 Discussion
4.1 Effect of grassland abandonment on soil C dynamics
We expected that a LUC-related change in aboveground biomass and litter would af-fect POM dynamics. Comparing bomb radiocarbon-derived estimates of C input and decomposition rates of POM fractions we found differences in responsiveness to
aban-5
donment between SOM fractions. While labile SOM fractions, both w- and fPOM, accumulated C with reduced management intensity there was no stabilization of C in inner-aggregate or mineral-associated SOM fractions. In meadow and pasture above-ground biomass is removed through cutting and grazing but is retained in abandoned grasslands. The w- and fPOM responded stronger to those changes than oPOM or
10
mOM. These findings agree with results from Steffens et al. (2011) who found that with cessation of grazing a large proportion of sequestered C is stored in readily decom-posable POM and not stabilized in the long run.
As vegetation changes and litter quality decreases with grassland abandonment, which has been assessed by Rubatscher (2008) for the same land-use gradient at
15
Stubai, we hypothesized that reduced decomposition would increase POM-C stocks. Among POM-C, only the increase in wPOM-C stocks can be related to a decrease in decomposition rates. The wPOM fraction comprises the most undecomposed plant material among extracted fractions and trends in litter quality are pronounced in this SOM fraction. In contrast, the increase in the fPOM-C stocks with abandonment was
20
consistent with higher decomposition rates but also higher C input rates. German et al. (2011) recently provided evidence that SOM decomposition is not exclusively linked to residue quality but also depends on its quantity. We assume that in grasslands the ces-sation of haying and grazing triggers the increase in residue quantity and availability and thus might be the prevailing factor affecting microbial activity and, in turn,
decom-25
BGD
8, 9943–9976, 2011Free and protected soil organic carbon dynamics respond
S. Meyer et al.
Title Page
Abstract Introduction
Conclusions References
Tables Figures
◭ ◮
◭ ◮
Back Close
Full Screen / Esc
Printer-friendly Version Interactive Discussion
Discussion
P
a
per
|
Dis
cussion
P
a
per
|
Discussion
P
a
per
|
Discussio
n
P
a
per
|
is low. Thus, mixing between unprotected undecomposed and protected SOM fractions is not promoted.
Rasse et al. (2005) emphasized that it is essential to understand the origin of C in SOM to adjust management practices that will support C storage. Our results show that C input pathways to SOM in 0–10 cm depth change along the managemant
gra-5
dient. Carbon input from roots to soil was highest under meadow and decreased with abandonment. This is in line with findings of Paterson et al. (2009) that sustained plant growth will stimulate C inputs from roots to soil. Management intensity, such as organic amendments and higher cut frequency, has a strong impact on productivity and alloca-tion of C inputs. When fertilizer management is not sustained and cutting and grazing
10
have been ceased, C inputs from roots to soil decrease whereas the proportion of litter-derived C increases. The intensive meadow management leads to higher C input rates also of oPOM and mOM fractions when compared to moderate management intensity despite both meadows were dominated by the same vegetation type (Table 1).
We detected site-specific differences in SOM dynamics. For oPOM-C and mOM-C
15
fractions we detected consistent faster decomposition rates at Matsch site, which is on average 3◦C warmer and exhibits higher soil temperatures. Soil texture is similar and does not contribute to differences in mOM-C decomposition between sites. Trumbore et al. (1996) analyzed decomposition rates along an elevation gradient and found that temperature is the dominant control for C dynamics, and that cooler temperatures were
20
associated with slower decomposition.14C concentrations were also higher for wPOM and fPOM fractions, but as these two free POM fractions are strongly affected by a sudden increase in aboveground plant matter with abandonment, any micro-climatic in-terrelations might be masked. Ecosystem disturbance (Davidson and Janssens, 2006) as well as the time since LUC might obscure an intrinsic temperature sensitivity of
la-25
BGD
8, 9943–9976, 2011Free and protected soil organic carbon dynamics respond
S. Meyer et al.
Title Page
Abstract Introduction
Conclusions References
Tables Figures
◭ ◮
◭ ◮
Back Close
Full Screen / Esc
Printer-friendly Version Interactive Discussion
Discussion
P
a
per
|
Dis
cussion
P
a
per
|
Discussion
P
a
per
|
Discussio
n
P
a
per
|
of mOM-C in SOM-C ranges from 48 % to 81 % and even small increases in decom-position rates in response to raised air and soil temperatures may result in a sigificant change in SOM in the long term (Davidson and Janssens, 2006). At the Matsch site, low moisture contents throughout the year seem not to limit decomposition rates. One possible explanation is the shift in microbial composition towards fungal biomass with
5
abandonment, as shown by Zeller et al. (2000). Mycorrhizal fungi facilitate the exploita-tion of a greater soil volume and provide plants with addiexploita-tional water and nutrients.
We found that most C is sequestered in the first years after abandonment. Our re-sults are consistent with findings of Conant et al. (2001) that LUC-related differences in rates of C fluxes and stocks in grasslands are high at the beginning and decrease with
10
time. They compiled results from 115 studies including grasslands and found that C accumulation rates were highest during the first 40 yr. West et al. (2004) and Poeplau et al. (2011) generated carbon response functions and modeled the temporal dynamic of bulk SOM-C after pronounced LUCs, i.e. from cropland to grassland or forest and vice versa. The most interesting result in relation to our study is that changes in
SOM-15
C stock following afforestation of grasslands under temperate conditions depend on accumulated litter. Only continuous accumulation of forest litter caused an increase of SOM-C in the range of 28±11 % within 100 yr since LUC, while the change in mineral SOM-C stocks was minimal (−7±23 %) (Poeplau et al., 2011). In line with these re-sults are empirical observations from Bitterlich et al. (1999) and Seeber and Seeber
20
(2005) who detected a change in humus type by reduced grassland management and conversion to forest from vermimull to moder. The increased difference between litter and mineral soil with grassland abandonment underlines our conclusions of limited C exchange between labile and stable SOM fractions.
4.2 Comparison of bomb radiocarbon- and respiration-derived C fluxes
25
BGD
8, 9943–9976, 2011Free and protected soil organic carbon dynamics respond
S. Meyer et al.
Title Page
Abstract Introduction
Conclusions References
Tables Figures
◭ ◮
◭ ◮
Back Close
Full Screen / Esc
Printer-friendly Version Interactive Discussion
Discussion
P
a
per
|
Dis
cussion
P
a
per
|
Discussion
P
a
per
|
Discussio
n
P
a
per
|
et al. (2008) conducted soil respiration measurements and derived a C input rate of 7.3 t C ha−1yr−1 for the same pasture at Stubai. Using physical fractionation and ra-diocarbon methods we derived an input rate of C to SOM of the same pasture in the order of only 1.1 t C ha−1yr−1. Our results are in the range of estimates of Leifeld and Fuhrer (2009) who radiocarbon-modeled a steady-state SOM-C input rate of 0.7 and
5
0.9 t C ha−1yr−1for subalpine meadow and pasture in the Swiss Alps, respectively, and Budge et al. (2011) who derived radiocarbon-related annual C inputs into alpine grass-lands above 2200 m a.s.l. in the range of 0.4 to 1.0 t C ha−1yr−1.
The discrepancy between differently-derived SOM-C fluxes has several reasons. First, soil respiration and SOM-C fractionation techniques do not capture C fluxes of
10
the same systems in the soil. Soil respiration measures CO2 efflux from the entire soil to the atmosphere disregarding composition and C-cycling time variation of SOM fractions. Despite methodological improvements (Kuzyakov and Larionova, 2005) it remains difficult to partition heterotrophic and autotrophic respiration and the latter strongly influences soil respiration measurements. As in most soils only a small
frac-15
tion contributes to heterotrophic respiration, this method captures predominantly the active fast-cycling dynamic fraction of SOM and overestimates SOM-C turnover (Torn et al., 2009). Second, both methods cover different time periods. Ecosystem flux measurements capture C fluxes on a daily to monthly basis. Thus, they capture the inner-annual variation in C balance through short-term effects of mowing and grazing,
20
but assess C sink-source relations on a monthly basis (Wohlfahrt et al., 2008b; Don et al., 2009; Schmitt et al., 2010). In contrast, bomb radiocarbon signatures of SOM fractions integrate over annual to decadal timescales. Measurements of14C do not al-low a resolution of C dynamic on a monthly basis, neglects fast-cycling SOM fractions and most probably underestimates soil C dynamics.
25
Despite differences in spatial and temporal resolution results of both measurement techniques reflect responses to grassland management abandonment. Schmitt et al. (2010) monitored net ecosystem exchange of CO2, gross primary productivity and
BGD
8, 9943–9976, 2011Free and protected soil organic carbon dynamics respond
S. Meyer et al.
Title Page
Abstract Introduction
Conclusions References
Tables Figures
◭ ◮
◭ ◮
Back Close
Full Screen / Esc
Printer-friendly Version Interactive Discussion
Discussion
P
a
per
|
Dis
cussion
P
a
per
|
Discussion
P
a
per
|
Discussio
n
P
a
per
|
found that all measures decreased with decreasing land-use intensity primarily be-cause of a decrease in autotrophic respiration and concluded that abandonment leads to reduced productivity. For the same land-use gradient, we found an increase in soil C input, which is primarily attributable to the accumulation of C in labile POM within the first years of abandonment. As the annual change in C accumulation decreases with
5
time it is essential to evaluate the year of measurement in relation to the length of time since LUC.
5 Conclusions
With regard to the effect of abandonment on SOM dynamics and relevant time periods for C accumulation we can draw two major conclusions from our results:
10
1. In mountain grasslands free and aggregate- or mineral-associated protected SOM are ecologically distinct SOM fractions with different C input pathways. While the first fractions are strongly dependent on land-use related changes in aboveground biomass, the latter fractions are independent of abandonment.
2. Our study shows that it is unlikely that the abandonment of mountain grassland,
15
the dominant form of LUC throughout the European Alps, provides a substantial net soil C sink.
BGD
8, 9943–9976, 2011Free and protected soil organic carbon dynamics respond
S. Meyer et al.
Title Page
Abstract Introduction
Conclusions References
Tables Figures
◭ ◮
◭ ◮
Back Close
Full Screen / Esc
Printer-friendly Version Interactive Discussion
Discussion
P
a
per
|
Dis
cussion
P
a
per
|
Discussion
P
a
per
|
Discussio
n
P
a
per
|
References
Bahn, M., Knapp, M., Garajova, Z., Pfahringer, N., and Cernusca, A.: Root respiration in tem-perate mountain grasslands differing in land use, Global Change Biol., 12, 995–1006, 2006. 9948
Bahn, M., Rodeghiero, M., Anderson-Dunn, M., Dore, S., Gimeno, C., Dr ¨ottsler, M., Williams,
5
M., Ammann, C., Berninger, F., Flechard, C., Jones, S., Balzarolo, M., Kumar, S., Newesely, C., Priwitzer, T., Raschi, A., Siegwolf, R., Susiluoto, S., Tenhunen, J., Wohlfahrt, G., and Cernusca, A.: Soil Respiration in European Grasslands in Relation to Climate and Assimilate Supply, Ecosystems, 11, 1352–1367, 2008. 9948, 9961
Bitterlich, W., P ¨ottinger, C., Kaserer, M., Hofer, H., Aichner, M., Tappeiner, U., and Cernusca,
10
A.: Effects of land-use changes on soils along the Eastern alpine transect, in: Land-Use Changes in European Mountain Ecosystems: ECOMONT - concepts and results, edited by: Cernusca, A., Tappeiner, U., and Bayfield, N., Blackwell Wiss.-Verl., Berlin, 1999. 9961 Budge, K., Leifeld, J., Hiltbrunner, E., and Fuhrer, J.: Alpine grassland soils contain large
proportion of labile carbon but indicate long turnover times, Biogeosciences, 8, 1911–1923,
15
doi:10.5194/bg-8-1911-2011, 2011. 9956, 9962
Buyanovsky, G. A. and Wagner, G. H.: Carbon cycling in cultivated land and its global signifi-cance, Global Change Biol., 4, 131–141, 1998. 9958
Cambardella, C. A. and Elliott, E. T.: Carbon and Nitrogen Distribution in Aggregates from Cultivated and Native Grassland Soils, Soil Sci. Soc. Am. J., 57, 1071–1076, 1993. 9949
20
Cambardella, C. A. and Elliott, E. T.: Carbon and Nitrogen Dynamics of Soil Organic Matter Fractions from Cultivated Grassland Soils, Soil Sci. Soc. Am. J., 58, 123–130, 1994. 9949 Cernusca, A., Tappeiner, U., and Bayfield, N.: Land-use Changes in European Mountain
Ecosystems : ECOMONT – Concepts and Results, Blackwell Wiss.-Verl., Berlin, 1999. 9945 Conant, R. T., Paustian, K., and Elliott, E. T.: Grassland Management and Conversion into
25
Grassland: Effects on Soil Carbon, Ecol. Appl., 11, 343–355, 2001. 9945, 9957, 9961 Co ˆuteaux, M.-M., Bottner, P., and Berg, B.: Litter decomposition, climate and litter quality,
Trends Ecol. Evol., 10, 63–66, 1995. 9947
Davidson, E. A. and Janssens, I. A.: Temperature sensitivity of soil carbon decomposition and feedbacks to climate change, Nature, 440, 165–173, 2006. 9947, 9960, 9961
30
BGD
8, 9943–9976, 2011Free and protected soil organic carbon dynamics respond
S. Meyer et al.
Title Page
Abstract Introduction
Conclusions References
Tables Figures
◭ ◮
◭ ◮
Back Close
Full Screen / Esc
Printer-friendly Version Interactive Discussion
Discussion
P
a
per
|
Dis
cussion
P
a
per
|
Discussion
P
a
per
|
Discussio
n
P
a
per
|
9960
Don, A., Rebmann, C., Kolle, O., Scherer-Lorenzen, M., and Schulze, E.-D.: Impact of afforestation-associated management changes on the carbon balance of grassland, Global Change Biol., 15, 1990–2002, 2009. 9962
Gamper, S., Tasser, E., and Tappeiner, U.: Short-time effects of land-use changes on O-horizon
5
in subalpine grasslands, Plant Soil, 299, 101–115, 2007. 9945, 9947
Gaudinski, J. B., Trumbore, S. E., Davidson, E. A., and Zheng, S.: Soil carbon cycling in a temperate forest: radiocarbon-based estimates of residence times, sequestration rates and partitioning of fluxes, Biogeochemistry, 51, 33–69, 2000. 9946, 9952
German, D. P., Chacon, S. S., and Allison, S. D.: Substrate concentration and enzyme allocation
10
can affect rates of microbial decomposition, Ecology, 92, 1471–1480, 2011. 9959
Golchin, A., Oades, J. M., Skjemstad, J. O., and Clarke, P.: Soil structure and carbon cycling, Aust. J. Soil Res., 32, 1043–1068, 1994a. 9959
Golchin, A., Oades, J. M., Skjemstad, J. O., and Clarke, P.: Study of free and occluded par-ticulate organic matter in soils by solid state13C Cp/MAS NMR spectroscopy and scanning
15
electron microscopy, Aust. J. Soil Res., 32, 285–309, 1994b. 9946
Hitz, C., Egli, M., and Fitze, P.: Below-ground and above-ground production of vegetational organic matter along a climosequence in alpine grasslands, J. Plant Nutr. Soil Sci., 164, 389–397, 2001. 9957
Hurlbert, S. H.: Pseudoreplication and the Design of Ecological Field Experiments, Ecol.
20
Monogr., 54, 187–211, 1984. 9954
Johnston, A. E., Poulton, P. R., and Coleman, K.: Soil Organic Matter: Its Importance in Sus-tainable Agriculture and Carbon Dioxide Fluxes, Adv. Agron., 101, 1–57, 2009. 9958 Kato, T., Tang, Y., Gu, S., Hirota, M., Cui, X., Du, M., Li, Y., Zhao, X., and Oikawa, T.:
Seasonal patterns of gross primary production and ecosystem respiration in an alpine
25
meadow ecosystem on the Qinghai-Tibetan Plateau, J. Geophys. Res., 109, D12109, doi:10.1029/2003JD003951, 2004. 9961
Kuzyakov, Y. and Larionova, A. A.: Root and rhizomicrobial respiration: A review of approaches to estimate respiration by autotrophic and heterotrophic organisms in soil, J. Plant Nutr. Soil Sci., 168, 503–520, 2005. 9962
30
BGD
8, 9943–9976, 2011Free and protected soil organic carbon dynamics respond
S. Meyer et al.
Title Page
Abstract Introduction
Conclusions References
Tables Figures
◭ ◮
◭ ◮
Back Close
Full Screen / Esc
Printer-friendly Version Interactive Discussion
Discussion
P
a
per
|
Dis
cussion
P
a
per
|
Discussion
P
a
per
|
Discussio
n
P
a
per
|
Leifeld, J., Zimmermann, M., Fuhrer, J., and Conen, F.: Storage and turnover of carbon in grassland soils along an elevation gradient in the Swiss Alps, Global Change Biol., 15, 668– 679, 2009. 9950, 9953
Levin, I.: The tropospheric14CO2 level in mid-latitudes of the Northern Hemisphere (1959– 2003), Radiocarbon, 46, 1261–1272, 2004. 9951
5
Levin, I., Kromer, B., Schoch-Fischer, H., Bruns, M., M ¨unnich, M., Berdau, D., Vogel, J., and M ¨unnich, K.: δ14CO2 record from Vermunt, in: Trends: A Compendium of Data on Global Change, Carbon Dioxide Information Analysis Center, Oak Ridge National Laboratory, US Department of Energy, Oak Ridge, Tenn., USA, 1994. 9951
Liao, J. D., Boutton, T. W., and Jastrow, J. D.: Organic matter turnover in soil physical fractions
10
following woody plant invasion of grassland: Evidence from natural13C and 15N, Soil Biol. Biochem., 38, 3197–3210, 2006. 9956
Martinsen, V.: Sheep grazing effects on soil carbon and nitrogen and implications for runoff
water quality at a low alpine site in southern Norway, Ph.D. thesis, Norwegian University of Life Sciences, As, 2010. 9945, 9947
15
Meyer, S., Leifeld, J., Bahn, M., and Fuhrer, J.: Carbon accumulates in free particulate organic matter in abandoned subalpine grassland soils, in review, J. Plant Nutr. Soil Sci., 2011. 9947, 9950
Neff, J. C., Barger, N. N., Baisden, W. T., Fernandez, D. P., and Asner, G. P.: Soil carbon storage responses to expanding pinyonjuniper populations in southern Utah, Ecol. Appl., 19,
20
1405–1416, 2009. 9950
Paterson, E., Midwood, A. J., and Millard, P.: Through the eye of the needle: a review of isotope approaches to quantify microbial processes mediating soil carbon balance, New Phytol., 184, 19–33, 2009. 9951, 9960
Poeplau, C., Don, A., Vesterdal, L., Leifeld, J., van Wesemael, B., Schumacher, J., and Gensior,
25
A.: Temporal dynamics of soil organic carbon after land-use change in the temperate zone carbon response functions as a model approach, Global Change Biol., 17, 2415–2427, 2011. 9961
Post, W. M. and Kwon, K. C.: Soil carbon sequestration and land-use change: processes and potential, Global Change Biol., 6, 317–327, 2000. 9945
30
Rasse, D., Rumpel, C., and Dignac, M.-F.: Is soil carbon mostly root carbon? Mechanisms for a specific stabilisation, Plant Soil, 269, 341–356, 2005. 9960
ecosys-BGD
8, 9943–9976, 2011Free and protected soil organic carbon dynamics respond
S. Meyer et al.
Title Page
Abstract Introduction
Conclusions References
Tables Figures
◭ ◮
◭ ◮
Back Close
Full Screen / Esc
Printer-friendly Version Interactive Discussion
Discussion
P
a
per
|
Dis
cussion
P
a
per
|
Discussion
P
a
per
|
Discussio
n
P
a
per
|
tem carbon fluxes at a subalpine grassland site in the Swiss Alps, Theor. Appl. Clim., 80, 187–203, 2005. 9961
Rubatscher, D.: Carbon pools and their dynamics in mountain ecosystems differing in land use, Ph.D. thesis, University of Innsbruck, Austria, 2008. 9945, 9947, 9948, 9959, 9970
Schindlbacher, A., de Gonzalo, C., Diaz-Pin ˜es, E., Gorria, P., Matthews, B., Incl ˜an, R.,
5
Zechmeister-Boltenstern, S., Rubio, A., and Jandl, R.: Temperature sensitivity of forest soil organic matter decomposition along two elevation gradients, J. Geophys. Res., 115, G03 018, 2010. 9947, 9960
Schmitt, M., Bahn, M., Wohlfahrt, G., Tappeiner, U., and Cernusca, A.: Land use affects the net ecosystem CO2exchange and its components in mountain grasslands, Biogeosciences,
10
7, 2297–2309, doi:10.5194/bg-7-2297-2010, 2010. 9945, 9948, 9961, 9962
Schulze, K., Borken, W., Muhr, J., and Matzner, E.: Stock, turnover time and accumulation of organic matter in bulk and density fractions of a Podzol soil, Eur. J. Soil Sci., 60, 567–577, 2009. 9952
Seeber, J. and Seeber, G. U. H.: Effects of land-use changes on humus forms on alpine
pas-15
tureland (Central Alps, Tyrol), Geoderma, 124, 215–222, 2005. 9961
Six, J., Elliott, E. T., Paustian, K., and Doran, J. W.: Aggregation and Soi Organic Matter Accumulation in Cultivated and Native Grassland Soils, Soil Sci. Soc. Am. J., 62, 1367– 1376, 1998. 9946
Six, J., Bossuyt, H., Degryze, S., and Denef, K.: A history of research on the link between
20
(micro)aggregates, soil biota, and soil organic matter dynamics, Soil Tillage Res., 79, 7–31, 2004. 9959
Steffens, M., K ¨olbl, A., and K ¨ogel-Knabner, I.: Alteration of soil organic matter pools and ag-gregation in semi-arid steppe topsoils as driven by organic matter input, Eur. J. Soil Sci., 60, 198–212, 2009. 9954
25
Steffens, M., K ¨olbl, A., Schork, E., Gschrey, B., and K ¨ogel-Knabner, I.: Distribution of soil organic matter between fractions and aggregate size classes in grazed semiarid steppe soil profiles, Plant Soil, 338, 63–81, 2011. 9945, 9947, 9954, 9959
Stuiver, M. and Polach, H. A.: Discussion: Reporting of14C Data, Radiocarbon, 19, 355–363, 1977. 9950
30
Stuiver, M., Reimer, P. J., and Braziunas, T. F.: High-precision radiocarbon age calibration for terrestrial and marine samples, Radiocarbon, 40, 1127–1151, 1998. 9951
BGD
8, 9943–9976, 2011Free and protected soil organic carbon dynamics respond
S. Meyer et al.
Title Page
Abstract Introduction
Conclusions References
Tables Figures
◭ ◮
◭ ◮
Back Close
Full Screen / Esc
Printer-friendly Version Interactive Discussion
Discussion
P
a
per
|
Dis
cussion
P
a
per
|
Discussion
P
a
per
|
Discussio
n
P
a
per
|
and Ganio, L.: Initial characterization of processes of soil carbon stabilization using forest stand-level radiocarbon enrichment, Geoderma, 128, 52–62, 2005. 9956
Tappeiner, U., Tasser, E., Leitinger, G., Cernusca, A., and Tappeiner, G.: Effects of Historical and Likely Future Scenarios of Land Use on Above- and Belowground Vegetation Carbon Stocks of an Alpine Valley, Ecosystems, 11, 1383–1400, 2008. 9945, 9946
5
Tasser, E. and Tappeiner, U.: Impact of land use changes on mountain vegetation, Appl. Veg. Sci., 5, 173–184, 2002. 9945
Tasser, E., Tappeiner, U., and Cernusca, A.: Ecological Effects of Land-use Changes in the European Alps, in: Global Change and Mountain Regions, edited by Huber, U. M., Bugmann, H. K. M., and Reasoner, M. A., 409–420, Springer, Netherlands, 2005. 9945
10
Tisdall, J. M. and Oades, J. M.: Organic matter and water-stable aggregates in soils, Eur. J. Soil Sci., 33, 141–163, 1982. 9959
Torn, M. S., Swanston, C. W., Castanha, C., and Trumbore, S. E.: Storage and Turnover of Or-ganic Matter in Soil, in: Biophysico-Chemical Processes Involving Natural Nonliving OrOr-ganic Matter in Environmental Systems, edited by: Senesi, N., Xing, B., and Huang, P. M., John
15
Wiley & Sons, 2009. 9945, 9946, 9947, 9951, 9962
Trumbore, S. E.: Radiocarbon and Soil Carbon Dynamics, Annu. Rev. Earth Planet. Sci., 37, 47–66, 2009. 9946
Trumbore, S. E., Chadwick, O. A., and Amundson, R.: Rapid Exchange between Soil Carbon and Atmospheric Carbon Dioxide Driven by Temperature Change, Science, 272, 393–396,
20
1996. 9960
Vittoz, P., Randin, C., Dutoit, A., Bonnet, F., and Hegg, O.: Low impact of climate change on subalpine grasslands in the Swiss Northern Alps, Global Change Biol., 15, 209–220, 2008. 9960
von L ¨utzow, M., K ¨ogel-Knabner, I., Ekschmitt, K., Flessa, H., Guggenberger, G., Matzner,
25
E., and Marschner, B.: SOM Fractionation methods: Relevance to functional pools and to stabilization mechanisms, Soil Biol. Biochem., 39, 2183–2207, 2007. 9945
Wardle, D. A., Bardgett, R. D., Klironomos, J. N., Setl, H., van der Putten, W. H., and Wall, D. H.: Ecological Linkages Between Aboveground and Belowground Biota, Science, 304, 1629–1633, 2004. 9947
30
Webster, R.: Statistics to support soil research and their presentation, Eur. J. Soil Sci., 52, 331–340, 2001. 9954
BGD
8, 9943–9976, 2011Free and protected soil organic carbon dynamics respond
S. Meyer et al.
Title Page
Abstract Introduction
Conclusions References
Tables Figures
◭ ◮
◭ ◮
Back Close
Full Screen / Esc
Printer-friendly Version Interactive Discussion
Discussion
P
a
per
|
Dis
cussion
P
a
per
|
Discussion
P
a
per
|
Discussio
n
P
a
per
|
Management Response Curves: Estimates of Temporal Soil Carbon Dynamics, Environ. Manag., 33, 507–518, 2004. 9961
Wohlfahrt, G., Anderson-Dunn, M., Bahn, M., Balzarolo, M., Berninger, F., Campbell, C., Car-rara, A., Cescatti, A., Christensen, T., Dore, S., Eugster, W., Friborg, T., Furger, M., Gianelle, D., Gimeno, C., Hargreaves, K., Hari, P., Haslwanter, A., Johansson, T., Marcolla, B.,
Mil-5
ford, C., Nagy, Z., Nemitz, E., Rogiers, N., Sanz, M., Siegwolf, R., Susiluoto, S., Sutton, M., Tuba, Z., Ugolini, F., Valentini, R., Zorer, R., and Cernusca, A.: Biotic, Abiotic, and Man-agement Controls on the Net Ecosystem CO2Exchange of European Mountain Grassland Ecosystems, Ecosystems, 11, 1338–1351, 2008a. 9961
Wohlfahrt, G., Hammerle, A., Haslwanter, A., Bahn, M., Tappeiner, U., and Cernusca, A.:
10
Seasonal and inter-annual variability of the net ecosystem CO2 exchange of a temperate mountain grassland: Effects of weather and management, J. Geophys. Res., 113, D08110, doi:10.1029/2007JD009286, 2008b. 9962
Zeller, V., Bahn, M., Aichner, M., and Tappeiner, U.: Impact of land-use change on nitrogen mineralization in subalpine grasslands in the Southern Alps, Biol. Fertil. Soils, 31, 441–448,
15
2000. 9961
Zeller, V., Bardgett, R. D., and Tappeiner, U.: Site and management effects on soil microbial properties of subalpine meadows: a study of land abandonment along a north-south gradient in the European Alps, Soil Biol. Biochem., 33, 639–649, 2001. 9945
Zimmermann, P., Tasser, E., Leitinger, G., and Tappeiner, U.: Effects of land-use and land-cover
20