Q
10
of Soil Respiration in Two Warm Temperate Forests
Junwei Luan1, Shirong Liu1*, Jingxin Wang2, Xueling Zhu3
1The Research Institute of Forest Ecology, Environment and Protection, Chinese Academy of Forestry, Key Laboratory of Forest Ecology and Environment, China’s State Forestry Administration, Beijing, PR China,2West Virginia University, Division of Forestry and Natural Resources, Morgantown, West Virginia, United States of America, 3Baotianman Natural Reserve Administration, Tuandong, Chengguan Town, Neixiang County, Henan Province, PR China
Abstract
A range of factors has been identified that affect the temperature sensitivity (Q10values) of the soil-to-atmosphere CO2flux.
However, the factors influencing the spatial distribution of Q10values within warm temperate forests are poorly understood.
In this study, we examined the spatial variation of Q10values and its controlling factors in both a naturally regenerated oak
forest (OF) and a pine plantation (PP). Q10values were determined based on monthly soil respiration (RS) measurements at
35 subplots for each stand from Oct. 2008 to Oct. 2009. Large spatial variation of Q10values was found in both OF and PP,
with their respective ranges from 1.7 to 5.12 and from 2.3 to 6.21. In PP, fine root biomass (FR) (R = 0.50,P =0.002), non-capillary porosity (NCP) (R = 0.37,P =0.03), and the coefficients of variation of soil temperature at 5 cm depth (CV of T5) (R =20.43, P =0.01) well explained the spatial variance of Q10. In OF, carbon pool lability reflected by light fractionation method (LLFOC) well explained the spatial variance of Q10 (R =20.35, P =0.04). Regardless of forest type, LLFOC and FR correlation with the Q10values were significant and marginally significant, respectively; suggesting a positive relationship
between substrate availability and apparent Q10 values. Parameters related to gas diffusion, such as average soil water
content (SWC) and NCP, negatively or positively explained the spatial variance of Q10values. Additionally, we observed
significantly higher apparent Q10values in PP compared to OF, which might be partly attributed to the difference in soil
moisture condition and diffusion ability, rather than different substrate availabilities between forests. Our results suggested that both soil chemical and physical characters contributed to the observed large Q10value variation.
Citation:Luan J, Liu S, Wang J, Zhu X (2013) Factors Affecting Spatial Variation of Annual Apparent Q10of Soil Respiration in Two Warm Temperate Forests. PLoS
ONE 8(5): e64167. doi:10.1371/journal.pone.0064167
Editor:Ben Bond-Lamberty, DOE Pacific Northwest National Laboratory, United States of America
ReceivedFebruary 3, 2013;AcceptedApril 9, 2013;PublishedMay 22, 2013
Copyright:ß2013 Luan et al. This is an open-access article distributed under the terms of the Creative Commons Attribution License, which permits unrestricted use, distribution, and reproduction in any medium, provided the original author and source are credited.
Funding:This study was jointly funded by the Ministry of Finance (numbers 200804001 and 201104006), China’s National Natural Science Foundation (30590383; 31200370), the Ministry of Science and Technology (2011CB403205, 2008DFA32070, 2006BAD03A04), and CFERN & GENE Award Funds on Ecological Paper. The funders had no role in study design, data collection and analysis, decision to publish, or preparation of the manuscript.
Competing Interests:The authors have declared that no competing interests exist.
* E-mail: liusr@caf.ac.cn (SL)
Introduction
Soils are the largest carbon pool in the terrestrial ecosystem, estimated to contain almost three times as much carbon as the atmosphere between the depths of 0–300 cm of soil [1,2]. This value is much higher if northern permafrost regions are also considered [3]. Annual CO2efflux from soil respiration (RS), the
second largest terrestrial carbon flux, is ten times higher than CO2
efflux from fossil burning [4,5]. RSis also probably the least well
constrained component of the terrestrial carbon cycle [6]. Thus, the response of RS to climate change, which usually is called
apparent temperature sensitivity of RS(Q10value) and estimated
based on empirical functions, is of importance in predicting possible feedbacks between the global carbon cycle and the climate system [7]. Recently, the efficiency and accuracy of RSestimation
based on apparent Q10values and the method used to estimate
Q10 values [7,8], has been widely debated [9]. Nevertheless,
empirical response functions are still a valid method to derive annual estimates of RSbased on specific field measurements (e.g.
Savage et al. [10]), particularly when it is not limited by water content and the simulation is made through interpolation rather than extrapolation [11].
The Q10of RShas been a focus of RSresearch and is widely
reported in the literature. Soil moisture condition has been suggested to be a factor that affects Q10 [12–14]. However, a
positive [14] or a topographic position dependent [13] relationship between soil moisture and Q10has been reported. Davidson and
Janssens [15] pointed out that soil moisture could exert a secondary effect on apparent Q10 due to its interaction with
substrate availability [16]. The seasonal change in autotrophic respiration, which is driven by the strong seasonality in tree below ground C allocation, could also influence the variability in apparent Q10values [17,18]. Thus annual and seasonal variations
of Q10values have been widely reported [14,19]. Furthermore, the
relationship between soil organic matter (SOM) quality and temperature sensitivity of organic matter decomposition has been extensively studied recently [7,8]. Whether SOM of different quality has similar [20–22] or different temperature sensitivities has also been debated [23–25].
The variability of temperature sensitivity among ecosystems has been reported, accounting for substrate quality [23], climate factors [26], or different range of temperature used to estimate Q10
[14,29]. Spatial variation of RShas been discussed, e.g., in boreal
forest [30]; tropical rainforest [31]; as well as savanna ecosystem [32]. However, direct field evidence of factors affecting the spatial variation of apparent Q10 values within plots has not been fully
investigated, and it is still ambiguous whether variation is attributed to the spatial distribution of SOM quality or soil microclimate.
In this study, both a natural regenerated oak forest (OF) and a nearby artificially regenerated pine plantation (PP) were chosen in warm temperate China, to determine characteristics of spatial variability of apparent Q10 values within plot at locations in a
10 m610 m grid based on RS field measurements. Our specific
objectives were to 1) identify the spatial variation of Q10values in
both OF and PP; and 2) determine factors correlated with spatial variability of Q10values within each plot.
Materials and Methods
Study Sites and Experimental Design
The study sites were located at the Forest Ecological Research Station in the Baotianman Natural Reserve (111u479–112u049E, 33u209–33u369N), Henan Province, PR. China. Baotianman Natural Reserve Administration (Neixiang County, Henan Prov-ince) issued the permission for our experimental sites. The average elevation is 1400 m, with an annual mean precipitation and air temperature of 900 mm and 15.1uC, respectively. Precipitation occurs mainly in summer, accounting for 55–62% of the annual total [33]. Upland soils are dominated by mountain yellow brown soils (Chinese classification). The OF stand was dominated by Quercus aliena var. acuteserrata, while the nearby PP stand was dominated by Pinus armandii Franch (for detailed information of these two stands see Luan et al. [34]). No intensive management was conducted in the PP since its establishment. One 40 m660 m
study plot was delineated in each stand with an average slope of
,8u. Within each plot, a 10 m610 m square grid was then placed
and 35 subplots (1 m61 m) were positioned at each intersection of
the grid. PVC collars (19.6 cm inside diameter) were installed at each subplot in September 2008 and were kept on the site throughout the study period.
Soil Respiration, Microclimate Measurements, and Q10 Calculation
Soil respiration measurements were conducted for a total of 12 (OF, measurement on 19 May, 2009 was canceled due to rain event) and 13 (PP) measurement campaigns using a Li-8100 soil CO2flux system (LI-COR Inc., Lincoln, NE, USA), from October
2008 to October 2009 avoiding snow cover period (9 and 17 Oct., 1 and 11 Nov. of 2008; 19 Mar., 7 and 17 Apr., 19 May., 2 and 23 Jun., 2 Aug., 19 Sept., and 19 Oct. of 2009). Sampling was performed between 9:00 and 15:00 (GMT +8:00). Soil tempera-ture at 5 cm (T5) was measured adjacent to each respiration collar
with a portable temperature probe provided with the Li-8100. Soil volumetric water content (SWC) at 0–5 cm was measured with a portable time domain reflectometer MPKit-B soil moisture gauge (NTZT Inc., Nantong, China) at three points close to each chamber. We avoided early morning and post-rain measurements to reduce the possible effect of rapid transition on the soil respiration rate during the observations.
An exponential equation (Eqn (1)) was used to describe the temporal relationship between RSand T5for each subplot (n = 12
for OF; or 13 for PP):
RS~aebT5 ð1Þ
where RSis soil respiration; T5 is the soil temperature at 5 cm depth; and a and b are fitted parameters. The temperature sensitivity parameter, Q10of each subplot was calculated as:
Q10~e10b ð2Þ
Our analysis showed that one measurement fewer for OF compared to PP do not have significant impact on Q10estimation
(data were not shown).
The number of samples required to estimate the Q10of RSof
each stand at the 10% or 20% of its actual value at the 95% probability level was obtained using Eq. 3 described by Hammond and McCullagh [35]:
n~ taCV D
2
wheretais Student’s t with degrees of freedom (a= 0.05),CVis the
sample coefficient of variation derived from data obtained for this study, andDis allowable error of field sampling process.
Soil Properties, Root Biomass, and Carbon Pool Lability
Five soil samples were collected from the top 5 cm depth of the mineral soil next to each chamber using 100 ml (50.46 mm diameter, 50 mm height) sampling cylinders in August, 2009. Three soil samples were combined and used for mass-based measurements of soil organic carbon (SOC), total nitrogen (TN), and light fraction organic carbon (LFOC). The remaining two cylinder samples were used for analyses of bulk density (BD), total soil porosity (TP), capillary porosity and non-capillary porosity (NCP) on the basis of soil water-retention capacity [36]. Light fraction soil organic matter at a depth of 0–10 cm was obtained by the density fractionation method proposed by Six et al. [37], but with a modification using CaCl2solution (density of 1.5 g ml2
1
; Garten et al. [38]). Bulk-soil and light-fraction organic carbon contents were determined by the wet oxidation method with 133 mM K2Cr2O7at 170–180uC [39]. In August 2009, roots were
extracted from 0–30 cm fresh soil samples by two cores (10 cm diameter) located close to the collars. The samples were washed; coarse (.5 mm), medium (2–5 mm), and fine (,2 mm) roots were manually separated and then their dry biomass (70uC, 24 hours) was measured. We found that stand structure parameters (total basal area, maximum DBH for trees within 4 m (radius) of the measurement points) well explained the spatial distribution of fine root biomass [34], which indicated that the spatial pattern of fine root biomass is comparably stable, because stand structure is relatively stable for an ecosystem in a given time. The leaf area index (LAI) was measured above each subplot using hemispherical photographs with WinSCANOPY (Regent Instruments Inc., Quebec, Canada) in August 2009.
The term ‘lability’ of SOC was defined as the ratio of the oxidized to non-oxidized SOC [40]. We applied this definition to the density fractionation method, and calculated subplot carbon pool lability (LLFOC) as described by Luan et al. [41]:
LLFOC~
LFOC
SOC{LFOC ð3Þ
Statistical Analysis
Descriptive statistics (mean, range, standard deviation (SD) and coefficient of variation (CV)) were used to show the characteristics of the spatial variability of RS, Q10, and soil parameters.
Variogram computations were also performed to determine the strength and scale of the spatial variability of Q10 and soil
parameters. The spatial variability was quantified by the semivariance (c (h)). The semivariance of any parameter z is computed as:
c(h)~ 1
2n(h) Xn
x~1
(zx{zxzh)2 ð4Þ
wheren(h) is the number of lag pairs at distance intervals ofhand zx and zx+h are the values of the variable z at x and x+h, respectively. Plottingc(h) against h gives the semivariogram, which will exhibit either purely random behavior or systematic behavior described by a theoretical model (linear, spherical, gaussian or power law distribution). The nugget, sill, range and structural variance (Q) parameters were obtained from the model with the best fit to the semivariance data. Geostatistical analyses were performed with GS+(Geostatistics for the Environmental Scienc-es, v.5.1.1, Gamma Design Software, Plainwell, MI).
Pearson correlations were performed to assess factors (soil moisture, seasonal CV of T5and SWC, LFOC,LLFOC, FR, NCP) controlling spatial variation of Q10values among subplots for each
forest (n = 35) or pooled data of two forests (n = 70). Geostatistical analyses showed that Q10values and soil parameters were spatially
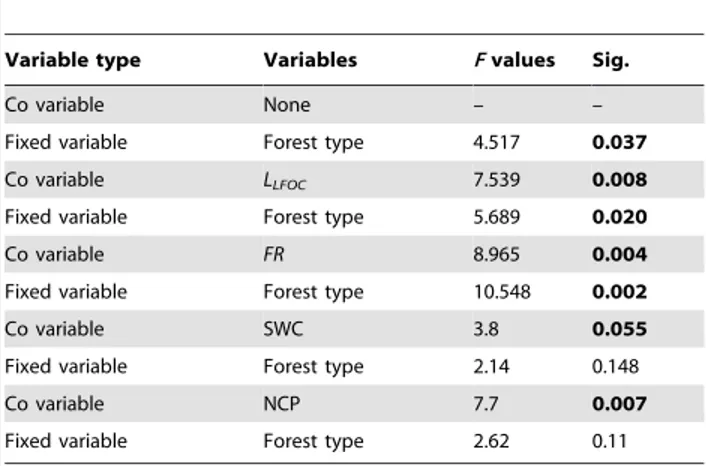
independent (Fig. 1). This allowed us to treat our measurement locations as independent samples for inferential statistics. There-fore, general linear models (GLM) were employed to examine the effect of forest type on Q10 values, where LLFOC, FR, SWC (averaged over 12 or 13 measurement campaigns), and NCP were included in the model as co-variables, respectively. Statistical analyses were conducted using SPSS version 13.0 (SPSS Inc., Chicago, USA).
Results
Microclimate and Soil Parameters Variance within Plots
All the subplots experienced similar seasonal fluctuations of T5
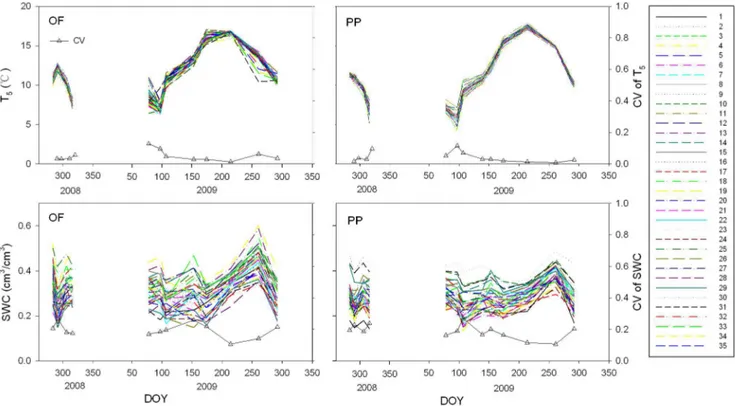
and SWC (Fig. 2). High spatial variation of SWC was found in all measurement campaigns (Fig. 2), with the CV of SWC ranging from 10.7% to 27.2% for PP and from 10.7% to 26% for OF (Fig. 2). Soil carbon and nitrogen contents at 5 cm depths, the C/ N ratio, soil bulk density, light fraction organic carbon, fine root biomass and soil carbon pool lability (LLFOC) for the OF and PP showed high spatial variation in the stand (Table 1). The semivariograms of LLFOC, FR, and NCP showed no change in semivariance with distance, indicating that they had no spatial autocorrelation in this scale (Fig. 1 a, b, d, f, g, i). Although averaged SWC had moderate spatial dependency, the ranges and sills observed were not precisely determined because the ranges were larger than the effective range of 43.27 m, which is equal to 60% of the maximum lag in the 10-m grids (Fig. 1 c, h).
Spatial Variation of Q10 Values
Exponential equation well described the relationship between RS and T5 for each subplot, and all the correlations were
significant at the P,0.05 (R2.0.34) level. The Q10values varied
considerably among subplots, ranging from 1.7 to 5.12 and 2.3 to 6.21 for the OF and the PP, respectively (Table 1). Among the Q10
values, 37.1% and 48.6% of them were between 4 and 5 for the
OF and the PP, respectively. Spatial distribution of Q10values for
both forests are shown in Figure 3. According to our power calculation, the number of measurements required to estimate the Q10of RSper stand within 10% or 20% of its actual value at the
0.05 probability level are 26 and 6 for OF, respectively, and 15 and 4 for PP. Geostatistical analyses showed that Q10values had
no spatial autocorrelation (Fig. 1e, 2j). The absence of autocor-relations among Q10values and soil parameters allowed us to treat
our measurement locations as independent samples for inferential statistics.
Controls on Q10 Variation
In PP, both FR and NCP were positively correlated with the Q10values, while CV of T5was negatively correlated with the Q10
values (Table 2). In OF, we found a significantly positive correlation between LLFOC and the Q10 values (P= 0.038;
Table 2). Regardless of forest type,LLFOCand NCP were positively correlated, while SWC was negatively correlated with Q10values
(Table 2). No significant correlations between seasonal CV of SWC and Q10were found for either forest or pooled data of two
forests (Table 2). Significantly different Q10values between forests
was found (F= 4.517, P= 0.037; Table 3). However, significant difference in Q10values between OF and PP disappeared when
SWC or NCP was included as a co-variable in the GLM (Table 3).
Discussion
Spatial Variation of Q10Values within Plots
Although the average Q10values (3.80 and 4.25 for the OF and
the PP) in this study was within the range of Q10values reported in
other temperate forests [42,43], there was a large variation in Q10
values between subplots, such as 1.7–5.12 for the OF and 2.3–6.21 for the PP (see Table 1). Spatial variability in Q10 was also
reported in a managed Ponderosa pine(Pinus ponderosa)forest (1.2– 2.5; Xu and Qi [14]) and in a Japanese cedar(Cryptomeria japonica) plantation (1.3–3.2; Ohashi and Gyokusen [29]). This large variation of Q10values among subplots suggests a potential risk of
bias estimation of the soil respiration at a plot scale, which has not been adequately addressed. Similar estimates for soil respiration sampling have also been made in other studies. It was recommended to measure at least eight locations to stay within 20% of its actual value at the 95% confidence level in a mature beech forest [44]. Saiz et al. [45] also suggested that the sampling strategy of 30 sampling points per stand was adequate to obtain an average rate of soil respiration within 20% of its actual value at the 95% confidence level in four Sitka spruce stands.
Controlling Factors on Q10Variance
High spatial variance in soil moisture was found in both stands for most sampling dates (Figure 2), which could be attributed to the microtopography, the high spatial variability of soil organic matter content [34] and of root distribution (e.g. we found a significant negative correlation between SWC and fine root biomass R2= 0.16, P= 0.021, n = 35). Such a short scale soil moisture spatial variation have also been reported in other forests [29,46,47]. We even found a slight spatial autocorrelation for soil moisture (Fig. 1 d, i). It was reported that the high spatial variance of soil moisture exerted significant negative impact on soil respiration rate [34]. However, spatially, no significant impacts of soil moisture on Q10values were found for PP and OF (Table 2).
Q10calculation at a given plot level in this study. However, the
above mentioned influence was still found in PP where seasonal CV of T5 correlated significantly with Q10 values (Table 2).
Nevertheless, microclimate fluctuation difference can not fully
explain the spatial variability of Q10 values since no similar
significant correlations were found in OF or when we pooled data together for all measurements regardless of forest types (Table 2). Therefore, we posit that the spatial variation of Q10values among
Figure 1. Semivariograms of LLFOC(a, f), FR (b, g), SWC (c, h), NCP (d, i), and Q10(e, j) in 10-m grid squares of OF (left panel) and PP
(right panel), respectively.Model for SWC are exponential models. The SWC were averaged over the 12 (OF) or 13 (PP) measurement campaigns. doi:10.1371/journal.pone.0064167.g001
Table 1.Statistical analysis of soil parameters, fine root biomass, soil respiration rate, Q10values, and carbon pool lability (LLFOC)
for the oak forest and pine plantation.a
Parameters Oak forest Pine plantation
mean S.D. Range CV mean S.D. Range CV
RS(mmolm22s21) 2.12 0.58 1.16–4.17 0.27 2.01 0.44 1.07–3.16 0.22
Q10 3.80 0.95 1.7–5.12 0.25 4.25 0.81 2.30–6.21 0.19
SOC (g/kg soil) 78.90 18.49 47.50–117.58 0.23 77.94 24.63 45.88–153.89 0.32
TN (g/kg soil) 6.03 1.38 3.65–9.26 0.23 5.17 1.28 3.27–8.82 0.25
C:N (g/g) 13.08 0.61 11.76–15.45 0.05 14.92 1.30 12.69–18.02 0.09
BD (g/cm3) 0.71 0.138 0.42–0.96 0.19 0.69 0.121 0.49–1.00 0.17
LAI (m2/m2) 3.50 0.60 2.60–4.90 0.17 2.96 0.30 2.41–3.68 0.10
Averaged SWC (cm3cm23) 0.31 0.0495 0.233–0.437 0.16 0.28 0.045 0.215–0.421 0.16
Seasonal CV of T5 0.27 0.02 0.22–0.30 0.08 0.32 0.02 0.28–0.38 0.07
Seasonal CV of SWC 0.21 0.04 0.14–0.30 0.20 0.17 0.05 0.07–0.30 0.29
LFOC (g/kg soil) 30.55 12.22 16.85–64.17 0.40 28.57 20.53 7.53–101.17 0.72
LLFOC(g/g) 0.69 0.43 0.31–2.58 0.62 0.64 0.49 0.13–2.12 0.77
FR (g/m2) 223.40 76.80 31.04–330.94 0.34 164.45 61.07 69.45–298.32 0.37
NCP (m3/m3) 0.084 0.031 0.015–0.14 0.365 0.097 0.032 0.045–0.18 0.325
aS.D.: standard deviation; CV: coefficient of variance; R
S: soil respiration; SWC: soil water content; TOC: total organic carbon; TN: total nitrogen; LFOC: light fraction
organic carbon; FR: fine root biomass; BD: bulk density; LAI: leaf area index; NCP: non-capillary porosity.n =35. The soil respiration rates RSand SWC in this table were
subplots should be associated with other inherent characteristics of each subplot, i.e, spatial differences in substrate availability as suggested by [15]. Gershenson et al. [16] also found a positive relationship between substrate availability and temperature sensitivity.
In our study, fine root biomass well explained the Q10variance
in PP, and was marginally significantly correlated with Q10when
we pooled data of all forest types (Table 2). Since fine roots are
associated with the fast turnover carbon pool [48–50], the positive linear correlation between Q10 and FR implied the positive
relationship between Q10and lability of the substrate. It was also
reported that Q10 values may be related to seasonal change in
autotrophic respiration [17]. The correlations between fine root biomass and Q10may also imply there exists a connection between
Q10 and autotrophic respiration, i.e., the higher autotrophic
respiration was coincided with the higher fine root biomass in the Figure 2. Seasonal pattern of T5(up panel) and SWC (lower panel) for OF (left panel) and PP (right panel) for each subplot, as well
as the seasonal pattern of the CV (up triangle) of T5and SWC among subplots.
subplots. This inference was supported by our previous study as we found a similar positive correlation between FR and RS[34].
Light fraction organic carbon (LFOC), which has been widely recognized as a labile carbon indicator [51,52], is comprised largely of incompletely decomposed organic residues with turnover times of years to decades [53], thus the concentration of LFOC can indicate substrate supply quantity to some extent [34,54,55].
There was no correlation found between Q10and labile organic
carbon concentration (LFOC) as reflected by light fractionation (Table 2). Nevertheless, significant correlations between carbon pool lability (LLFOC) and Q10were found in OF as well as when we
pooled data together from all forest types (Table 2). This demonstrated that the carbon pool lability as reflected by light fractionation, which can partly stand for SOM quality [41], may Figure 3. Isarithmic maps of the Q10in the 10-m grids of OF and PP are shown in the top and bottom panels respectively,
interpolations were done by the inverse distance weighting method.White areas indicate high values and dark areas indicate low values. doi:10.1371/journal.pone.0064167.g003
Table 2.Pearson correlation coefficients between Q10and variables in spatially.
Independent
Variables Pine plantation Oak forest Pooled data of two forests
R Sig. (2-tailed) R Sig. (2-tailed) R Sig. (2-tailed)
LFOC 0.178 0.306 0.161 0.355 0.142 0.241
LLFOC 0.290 0.091 0.351 0.038 0.293 0.014
FR 0.497 0.002 0.240 0.165 0.207 0.086
SWC 20.213 0.219 20.246 0.155 20.290 0.015
NCP 0.369 0.029 0.282 0.101 0.355 0.003
CV of T5 20.426 0.011 20.245 0.157 20.010 0.932
CV of SWC 20.053 0.762 20.112 0.521 20.169 0.161
Abbreviations see Table 1. n = 35 for each forest, n = 70 for pooled data of two forest types. The SWC in this table were averaged over the 12 (OF) or 13 (PP) measurement campaigns.
exert more impact on Q10values compared to the concentration
of LFOC. This indicates a connection between the spatial distribution of SOM quality and the apparent Q10 as we
speculated.
Multi-pool soil C models have been employed to simulate changes in soil C stocks as a single, homogeneous soil C pool [56– 58], but the same Q10value for different carbon fractions have still
been applied. With increasing the understanding of temperature sensitivity of different soil organic carbon fractions [7–9]. Our findings on the connection between Q10values and C availability
among subplots suggest that different Q10values corresponding to
carbon fractions with different turn over times should be incorporated into soil carbon models.
Q10 Values between Stands
In our study, Q10values were significantly higher in the PP than
that in the OF (Table 3), which is consistent with Wang et al.’s [59] findings in Korean pine plantation vs.Mongolianoak forest. Although we found significant correlations betweenLLFOCand FR with Q10values, GLM showed that bothLLFOCand FR can not explain why the higher Q10occurred in the PP rather than in the
OF (Table 3). No significant difference in Q10values was found
between PP and OF when averaged SWC was included as co-variables in GLM, but GLM showed a marginally significant correlation between averaged SWC and Q10. This implied that
different soil moisture conditions accounted for different apparent Q10 values in the studied forests. Higher water content could
impede O2 diffusion, thereby reducing decomposition rates and
microbial production of CO2. In this case, the temperature
response of CO2efflux would be lower (i.e. a lower Q10value) in
wetter subplots than in dryer subplots, implying that the temperature response of CO2efflux would be lesser in wet years
than in dry years as Davidson et al [43] reported.
Furthermore, we speculate that effects of soil moisture conditions on Q10 may be partly attributed to different soil
physical characteristics, such as the soil non-capillary porosity, which is an important factor in relation to soil gas diffusion. This was confirmed by our analysis, which showed that there was no significant difference in Q10 values between PP and OF when
NCP was included as a co-variable, while there was a significant positive correlation between the spatial distribution of NCP and Q10 values (Table 3). This also indicated that the difference in
NCP between two forests resulted in the difference in Q10values.
Similarly, a weak spatial correlation between hardness (related to soil porosity) of the A layer and Q10 variation was reported by
Ohashi et al. [29]. Conant et al. [9] recently also suggested that the physico-chemical protection from decomposition of organic matter (OM) will affect temperature response of SOM. A negative correlation between averaged SWC and NCP (R=20.306, P= 0.01) in this study regardless of forest type also suggested that there was an interaction between soil moisture and porosity. Soil porosity could exert intense impacts on temperature sensitivity of RSin combination with soil moisture condition. Therefore, lower
Q10values in the OF compared to that in the PP may have been
partly caused by the higher soil moisture or lower NCP. In contrast, Xu and Qi [14] reported a positive correlation between Q10 values and soil moisture, with SWC values range
from 10% to 24%. In our study, however, SWC values were 0.23– 0.389 m/m3 for the PP and 0.241–0.451 m/m3 for the OF, respectively, which was higher than that reported by Xu and Qi [14]. This implies that there is a complex relationship between Q10
and soil moisture, which may result in contrasting effects. A marginal critical soil moisture condition may exist which determines a positive or negative relationship between Q10 and
soil moisture.
Conclusions
High spatial variances in apparent Q10values were found for
both forests. Parameters related to substrate availability and gas diffusion both exerted significant impact on the spatial variation of Q10 values within each stand. Higher Q10 values in the PP
compared to the OF were also found, which could be attributed to the difference in soil moisture conditions or NCP, rather than substrate availability. Our results suggested that the RSestimation
at stand level could be improved through considering the spatial variation of Q10values and its influencing factors.
Acknowledgments
We gratefully acknowledge the support of Yin Wu, Ye Tian, Xinfang Yang, Xiaojing Liu, and Jiguo Liu of the Baotianman National Nature Reserve for their assistance in field monitoring and sampling. We also thank Mr. Damon Hartley of West Virginia University for his valuable comments on the earlier versions of this manuscript. Special thanks also go to Dr. Ben Bond-Lamberty for his constructive comments and suggestions used to revise the manuscript.
Author Contributions
Conceived and designed the experiments: JL SL JW XZ. Performed the experiments: JL XZ. Analyzed the data: JL SL JW XZ. Contributed reagents/materials/analysis tools: JL SL XZ. Wrote the paper: JL SL JW XZ.
References
1. Jobba´gy EG, Jackson RB (2000) The Vertical Distribution of Soil Organic Carbon and its Relation to Climate and Vegetation. Ecological Applications 10: 423–436.
2. Schimel DS (1995) Terrestrial ecosystems and the carbon cycle. Global Change Biology 1: 77–91.
Table 3.General Linear Models for examine forest type effect on Q10values, where F test was conducted.LLFOC, FR, SWC
(averaged over 12 or 13 measurement campaigns), and NCP were taken as co-variables of the GLM respectively to examine which factor could exert influence on Q10value difference
between forest.
Variable type Variables Fvalues Sig.
Co variable None – –
Fixed variable Forest type 4.517 0.037
Co variable LLFOC 7.539 0.008
Fixed variable Forest type 5.689 0.020
Co variable FR 8.965 0.004
Fixed variable Forest type 10.548 0.002
Co variable SWC 3.8 0.055
Fixed variable Forest type 2.14 0.148
Co variable NCP 7.7 0.007
Fixed variable Forest type 2.62 0.11
Abbreviations see Table 1. None: No co-variable.
3. Tarnocai C, Canadell JG, Schuur EAG, Kuhry P, Mazhitova G, et al. (2009) Soil organic carbon pools in the northern circumpolar permafrost region. Global Biogeochemical Cycles 23: GB2023, doi:2010.1029/2008GB003327. 4. Raich JW, Potter CS (1995) Global Patterns of Carbon Dioxide Emissions from
Soils. Global Biogeochem Cycles 9: 23–36.
5. Hashimoto S (2012) A New Estimation of Global Soil Greenhouse Gas Fluxes Using a Simple Data-Oriented Model. PLoS ONE 7: e41962.
6. Bond-Lamberty B, Thomson AM (2010) A global database of soil respiration data. Biogeosciences 7: 1915–1926.
7. Davidson EA, Janssens IA, Luo Y (2006) On the variability of respiration in terrestrial ecosystems: moving beyond Q10. Global Change Biology 12: 154– 164.
8. Kirschbaum MUF (2006) The temperature dependence of organic-matter decomposition–still a topic of debate. Soil Biology & Biochemistry 38: 2510– 2518.
9. Conant RT, Ryan MG, A˚ gren GI, Birge HE, Davidson EA, et al. (2011) Temperature and soil organic matter decomposition rates – synthesis of current knowledge and a way forward. Global Change Biology 17: 3392–3404. 10. Savage K, Davidson EA, Richardson AD (2008) A conceptual and practical
approach to data quality and analysis procedures for high-frequency soil respiration measurements. Functional Ecology 22: 1000–1007.
11. Tang J, Bolstad PV, Martin JG (2009) Soil carbon fluxes and stocks in a Great Lakes forest chronosequence. Global Change Biology 15: 145–155. 12. Jassal RS, Black TA, Novak MD, Gaumont-Guay D, Nesic Z (2008) Effect of
soil water stress on soil respiration and its temperature sensitivity in an 18-year-old temperate Douglas-fir stand. Global Change Biology 14: 1305–1318. 13. Craine JM, Gelderman TM (2010) Soil moisture controls on temperature
sensitivity of soil organic carbon decomposition for a mesic grassland. Soil Biology and Biochemistry 43: 455–457.
14. Xu M, Qi Y (2001) Spatial and Seasonal Variations of Q10Determined by Soil Respiration Measurements at a Sierra Nevadan Forest. Global Biogeochem Cycles 15: 687–696.
15. Davidson EA, Janssens IA (2006) Temperature sensitivity of soil carbon decomposition and feedbacks to climate change. Nature 440: 165–173. 16. Gershenson A, Bader NE, Cheng W (2009) Effects of substrate availability on
the temperature sensitivity of soil organic matter decomposition. Global Change Biology 15: 176–183.
17. Ho¨gberg P (2010) Is tree root respiration more sensitive than heterotrophic respiration to changes in soil temperature? New Phytologist 188: 9–10. 18. Ho¨gberg MN, Briones MJI, Keel SG, Metcalfe DB, Campbell C, et al. (2010)
Quantification of effects of season and nitrogen supply on tree below-ground carbon transfer to ectomycorrhizal fungi and other soil organisms in a boreal pine forest. New Phytologist 187: 485–493.
19. Chen B, Liu S, Ge J, Chu J (2010) Annual and seasonal variations of Q10soil respiration in the sub-alpine forests of the Eastern Qinghai-Tibet Plateau, China. Soil Biology & Biochemistry 42: 1735–1742.
20. Fang C, Smith P, Moncrieff JB, Smith JU (2005) Similar response of labile and resistant soil organic matter pools to changes in temperature. Nature 433: 57–59. 21. Reichstein M, Ka¨tterer T, Andre´n O, Ciais P, Schulze ED, et al. (2005) Does the temperature sensitivity of decomposition vary with soil organic matter quality? Biogeosciences Discuss 2: 737–747.
22. Reichstein M, Subke J-A, Angeli AC, Tenhunen JD (2005) Does the temperature sensitivity of decomposition of soil organic matter depend upon water content, soil horizon, or incubation time? Global Change Biology 11: 1754–1767.
23. Fierer N, Craine JM, McLauchlan K, Schimel JP (2005) Litter Quality and the temperature Sensitivity of Decomposition. Ecology 86: 320–326.
24. Conant RT, Drijber RA, Haddix ML, Parton WJ, Paul EA, et al. (2008) Sensitivity of organic matter decomposition to warming varies with its quality. Global Change Biology 14: 1–10.
25. Hartley IP, Ineson P (2008) Substrate quality and the temperature sensitivity of soil organic matter decomposition. Soil Biology & Biochemistry 40: 1567–1574. 26. Peng S, Piao S, Wang T, Sun J, Shen Z (2009) Temperature sensitivity of soil respiration in different ecosystems in China. Soil Biology and Biochemistry 41: 1008–1014.
27. Dalias P, Anderson JM, Bottner P, Couteaux M-M (2001) Temperature responses of carbon mineralization in conifer forest soils from different regional climates incubated under standard laboratory conditions. Global Change Biology 7: 181–192.
28. Mahecha MD, Reichstein M, Carvalhais N, Lasslop G, Lange H, et al. (2010) Global Convergence in the Temperature Sensitivity of Respiration at Ecosystem Level. Science 329: 838–840.
29. Ohashi M, Gyokusen K (2007) Temporal change in spatial variability of soil respiration on a slope of Japanese cedar (Cryptomeria japonica D. Don) forest. Soil Biology & Biochemistry 39: 1130–1138.
30. Khomik M, Arain MA, McCaughey JH (2006) Temporal and spatial variability of soil respiration in a boreal mixedwood forest. Agricultural and Forest Meteorology 140: 244–256.
31. Metcalfe D, Meir P, Araga˜o LEOC, da Costa A, Almeida S, et al. (2008) Sample sizes for estimating key ecosystem characteristics in a tropical terra firme rainforest. Forest Ecology and Management 255: 558–566.
32. Tang J, Baldocchi DD (2005) Spatial-temporal variation in soil respiration in an oak-grass savanna ecosystem in California and its partitioning into autotrophic and heterotrophic components. Biogeochemistry 73: 183–207.
33. Liu S, Jiang Y, Shi Z (1998) Overview of the Baotianman Nature Reserve. A study on the Biological Diversity in Warm Temperate Forest in China. Beijing: China Science and Technology Press. 45.
34. Luan J, Liu S, Zhu X, Wang J, Liu K (2012) Roles of biotic and abiotic variables in determining spatial variation of soil respiration in secondary oak and planted pine forests. Soil Biology & Biochemistry 44: 143–150.
35. Hammond R, McCullagh PS (1978) Quantitative Techniques in Geography. UK: Clarendon Press.
36. Liu X, Zhang G, Heathman GC, Wang Y, Huang C-h (2009) Fractal features of soil particle-size distribution as affected by plant communities in the forested region of Mountain Yimeng, China. Geoderma 154: 123–130.
37. Six J, Elliott ET, Paustian K, Doran JW (1998) Aggregation and soil organic matter accumulation in cultivated and native grassland soils. Soil Science Society of American Journal 62: 1367–1377.
38. Garten CT, Post WM, Hanson PJ, Cooper LW (1999) Forest soil carbon inventories and dynamics along an elevation gradient in the southern Appalachian Mountains. Biogeochemistry 45: 115–145.
39. Lu R (2000) Soil and Agricultural Chemistry Analysis Methods (In Chinese). Beijing: Chinese Agricultural Scientific and Technology Press
40. Blair GJ, Lefroy RDB, Lisle L (1995) Soil carbon fractions based on their degree of oxidation and the development of a carbon management index. Australian Journal of Agricultural Research 46: 1459–1466.
41. Luan J, Xiang C, Liu S, Luo Z, Gong Y, et al. (2010) Assessments of the impacts of Chinese fir plantation and natural regenerated forest on soil organic matter quality at Longmen mountain, Sichuan, China. Geoderma 156: 228–236. 42. Kirschbaum MUF (1995) The temperature dependence of soil organic matter
decomposition, and the effect of global warming on soil organic C storage. Soil Biology & Biochemistry 27: 753–760.
43. Davidson EA, Belk E, Boone RD (1998) Soil water content and temperature as independent or confounded factors controlling soil respiration in a temperate mixed hardwood forest. Global Change Biology 4: 217–227.
44. Knohl A, Søe AB, Kutsch W, Go¨ckede M, Buchmann N (2008) Representative estimates of soil and ecosystem respiration in an old beech forest. Plant and Soil 302: 189–202.
45. Saiz G, Green C, Butterbach-Bahl K, Kiese R, Avitabile V, et al. (2006) Seasonal and spatial variability of soil respiration in four Sitka spruce stands. Plant and Soil 287: 161–176.
46. Kosugi Y, Mitani T, Itoh M, Noguchi S, Tani M, et al. (2007) Spatial and temporal variation in soil respiration in a Southeast Asian tropical rainforest. Agricultural and Forest Meteorology 147: 35–47.
47. Søe ARB, Buchmann N (2005) Spatial and temporal variations in soil respiration in relation to stand structure and soil parameters in an unmanaged beech forest. Tree Physiology 25: 1427–1436.
48. Jackson RB, Mooney HA, Schulze ED (1997) A global budget for fine root biomass, surface area, and nutrient contents. Proceedings of the National Academy of Sciences 94: 7362–7366.
49. Gill RA, Jackson RB (2000) Global patterns of root turnover for terrestrial ecosystems. New Phytologist 147: 13–31.
50. Matamala R, Gonza`lez-Meler MA, Jastrow JD, Norby RJ, Schlesinger WH (2003) Impacts of Fine Root Turnover on Forest NPP and Soil C Sequestration Potential. Science 302: 1385–1387.
51. Henry HAL, Juarez JD, Field CB, Vitousek PM (2005) Interactive effects of elevated CO2, N deposition and climate change on extracellular enzyme activity and soil density fractionation in a California annual grassland. Global Change Biology 11: 1808–1815.
52. Erika Marin-Spiotta WLSCWSRO (2009) Soil organic matter dynamics during 80 years of reforestation of tropical pastures. Global Change Biology 15: 1584– 1597.
53. Janzen HH, Campbell CA, Brandt SA, Lafond GP, Townley-Smith L (1992) Light fraction organic matter in soils from long term crop rotations. Soil Science Society of America Journal 56: 1799–1806.
54. Laik R, Kumar K, Das DK, Chaturvedi OP (2009) Labile soil organic matter pools in a calciorthent after 18 years of afforestation by different plantations. Applied Soil Ecology 42: 71–78.
55. Luan J, Liu S, Zhu X, Wang J (2011) Soil carbon stocks and fluxes in a warm-temperate oak chronosequence in China. Plant and Soil 347: 243–253. 56. Powlson D (2005) Climatology: Will soil amplify climate change? Nature 433:
204–205.
57. Jones C, McConnell C, Coleman K, Cox P, Falloon P, et al. (2005) Global climate change and soil carbon stocks; predictions from two contrasting models for the turnover of organic carbon in soil. Global Change Biology 11: 154–166. 58. A˚ gren GI, Bosatta E (1998) Theoretical Ecosystem Ecology-Understanding
Element Cycles. Cambridge: Cambridge Univ. Press.