Elevated Alanine Aminotransferase Is Strongly
Associated with Incident Metabolic Syndrome: A
Meta-Analysis of Prospective Studies
Zhengtao Liu1., Shuping Que2,3., Huaijun Ning2
, Linlin Wang3, Tao Peng1*.
1Department of Hepatobiliary Surgery, First Affiliated Hospital of Guangxi Medical University, Nanning, Guangxi Province, China,2Department of Pediatrics, Women and children’s hospital of Guangxi, Nanning, Guangxi Province, China,3Department of Pediatrics, First Affiliated Hospital of Guangxi Medical University, Nanning, Guangxi Province, China
Abstract
Background:The incidence of metabolic syndrome (MetS) is rapidly increasing worldwide and associated with alanine aminotransferase (ALT) activity. However, the impact of ALT activity on MetS incidence is inconsistent in published literature. We therefore estimated the association between elevated ALT activity and incident MetS through a meta-analysis of prospective cohort studies.
Methods/Principal Findings:All published prospective cohort studies on the association between elevated ALT activity and incident MetS were retrieved from Pubmed, Embase, and the Institute for Scientific Information (ISI). In all, seven prospective cohort studies, with 31545 participants and 2873 cases of incident MetS were recruited. If there was insignificant heterogeneity (P-value.0.05 and I2,50%), the fixed-effect model was used to calculate the pooled relative risks (RRs) of incident MetS induced by raised ALT. Otherwise, the random-effect model was used. The calculated RR was 1.81 (95% confidence interval [CI]: 1.49–2.14) when the incidence of MetS was compared between the highest versus the lowest classification of ALT activities. The pooled RR was 1.13 (95% CI: 1.11–1.16) in dose-response analysis with 5 units per liter (U/l) of ALT increment. Subgroup analysis suggested that gender disparity might be the main origin of heterogeneity in overall analysis (P = 0.007 between RRs of gender-specific subgroups evaluated with 5 U/l increments of ALT). Women had a higher dose-response risk of MetS incidence (1.38, 95% CI: 1.20–1.55) than men. Furthermore, sensitivity analysis confirmed the stability of results. No publication bias was found in our meta-analysis.
Conclusions/Significance:Current evidence from prospective studies supports the association between ALT elevation and increasing MetS incidence. This association is closer and more consistent in female population. Further studies are needed to confirm this association and to investigate the potential mechanism of ALT activity on MetS occurrence.
Citation:Liu Z, Que S, Ning H, Wang L, Peng T (2013) Elevated Alanine Aminotransferase Is Strongly Associated with Incident Metabolic Syndrome: A Meta-Analysis of Prospective Studies. PLoS ONE 8(12): e80596. doi:10.1371/journal.pone.0080596
Editor:Reury F.P. Bacurau, University of Sao Paulo, Brazil
ReceivedJune 28, 2013;AcceptedOctober 4, 2013;PublishedDecember 4, 2013
Copyright:ß2013 Liu et al. This is an open-access article distributed under the terms of the Creative Commons Attribution License, which permits unrestricted use, distribution, and reproduction in any medium, provided the original author and source are credited.
Funding:This work was supported in part by the National Nature Science Foundation of China (NSFC 81072321 and 30560133), 2009 Program for New Century Excellent Talents in University (NCET). The funders had no role in study design, data collection and analysis, decision to publish, or preparation of the manuscript.
Competing Interests:The authors have declared that no competing interests exist. * E-mail: [email protected]
.These authors contributed equally to this work.
Introduction
Metabolic syndrome (MetS) is a constellation of metabolic disorders including glucose intolerance, central obesity, dyslipi-daemia and hypertension [1]. In epidemiological surveys, MetS is associated with increased risk of incident cardiovascular diseases (CVD) [2], and diabetes [3]. Individuals with MetS had approximately a 45% higher all-cause mortality and a 78% higher coronary heart disease-induced deaths compared to individuals without MetS in previous meta-analyses [4,5]. Recently, MetS has caused a global epidemiological concern followed with the increasing prevalence of obesity [6] and sedentary behavior [7]. In addition, MetS was also found to be associated with insulin resistance in liver [8].
Alanine aminotransferase (ALT) is routinely measured in a useful screening assay for the detection of non-alcoholic fatty liver
disease (NAFLD) in the general population [9]. NAFLD, a manifestation of MetS in liver, is reportedly associated with insulin resistance [10]. Accordingly, ALT activity is associated with MetS through NAFLD. Several prospective studies have therefore been carried out to address the association between ALT activity and the risk of incident MetS in the general population [11–17]. However, the results have been inconsistent in the literature due to possible variations including ethnicity, gender, and the selection criteria for participants. Therefore, a meta-analysis was performed on several longitudinal studies to quantitatively evaluate the prospective association between ALT activity and incident MetS. A dose-response analysis was conducted on relative risks (RRs) of incident MetS and individual MetS components (including hyperglycemia, abdominal obesity, hypertriglyceridaemia, low high-density lipoprotein cholesterol [HDL-C] and hypertension)
caused by 5 units per liter (U/l) of ALT increments. Furthermore, we performed a subgroup analysis to assess the effects of potential confounders that might cause heterogeneity in meta-analysis. To the extent of our knowledge, this is the first meta-analysis to assess the risk of MetS incidence caused by ALT elevation.
Methods
PRISMA and Flow Diagram
Meta-analysis was conducted according to the guidelines of the Preferred Reporting Items for Systematic Reviews and Meta-Analyses (PRISMA) [18]. The supporting PRISMA checklist and flow diagram for this meta-analysis is available as supporting information; see Checklist S1 and Flow Diagram S1, respectively.
Search Strategy, Study Selection and Data Extraction Extensive literature retrieval was performed in Pubmed, Embase and the All Database of Institute for Scientific Informa-tion (ISI) without language restricInforma-tions (last updated at Aug 10, 2013). The search was restricted to studies conducted in human subjects. The medical subject headings ‘‘alanine aminotransfer-ase’’, ‘‘ALT’’, and ‘‘metabolic syndrome’’ were used for searching the relevant literature. The following search strategy was applied in Pubmed: (alanine aminotransferase [MeSH] OR alanine aminotransferase [All Fields] OR ALT [All Fields]) AND (metabolic syndrome [MeSH] OR metabolic syndrome [All Fields]). A similar strategy was applied to Embase and ISI. In addition, a manual search of citations from relevant original studies and review articles was performed. Our meta-analysis was performed in accordance with the Meta-analysis Of Observational Studies in Epidemiology (MOOSE) guidelines [19]. Only reports fulfilling the following inclusion criteria were recruited in the meta-analysis: 1) Prospective cohort studies were published as original articles; 2) ALT baseline activities were reported and MetS was an end point; 3) participants with MetS at baseline were excluded completely; and 4) Studies that contained the RR of incident MetS associated with ALT activity and the corresponding 95% confidence interval (CI) were provided or obtained by calculation. Two authors independently extracted the information using a standardized protocol and reporting form. The agreement was measured using Cohen’s Kappa [20] and discrepancies were resolved by discussion and consensus. Study characteristics were recorded as: first author, publication year, country of origin, and clinical characteristics (numbers of participants/cases, gender category, age range of populations, statistics of comparison, durations of follow-up, diagnostic criteria of MetS, the most fully adjusted RRs of MetS, individual MetS component estimated from multivariable analysis, and study-specific adjusted covari-ates). When effects estimated in the same population were reported in different up durations, only data with the longest follow-up duration were included.
Quality Assessment
The quality of each study was assessed through two authors independently using the Newcastle-Ottawa Scale (NOS) [21]. The NOS consists of three parameters of quality: selection, compara-bility, and outcome for cohort studies (Table 1). The NOS assigned a maximum of four stars for selection, two stars for comparability, and three stars for outcome; therefore, nine stars reflected the highest quality. Studies with.6 stars were considered high in quality. When discrepancies occurred, a joint revaluation of the original article was performed with a third author.
Statistical Analysis
RR was chosen to estimate the association between ALT and incident MetS. Heterogeneity between studies was evaluated by the Chi-square-based Q test and I2test with the use of Stata metan [22]. If there was no significant heterogeneity (P-value.0.05 and I2
,50%), the fixed-effect model will be chosen to estimate the overall RR and 95% CI. Otherwise, the random-effect model will be used. First, combined RRs of MetS were calculated between the highest and lowest categories of ALT activities adjusted for the most potentially confounding covariates (overall and stratified by diagnostic criteria). In addition, the dose-response association between the risks of incident MetS per 5 U/l increment of ALT activity was estimated (overall and stratified by diagnostic criteria) according to reported data (categories of ALT activities on median dose, number of cases and participants, and effect estimation with corresponding standard errors) using a method previously proposed [23,24]. Median or mean values in data of different studies were presented according to the different categories of ALT activities. When this information was unreported, the midpoints of the upper and lower boundaries were assigned as the approximate medians. When the highest category was open-ended, the lower end value of the category multiplied by 1.2 was assigned [25]. In addition, the combined RRs per standard deviation (SD) increment of logALT activity in two studies [12,15] were analyzed. Meanwhile, pooled RRs of detailed incident individual MetS components per SD increment of logALT activity were evaluated based on data from two studies [12,15]. Furthermore, analysis was performed in subgroups classified by gender, mean age (the midpoint of the upper and lower boundaries of age when not given in literature), race/ethnicity, follow-up duration, sample size of study population, number of adjusted covariates, difference of selection criteria (including whether diabetics were excluded, and whether diabetics were deliberately included), adjustment of gamma-glutamyltransferase (GGT) or alcohol intake as covariates. The degree of inconsistency among studies (I2) was estimated through scores of 25, 50, and 75%, representing low, moderate, or high inconsistency respec-tively [26].
Finally, we performed a sensitivity analysis to evaluate the influence of a single study on the overall effect estimate by omitting one study at a time with metainf [27]. Begg’s funnel plot and Egger’s test were used to evaluate publication bias with metabias [28]. A P-value,0.05 was considered as significant. The meta-analysis including metan, metainf, and metabias command was performed by Stata 12.0 software (Stata Corp, College Station, TX, USA).
Results
Literature Retrieval
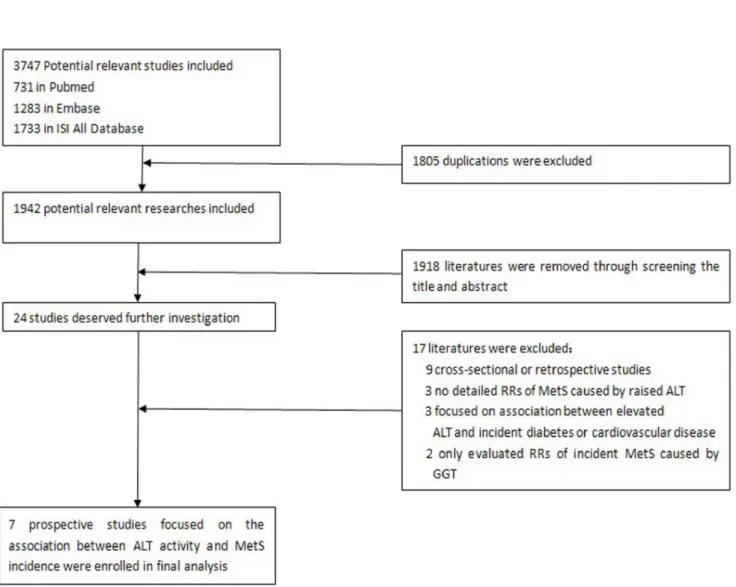
The flow chart of enrolled studies for meta-analysis is shown in Figure 1. A total of 1942 studies were retrieved from three databases (Pubmed, Embase and the ISI All Database) after exclusion of 1805 duplications. Among the 1942 studies, 1918 were removed by screening the titles and abstracts. The remaining 24 publications were independently screened through two authors (Zhengtao Liu and Shuping Que). Seven papers were finally included (Cohen’s Kappa = 0.755). The process and reasons for exclusion are shown in Figure 1.
Characteristics of the Enrolled Studies
Table 1.Check List for Quality Assessment and Scoring of Nonrandomized Studies.
Check List Selection
1. How representative was the selected group in comparison with the general community population? (if yes, one star; no star if the participants were selected or selection of group was not described)
2. How representative was the group with elevated ALT in comparison with the group within normal range? (if drawn from the same community, one star; no star if drawn from a different source or selection of group was not described)
3. Ascertainment of high risk group in exposure of high ALT activity (if yes, one star)
4. Demonstration that the MetS outcome was not present at start of study (if yes, one star)
Comparability
5. Comparison was controlled for age and gender (if yes, one star; no star was assigned if the two groups differed)
6. Comparison was controlled for alcohol intake, cigarette smoking, family history (one star was assigned as if two or more of these three characteristics were controlled for; no star was assigned if one or less characteristic was controlled for)
Outcome assessment
7. Clearly defined MetS outcome by certain criteria (yes, one star for information ascertained in literature; no star if this information was not reported)
8. Adequate duration of follow-up for observation of ensuing MetS outcome (one star if duration of follow-up.5 year)
9. Adequacy of follow-up of cohorts (one star if follow-up rate.90%)
Abbreviations: ALT: Alanine aminotransferase; MetS: metabolic syndrome. doi:10.1371/journal.pone.0080596.t001
Figure 1. Flow chart of selected studies for meta-analysis.
doi:10.1371/journal.pone.0080596.g001
ALT Is Associated with Incident Metabolic Syndrome
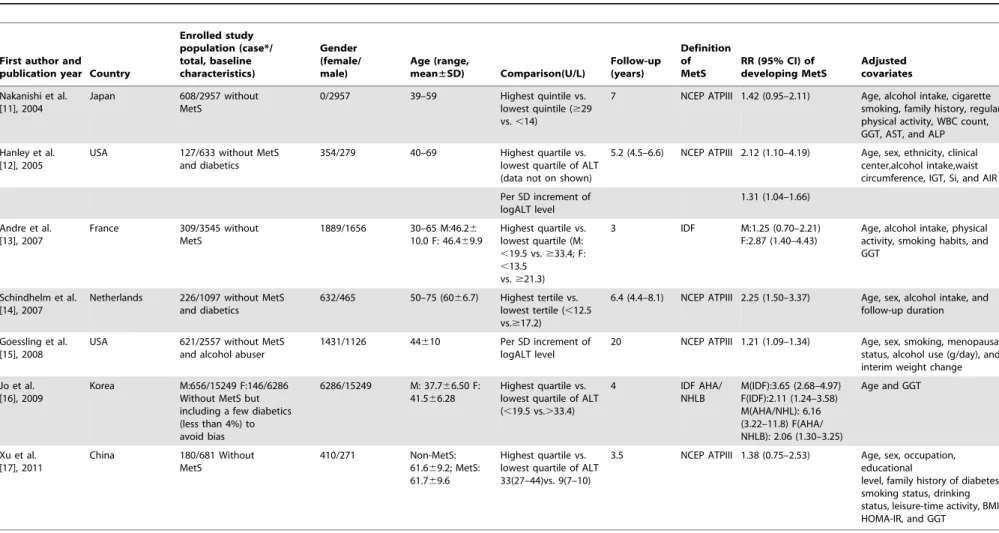
Table 2. Among the seven studies, three were performed in East Asians, two were performed in Americans, and two were performed in Europeans. All of the enrolled subjects were excluded for MetS at baseline and the prevalence of MetS incidence varied from 2.32% to 26.4%. The mean age of participants ranged from 30 to 75 years old. The mean length of follow-up ranged from 3 to 20 years. Among the enrolled studies, one study excluded subjects with excessive alcohol consumption and two studies excluded diabetics. Another study deliberately included a few diabetics (less than 4%) to avoid bias.
Regarding the diagnostic criteria of MetS, five studies adopted the definition provided by the Adult Treatment Panel III of the National Cholesterol Education Program (NCEP ATPIII) [29], one study applied the definition provided by the International Diabetes Federation (IDF) [30] definition and one study applied both IDF and the American Heart Association/National Heart, Lung, and Blood Institute (AHA/NHLBI) [31] criteria, respec-tively. For low heterogeneity presented according to different diagnostic criteria in the Korean study [16] (I2= 18.5%, P = 0.268 for men, I2= 0.0%, P = 0.949 for women, data not on shown), the IDF definition was chosen as representative criteria in subsequent evaluation. All but one Japanese study (only focused on men) included both men and women participants.
Nine data clusters were included in seven studies (two studies provided separate results for males and females). Among them, five studies offered the RRs and 95% CIs of MetS incidence compared between the highest and lowest category of ALT levels. One study reported RR and 95% CI of incident MetS per SD increment of logALT. In addition, one study reported RR and 95% CI of incident MetS between the highest versus lowest category of ALT activity and per SD increment of logALT. Most enrolled studies adjusted for alcohol intake as a covariate, except the Korean study. Detailed RRs of incident individual MetS components (both defined by NCEP ATPIII criteria) per SD increment of logALT are shown in Figure 2.
Quality Assessment Results
Six of the seven prospective studies were of high quality (NOS score.6). The average NOS score of the studies overall was 7.57. The results of the quality assessment score by NOS are shown in Table S1.
Quantitative Analysis
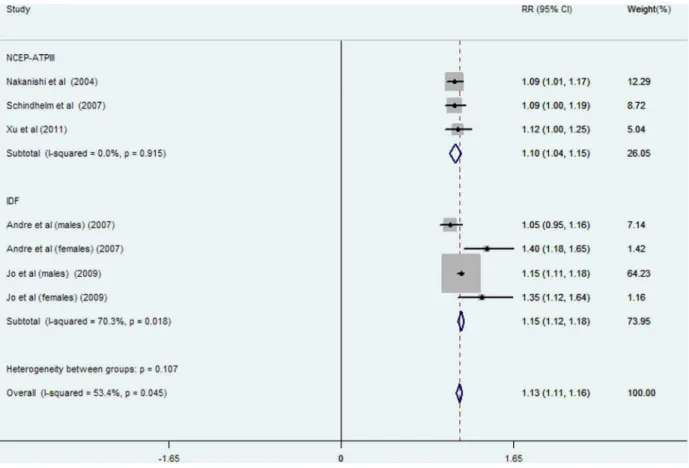
The pooled RR of incident MetS was 1.81 (95% CI: 1.49–2.14; P = 0.013, Figure 3) for the highest versus lowest category of ALT activities in eight data clusters from six studies (involving 28988 participants and 1936 cases); high heterogeneity was found in overall (I2= 60.7%, P = 0.013) and IDF-defined studies (I2= 76.7%, P = 0.005) while no statistical heterogeneity was observed in NCEP-ATPIII-defined studies (I2= 0.0%, P = 0.410). RRs and 95% CIs of incident MetS per 5 U/l of ALT increment were reported or calculated in seven data clusters from five studies (involving 28355 participants and 2125 cases, Figure 4). The overall risk of incident MetS increased by 13% (RR: 1.13; 95% CI: 1.11–1.16) per 5 U/l of ALT increment with significant heterogeneity (I2= 53.4%, P = 0.045). High heterogeneity was observed in the IDF-defined subgroup (I2= 70.3%, P = 0.018) but not in NCEP-ATPIII-defined studies (I2= 0%, P = 0.915). No significant heterogeneity was observed between subgroups defined MetS by NCEP ATPIII or IDF criteria in various comparisons (P = 0.155 in Figure 2, and P = 0.107 in Figure 4, respectively).
In addition, the pooled RRs of incident MetS per one SD increment of logALT was exclusively analyzed in two studies [12,15] (involving 3190 participants and 748 cases). The precise
RR was 1.24 (95% CI: 1.10–1.37) with low heterogeneity (I2= 0%, P = 0.606, Figure S1). The pooled RRs of incident individual MetS components caused per SD elevation of logALT were also evaluated in the two studies [12,15] (Figure 4). The incident hyperglycemia was the only potential individual MetS component outcome in both studies associated with ALT increment with high-pooled RR (1.19, 95% CI: 1.07–1.32) per SD increment of logALT. In addition, no prominent effect of ALT elevation was observed on the other individual MetS component outcome.
Subgroup and Sensitivity Analyses
Because heterogeneity was present in overall analysis, we attempted to evaluate the potential source of heterogeneity by subgroup analyses. The effects of ALT increments on the risk of MetS incidence in subgroups are shown in Figure 5. In subgroup analysis, a consistent association between ALT increments and MetS incidence was still observed except in the subgroups classified by gender. In gender-specific subgroup analysis, the dose-response RR of MetS incidence per 5 U/l of ALT increment was significantly higher (RR: 1.38, 95% CI: 1.20–1.55) in female populations with lower heterogeneity (I2= 0.0%, P = 0.780). Otherwise, heterogeneity was significantly attenuated in studies with long-term follow-up (.5 years), more covariates adjusted (n$6), older (mean age.48 years), and Asian populations. Significant effects on incident MetS caused by ALT elevation were observed in subgroup analysis even after adjusting for alcohol intake and GGT level as covariates.
In addition, we conducted sensitivity analyses by stepwise omitting one study at a time and re-evaluated the summary RRs of incident MetS per 5 U/l of ALT increment for the remaining studies to estimate the impact of single studies on combined results. As shown in Figure 6, no single study significantly influenced the pooled RRs.
Assessment of Publication Bias
To assess the publication bias, Begg’s funnel plot (Figure 7) and Egger’s test were used. No significant publication bias were observed (Egger’s P = 0.402).
Discussion
Table 2.Characteristics of seven cohort prospective studies enrolled in meta-analysis.
First author and publication year Country
Enrolled study population (case*/ total, baseline characteristics) Gender (female/ male) Age (range,
mean±SD) Comparison(U/L)
Follow-up (years)
Definition of MetS
RR (95% CI) of developing MetS
Adjusted covariates
Nakanishi et al. [11], 2004
Japan 608/2957 without MetS
0/2957 39–59 Highest quintile vs.
lowest quintile ($29 vs.,14)
7 NCEP ATPIII 1.42 (0.95–2.11) Age, alcohol intake, cigarette smoking, family history, regular physical activity, WBC count, GGT, AST, and ALP
Hanley et al. [12], 2005
USA 127/633 without MetS
and diabetics
354/279 40–69 Highest quartile vs.
lowest quartile of ALT (data not on shown)
5.2 (4.5–6.6) NCEP ATPIII 2.12 (1.10–4.19) Age, sex, ethnicity, clinical center,alcohol intake,waist circumference, IGT, Si, and AIR
Per SD increment of logALT level
1.31 (1.04–1.66)
Andre et al. [13], 2007
France 309/3545 without MetS
1889/1656 30–65 M:46.26 10.0 F: 46.469.9
Highest quartile vs. lowest quartile (M: ,19.5 vs.$33.4; F: ,13.5
vs.$21.3)
3 IDF M:1.25 (0.70–2.21)
F:2.87 (1.40–4.43)
Age, alcohol intake, physical activity, smoking habits, and GGT
Schindhelm et al. [14], 2007
Netherlands 226/1097 without MetS and diabetics
632/465 50–75 (6066.7) Highest tertile vs. lowest tertile (,12.5 vs.$17.2)
6.4 (4.4–8.1) NCEP ATPIII 2.25 (1.50–3.37) Age, sex, alcohol intake, and follow-up duration
Goessling et al. [15], 2008
USA 621/2557 without MetS
and alcohol abuser
1431/1126 44610 Per SD increment of
logALT level
20 NCEP ATPIII 1.21 (1.09–1.34) Age, sex, smoking, menopausal status, alcohol use (g/day), and interim weight change
Jo et al. [16], 2009
Korea M:656/15249 F:146/6286 Without MetS but including a few diabetics (less than 4%) to avoid bias
6286/15249 M: 37.766.50 F: 41.566.28
Highest quartile vs. lowest quartile of ALT (,19.5 vs..33.4)
4 IDF AHA/
NHLB
M(IDF):3.65 (2.68–4.97) F(IDF):2.11 (1.24–3.58) M(AHA/NHL): 6.16 (3.22–11.8) F(AHA/ NHLB): 2.06 (1.30–3.25)
Age and GGT
Xu et al. [17], 2011
China 180/681 Without
MetS
410/271 Non-MetS:
61.669.2; MetS: 61.769.6
Highest quartile vs. lowest quartile of ALT 33(27–44)vs. 9(7–10)
3.5 NCEP ATPIII 1.38 (0.75–2.53) Age, sex, occupation, educational
level, family history of diabetes, smoking status, drinking status, leisure-time activity, BMI, HOMA-IR, and GGT
*represented the number of MetS occurrence in prospective studies.
Abbreviations: AHA/NHLB: American Heart Association/National Heart, Lung, and Blood Institute; AIR: Acute insulin response; ALP: Alkaline phosphatase; ALT: Alanine aminotransferase; AST: Aspartate aminotransferase; BMI: Body mass index; F: Female; GGT: Gamma-glutamyltransferase; HOMA-IR: Homeostasis model assessment index of insulin resistance; IDF: International Diabetes Federation; IGT: Impaired glucose tolerance; M: Male; MetS: Metabolic syndrome; NCEP-ATPIII: The Adult Treatment Panel III of the National Cholesterol Education Program; SD: Standard deviation; Si: Insulin sensitivity; VS.: Versus; WBC: White blood cell.
(P = 0.007, Figure 5). The RR of MetS incidence with the same extent of ALT elevation in females (1.38, 95% CI: 1.20–1.55, Figure 5) was significantly and consistently higher (I2= 0, P = 0.780, Figure 5). ALT elevation seems to be a more reliable marker in screening incident MetS in the female population. To the extent of our knowledge, this is the first meta-analysis focusing on the association between ALT activity and ensuing MetS incidence.
Significant heterogeneity was observed in the MetS subgroup defined by IDF criteria in our meta-analysis (Figure 3, Figure 4). However, the source of heterogeneity was more likely from the male data clusters of the enrolled studies [13,16]. In supporting of our speculation, the male population had higher heterogeneity (I2= 68.1%, P = 0.077, data not shown) than the female popula-tion (I2= 0%, P = 0.780, Figure 5) in two studies [13,16] defined MetS by IDF criteria suggesting that gender rather than diagnostic criteria, is the source of heterogeneity in ALT-MetS incidence association. Accordingly, ALT might be predictive of MetS occurrence despite a NCEP-ATPIII or IDF definition with similar pooled dose-response RRs (Figure 4). However, further studies specifically addressing this notion are needed.
Except for gender, many potential confounders might also be contributing to heterogeneity in the association between ALT activity and MetS incidence. Of them, common factors including alcohol abuse, viral hepatitis, diabetes, and NAFLD status [34] (that may cause ALT elevation at baseline) were not excluded during enrollments of some studies, which might induce
hetero-geneity in meta-analysis. Therefore, it is necessary to consider the confounders in the enrollment of study participants. With respect to alcohol abuse [35,36], one study [15] evaluated the RR of MetS incidence caused by ALT elevation, excluding subjects with heavy alcohol intake. Interestingly, statistically low heterogeneity (I2= 0%, P = 0.606; Figure S1) was observed in pooled analyses when combining the studies with or without exclusion of alcohol abusers, indicating that the influence of enrolling alcohol abusers was limited on the ALT-MetS association in the general population.
For diabetes as another potential cause of ALT elevation [35,37], two studies [12,14] excluded diabetics at baseline and another study [16] included the diabetics deliberately to avoid bias. Subgroup analysis also showed no significant difference among subgroups that deliberately included, did not exclude and completely excluded diabetics (Figure 5). We speculate that the possible explanation is the low prevalence of diabetics related to the whole population [38]. Viral hepatitis was also considered as a factor associated with higher ALT activity [35,39]. However, no study had excluded subjects with viral hepatitis at baseline, which might introduce heterogeneity. Still, it might be partly responsible for the higher heterogeneity observed in the male population (I2= 54.7%, P = 0.110) with a higher susceptibility to hepatitis virus and a higher prevalence of chronic hepatitis viral infection in men [40–44].
Notably, participants with NAFLD considered as a manifesta-tion of hepatic MetS [45] were not specifically excluded in all of
Figure 2. Relative risks of incident individual MetS components per SD increment of logALT.Abbreviations: HDL-C: high-density lipoprotein cholesterol; SD: standard deviation.
the enrolled studies, which might cause bias and an overestimation for the risk of MetS incidence. However, we speculate the effect was limited for high correlation between the prevalence of NAFLD and MetS in a previous study [46]. Subjects with MetS measured at baseline had been excluded in all of the enrolled studies, which meant the simultaneous exclusion of a majority of subjects with NAFLD. Otherwise, ALT is an available tool in detecting the occurrence and severity of NAFLD in epidemiolog-ical survey [9,47]. A number of published results from cross-sectional studies have emphasized the major cause of ALT elevation in the general population is NAFLD [35,48,49]. To some extent, ALT activity is a tool for representing NAFLD [33] as a manifestation of hepatic metabolic disorder [45,50]. The impact of NAFLD on MetS incidence can be represented as an ALT-incident MetS association.
Some deficiencies in the enrollment of participants were observed. However, the impact was limited, and the evaluation of an association between ALT elevation and MetS incidence was demonstrated through prospective studies. Better-designed studies, considering comprehensive confounders during enrollment of study participants, are needed to substantiate our results in the future.
The dose-response risk of MetS incidence caused by 5 U/l of ALT elevation was significant in overall and gender-specific evaluations after adjusting for GGT level as another potential liver enzyme also associated with incident MetS [51] (RR: 1.14, 95%
CI: 1.11–1.17 in overall population; RR: 1.13, 95% CI: 1.10–1.16 in males, RR: 1.38, 95% CI: 1.20–1.55 in females; all of the enrolled gender-specific RRs were evaluated after adjusting for GGT level; Figure 5). GGT was considered a better risk indicator of MetS incidence due to the significant and consistent GGT-MetS association in previous studies [11,13,17]. Through meta-analysis, we found that ALT elevation was associated with higher incidence of MetS independent of GGT levels. In contrast, the RR of incident MetS with 5 U/l of GGT increment lost its significance after adjusting for ALT activity as a confounding covariate in the female population [51]. As a supplement to GGT activity, ALT might be an effective biomarker in the surveillance of MetS incidence, especially in the female population. For other potential confounding variables, no significant heterogeneity was found between subgroups stratified by mean age, ethnicity, follow-up duration, sample size of study population, number of adjusted covariates and adjustment for alcohol intake as a covariate (Figure 5). It suggests the limited effects of these potential factors on the association between ALT activity and MetS incidence.
The mechanism behind the association between increased ALT activities and incident MetS are still not fully elucidated. Elevated ALT activity has been associated with visceral fat accumulation [52–55] leading to liver steatosis as a mediator of MetS [56]. Increased visceral fat content, in turn, has been associated with defects in the insulin suppression of glucose production leading to more severe features of insulin resistance including hyperglycemia,
Figure 3. Meta-analysis of comparing relative risk of MetS between the highest versus lowest category of ALT levels classified by different diagnostic criteria.Abbreviations: NCEP-ATPIII: The Adult Treatment Panel III of the National Cholesterol Education Program; IDF: International Diabetes Federation.
doi:10.1371/journal.pone.0080596.g003
ALT Is Associated with Incident Metabolic Syndrome
Figure 4. Meta-analysis of comparing relative risk of MetS with 5 U/l of ALT increment classified by different diagnostic criteria.
Abbreviations: NCEP-ATPIII: The Adult Treatment Panel III of the National Cholesterol Education Program; IDF: International Diabetes Federation. doi:10.1371/journal.pone.0080596.g004
Figure 5. Subgroup analysis on risk of MetS incidence followed with 5 U/l of ALT increment. Abbreviations: GGT: Gamma-glutamyltransferase.
hypertriglyceridemia, lower HDL-C concentration, and higher systolic blood pressure as individual MetS component [57,58]. In subsidiary analysis on ALT activity and incident MetS compo-nents, a significant ALT-hyperglycemia association indicates insulin resistance, and subsequent increased hepatic gluconeogen-esis, have a crucial role in the association of ALT activity with MetS incidence. Meanwhile, gender disparity exists in the pathophysiology of MetS [59]. Females are intrinsically more prone to insulin resistance, as impaired glucose homeostasis has been linked to X-chromosomal loci [60–63]. In support, our results confirm that women are more susceptive to MetS occurrence to the same extent of ALT elevation. In addition, insulin resistance and the ensuing MetS caused by ALT elevation are considered a crucial link in ALT-CVD incidence [33,64], and our results confirm this central link through meta-analysis.
However, these speculations need confirmation in future mecha-nistic investigations.
Our findings are highly applicable to clinical practice. All the enrolled studies adopt internationally-recognized definition (NCEP-ATP-III [29] or IDF criteria [30]) designed to aid clinicians in recognizing MetS. Sensitivity analysis showed no significant change from omitting any single study, enhancing the reliability of our results. The strength of the association between ALT activity and incident MetS is now even clearer through this meta-analysis. It will provide clinicians more convincing evidence when counseling subjects during health check-ups. In addition, it indicates that gender should be considered when evaluating the ALT-MetS association.
Besides the previous defects referred, several limitations in this meta-analysis should be addressed. First, the average age of the
Figure 6. Sensitivity analyses by stepwise omitting one study at a time.
doi:10.1371/journal.pone.0080596.g006
Figure 7. Begg’s funnel plot analysis of publication bias.Egger’s test: P = 0.402. doi:10.1371/journal.pone.0080596.g007
ALT Is Associated with Incident Metabolic Syndrome
enrolled participants exceeded 40 years in eight data clusters (out of nine data clusters overall). No prospective research was performed in younger adults, adolescents, and children. Further studies should be conducted in these groups on increasing prevalence of MetS [65,66]. Second, this is not a mechanistic study. The biology underlying the association between ALT elevation and incident MetS deserves further investigation through new perspectives, such as metabolomics [67]. Third, in addition to the intrinsic difference between ALT measurement assays in different institutes, heterogeneity was observed in our meta-analysis due to many factors, including differences in participant enrollments, statistics used for comparison, follow-up lengths, and adjusted covariates. Even the subgroup analysis conducted can not explain all the sources of heterogeneity.
In conclusion, this meta-analysis of prospective cohort studies provides evidence that ALT elevation is consistently and independently associated with MetS occurrence, especially in the female population. The ALT assay therefore has the potential to serve as a valuable tool for assessing the risk of MetS incidence. More prospective studies are needed in different ethnicities to confirm this association and mechanism studies are warranted in the future.
Supporting Information
Figure S1 Relative risks of incident MetS per SD increment of logALT. Abbreviations: SD: standard deviation.
(TIF)
Table S1 Quality assessment of the studies included in the meta-analysis by NOS*.
(DOCX)
Checklist S1 PRISMA Checklist. (DOC)
Flow Diagram S1
(DOC)
Acknowledgments
Sincere thanks to Jonathan Gault for his contribution on language editing. Meanwhile, thanks Wenwu He, Xiaoxu Lu and Zhenjie Wu for their contribution on meta-analysis guidance.
Author Contributions
Conceived and designed the experiments: TP ZL. Performed the experiments: ZL SQ. Analyzed the data: ZL SQ. Contributed reagents/ materials/analysis tools: TP HN LW. Wrote the paper: ZL. Manuscript review: TP HN LW.
References
1. Eckel RH, Grundy SM, Zimmet PZ (2005) The metabolic syndrome. The Lancet 365: 1415–1428.
2. Mottillo S, Filion KB, Genest J, Joseph L, Pilote L, et al. (2010) The Metabolic Syndrome and Cardiovascular RiskA Systematic Review and Meta-Analysis. Journal of the American College of Cardiology 56: 1113–1132.
3. Aschner P (2010) Metabolic syndrome as a risk factor for diabetes. Expert Review of Cardiovascular Therapy 8: 407–412.
4. Gami AS, Witt BJ, Howard DE, Erwin PJ, Gami LA, et al. (2007) Metabolic Syndrome and Risk of Incident Cardiovascular Events and DeathA Systematic Review and Meta-Analysis of Longitudinal Studies. Journal of the American College of Cardiology 49: 403–414.
5. Hui WS, Liu Z, Ho SC (2010) Metabolic syndrome and all-cause mortality: a meta-analysis of prospective cohort studies. European journal of epidemiology 25: 375–384.
6. James PT (2004) Obesity: the worldwide epidemic. Clinics in dermatology 22: 276–280.
7. Owen N, Healy GN, Matthews CE, Dunstan DW (2010) Too much sitting: the population-health science of sedentary behavior. Exercise and sport sciences reviews 38: 105.
8. Marchesini G, Brizi M, Bianchi G, Tomassetti S, Bugianesi E, et al. (2001) Nonalcoholic fatty liver disease a feature of the metabolic syndrome. Diabetes 50: 1844–1850.
9. Reid AE (2001) Nonalcoholic steatohepatitis. Gastroenterology 121: 710–723. 10. Marchesini G, Bugianesi E, Forlani G, Cerrelli F, Lenzi M, et al. (2003)
Nonalcoholic fatty liver, steatohepatitis, and the metabolic syndrome. Hepatol-ogy 37: 917–923.
11. Nakanishi N, Suzuki K, Tatara K (2004) Serumc-glutamyltransferase and risk of metabolic syndrome and type 2 diabetes in middle-aged Japanese men. Diabetes Care 27: 1427–1432.
12. Hanley AJ, Williams K, Festa A, Wagenknecht LE, D’Agostino RB, et al. (2005) Liver Markers and Development of the Metabolic Syndrome The Insulin Resistance Atherosclerosis Study. Diabetes 54: 3140–3147.
13. Andre´ P, Balkau B, Vol S, Charles MA, Eschwe`ge E (2007)c -Glutamyltransfer-ase Activity and Development of the Metabolic Syndrome (International Diabetes Federation Definition) in Middle-Aged Men and Women Data From the Epidemiological Study on the Insulin Resistance Syndrome (DESIR) cohort. Diabetes Care 30: 2355–2361.
14. Schindhelm R, Dekker J, Nijpels G, Stehouwer C, Bouter L, et al. (2007) Alanine aminotransferase and the 6-year risk of the metabolic syndrome in Caucasian men and women: the Hoorn Study. Diabetic medicine 24: 430–435. 15. Goessling W, Massaro JM, Vasan RS, D’Agostino Sr RB, Ellison RC, et al. (2008) Aminotransferase levels and 20-year risk of metabolic syndrome, diabetes, and cardiovascular disease. Gastroenterology 135: 1935.
16. Jo S-K, Lee W-Y, Rhee E-J, Won J-C, Jung C-H, et al. (2009) Serumc-glutamyl transferase activity predicts future development of metabolic syndrome defined by 2 different criteria. Clinica Chimica Acta 403: 234–240.
17. XU Y, XU M, HUANG Y, NING G (2011) Cross: 234–240. and longitudinal association of serum alanine aminotransaminase andc-glutamyl transferase act
metabolic syndrome in middleassociand elderly Chinese people. Journal of Diabetes 3: 38–47.
18. Moher D, Liberati A, Tetzlaff J, Altman DG (2009) Preferred reporting items for systematic reviews and meta-analyses: the PRISMA statement. Annals of internal medicine 151: 264–269.
19. Stroup DF, Berlin JA, Morton SC, Olkin I, Williamson GD, et al. (2000) Meta-analysis of observational studies in epidemiology. JAMA: the journal of the American Medical Association 283: 2008–2012.
20. Cohen J (1968) Weighted kappa: Nominal scale agreement provision for scaled disagreement or partial credit. Psychological bulletin 70: 213.
21. Wells G, Shea B, O’Connell D, Peterson P, Welch V, et al. (2011) The Newcastle-Ottawa Scale (NOS) for assessing the quality of nonrandomised studies in meta-analyses. Ottawa: Ottawa Hospital Research Institute. 22. Harris R, Bradburn M, Deeks J, Harbord R, Altman D, et al. (2008) Metan:
fixed-and random-effects meta-analysis. Stata Journal 8: 3.
23. Greenland S, Longnecker MP (1992) Methods for trend estimation from summarized dose-response data, with applications to meta-analysis. American Journal of Epidemiology 135: 1301–1309.
24. Orsini N, Bellocco R, Greenland S (2006) Generalized least squares for trend estimation of summarized dose–response data. Stata Journal 6: 40–57. 25. Berlin JA, Longnecker MP, Greenland S (1993) Meta-analysis of epidemiologic
dose-response data. Epidemiology 4: 218–228.
26. Higgins JP, Thompson SG, Deeks JJ, Altman DG (2003) Measuring inconsistency in meta-analyses. BMJ: British Medical Journal 327: 557. 27. Steichen T (2001) METANINF: Stata module to evaluate influence of a single
study in meta-analysis estimation. Statistical Software Components.
28. Sterne JA, Egger M (2001) Funnel plots for detecting bias in meta-analysis-Guidelines on choice of axis. Journal of clinical epidemiology 54: 1046–1055. 29. Detection EPO (2001) EVALUATION, AND TREATMENT OF HIGH
BLOOD CHOLESTEROL IN ADULTS. Executive summary of the third report of The National Cholesterol Education Program (NCEP) Expert panel on detection, evaluation, and treatment of high blood cholesterol in adults (Adult Treatment Panel III). Jama 285: 2486–2497.
30. Alberti K, Zimmet P, Shaw J (2005) The metabolic syndrome–a new worldwide definition. Lancet 366: 1059.
31. Grundy SM, Cleeman JI, Daniels SR, Donato KA, Eckel RH, et al. (2005) Diagnosis and management of the metabolic syndrome an American Heart Association/National Heart, Lung, and Blood Institute scientific statement. Circulation 112: 2735–2752.
32. Alberti K, Zimmet P (1998) Definition, diagnosis and classification of diabetes mellitus and its complications. Part 1: diagnosis and classification of diabetes mellitus. Provisional report of a WHO consultation. Diabetic medicine 15: 539– 553.
33. Ioannou GN, Weiss NS, Boyko EJ, Mozaffarian D, Lee SP (2006) Elevated serum alanine aminotransferase activity and calculated risk of coronary heart disease in the United States. Hepatology 43: 1145–1151.
35. Clark JM, Brancati FL, Diehl AM (2003) The prevalence and etiology of elevated aminotransferase levels in the United States. The American journal of gastroenterology 98: 960–967.
36. Bellentani S, Saccoccio G, Costa G, Tiribelli C, Manenti F, et al. (1997) Drinking habits as cofactors of risk for alcohol induced liver damage. Gut 41: 845–850.
37. Ruhl CE, Everhart JE (2003) Determinants of the association of overweight with elevated serum alanine aminotransferase activity in the United States. GASTROENTEROLOGY-BALTIMORE THEN PHILADELPHIA- 124: 71–79.
38. Wild S, Roglic G, Green A, Sicree R, King H (2004) Global prevalence of diabetes estimates for the year 2000 and projections for 2030. Diabetes Care 27: 1047–1053.
39. Liangpunsakul S, Chalasani N (2005) Unexplained elevations in alanine aminotransferase in individuals with the metabolic syndrome: results from the third National Health and Nutrition Survey (NHANES III). The American journal of the medical sciences 329: 111–116.
40. Chu CM, Liaw YF, Sheen I, Lin DY, Huang MJ (1983) Sex difference in chronic hepatitis B virus infection: an appraisal based on the status of hepatitis B e antigen and antibody. Hepatology 3: 947–950.
41. Roudot-Thoraval F, Bastie A, Pawlotsky J, Dhumeaux D (1997) Epidemiological factors affecting the severity of hepatitis C virus-related liver disease: A French survey of 6,664 patients. Hepatology 26: 485–490.
42. Chen CJ, Wang LY, Yu MW (2000) Epidemiology of hepatitis B virus infection in the Asia–Pacific region. Journal of gastroenterology and hepatology 15: E3– E6.
43. Freeman AJ, Dore GJ, Law MG, Thorpe M, Von Overbeck J, et al. (2001) Estimating progression to cirrhosis in chronic hepatitis C virus infection. Hepatology 34: 809–816.
44. Chen SL, Morgan TR (2006) The natural history of hepatitis C virus (HCV) infection. International journal of medical sciences 3: 47.
45. Kim CH, YOUNOSSI ZM (2008) Nonalcoholic fatty liver disease: a manifestation of the metabolic syndrome. Cleveland Clinic Journal of Medicine
75: 721–728.
46. Liu Z, Hu Y, Yang X, Tan A, Gao Y, et al. (2012) Combinative analysis of factors influence serum alanine aminotransferase activity in adult male population from southern China. Clinical Biochemistry.
47. Kim W, Flamm SL, Di Bisceglie AM, Bodenheimer HC (2008) Serum activity of alanine aminotransferase (ALT) as an indicator of health and disease. Hepatology 47: 1363–1370.
48. Pendino GM, Mariano A, Surace P, Caserta CA, Fiorillo MT, et al. (2005) Prevalence and etiology of altered liver tests: A population-based survey in a Mediterranean town. Hepatology 41: 1151–1159.
49. Chen CH, Huang MH, Yang JC, Nien CK, Yang CC, et al. (2007) Prevalence and etiology of elevated serum alanine aminotransferase level in an adult population in Taiwan. Journal of gastroenterology and hepatology 22: 1482– 1489.
50. Boppidi H, Daram SR (2008) Nonalcoholic fatty liver disease: hepatic manifestation of obesity and the metabolic syndrome. Postgraduate medicine 120: E01.
51. Liu CF, Zhou WN, Fang NY (2012) Gammaic fatty liver disease: hepatic manifestation of obesity and the metabolic syndrome. Postgraduate medicine 120: E01.on in journal of clinical practice 66: 692–698.
52. Browning JD, Szczepaniak LS, Dobbins R, Horton JD, Cohen JC, et al. (2004) Prevalence of hepatic steatosis in an urban population in the United States: impact of ethnicity. Hepatology 40: 1387–1395.
53. Eguchi Y, Eguchi T, Mizuta T, Ide Y, Yasutake T, et al. (2006) Visceral fat accumulation and insulin resistance are important factors in nonalcoholic fatty liver disease. Journal of gastroenterology 41: 462–469.
54. Sattar N, McConnachie A, Ford I, Gaw A, Cleland SJ, et al. (2007) Serial Metabolic Measurements and Conversion to Type 2 Diabetes in the West of Scotland Coronary Prevention Study Specific Elevations in Alanine Amino-transferase and Triglycerides Suggest Hepatic Fat Accumulation as a Potential Contributing Factor. Diabetes 56: 984–991.
55. Lorenzo C, Hanley A, Rewers M, Haffner S (2013) The association of alanine aminotransferase within the normal and mildly elevated range with lipoproteins and apolipoproteins: the Insulin Resistance Atherosclerosis Study. Diabetologia: 1–12.
56. Den Boer M, Voshol P, Kuipers F, Havekes L, Romijn J (2004) Hepatic steatosis: a mediator of the metabolic syndrome. Lessons from animal models. Arteriosclerosis, thrombosis, and vascular biology 24: 644–649.
57. Seppa¨la¨-Lindroos A, Vehkavaara S, Ha¨kkinen A-M, Goto T, Westerbacka J, et al. (2002) Fat accumulation in the liver is associated with defects in insulin suppression of glucose production and serum free fatty acids independent of obesity in normal men. Journal of Clinical Endocrinology & Metabolism 87: 3023–3028.
58. Vozarova B, Stefan N, Lindsay RS, Saremi A, Pratley RE, et al. (2002) High alanine aminotransferase is associated with decreased hepatic insulin sensitivity and predicts the development of type 2 diabetes. Diabetes 51: 1889–1895. 59. Regitz-Zagrosek V, Lehmkuhl E, Weickert MO (2006) Gender differences in the
metabolic syndrome and their role for cardiovascular disease. Clinical Research in Cardiology 95: 136–147.
60. Travers SH, Jeffers BW, Eckel RH (2002) Insulin resistance during puberty and future fat accumulation. Journal of Clinical Endocrinology & Metabolism 87: 3814–3818.
61. Murphy MJ, Metcalf BS, Voss LD, Jeffery AN, Kirkby J, et al. (2004) Girls at five are intrinsically more insulin resistant than boys: the programming hypotheses revisited–The EarlyBird Study (EarlyBird 6). Pediatrics 113: 82–86. 62. Moran A, Jacobs DR, Steinberger J, Hong C-P, Prineas R, et al. (1999) Insulin resistance during puberty: results from clamp studies in 357 children. Diabetes 48: 2039–2044.
63. Ehm MG, Karnoub MC, Sakul H, Gottschalk K, Holt DC, et al. (2000) Genomewide search for type 2 diabetes susceptibility genes in four American populations. The American Journal of Human Genetics 66: 1871–1881. 64. Olynyk JK, Knuiman MW, Divitini ML, Davis TM, Beilby J, et al. (2009)
Serum alanine aminotransferase, metabolic syndrome, and cardiovascular disease in an Australian population. The American journal of gastroenterology 104: 1715–1722.
65. Cook S, Weitzman M, Auinger P, Nguyen M, Dietz WH (2003) Prevalence of a metabolic syndrome phenotype in adolescents: findings from the third National Health and Nutrition Examination Survey, 1988–1994. Archives of pediatrics & adolescent medicine 157: 821.
66. Weiss R, Dziura J, Burgert TS, Tamborlane WV, Taksali SE, et al. (2004) Obesity and the metabolic syndrome in children and adolescents. New England Journal of Medicine 350: 2362–2374.
67. Cheng S, Rhee EP, Larson MG, Lewis GD, McCabe EL, et al. (2012) Metabolite Profiling Identifies Pathways Associated With Metabolic Risk in HumansClinical Perspective. Circulation 125: 2222–223.
ALT Is Associated with Incident Metabolic Syndrome