Liver Fibrosis in Patients with Chronic Hepatitis B: A
Meta-Analysis
Young Eun Chon1,2., Eun Hee Choi4., Ki Jun Song4, Jun Yong Park1,2,3, Do Young Kim1,2,3, Kwang-Hyub Han1,2,3, Chae Yoon Chon1,2,3, Sang Hoon Ahn1,2,3*, Seung Up Kim1,2,3*
1Department of Internal Medicine, Yonsei University College of Medicine, Seoul, Korea,2Institute of Gastroenterology, Yonsei University College of Medicine, Seoul, Korea,3Liver Cirrhosis Clinical Research Center, Seoul, Korea,4Department of Biostatics, Yonsei University College of Medicine, Seoul, Korea
Abstract
Background:Transient elastography (TE), anon-invasive toolthat measures liver stiffness, has been evaluated in meta-analyses for effectiveness in assessing liver fibrosis in European populations with chronic hepatitis C (CHC). However, these data cannot be extrapolated to populations in Asian countries, where chronic hepatitis B (CHB) is more prevalent. In this study, we performed a meta-analysis to assess the overall performance of TE for assessing liver fibrosis in patients with CHB.
Methods:Studies from the literature and international conference abstracts which enrolled only patients with CHB or performed a subgroup analysis of such patients were enrolled. Combined effects were calculated using area under the receiver operating characteristic curves (AUROC) and diagnostic accuracy values of each study.
Result:A total of 18 studies comprising 2,772 patients were analyzed. The mean AUROCs for the diagnosis of significant fibrosis (F2), severe fibrosis (F3), and cirrhosis (F4) were 0.859 (95% confidence interval [CI], 0.857–0.860), 0.887 (95% CI, 0.886–0.887), and 0.929 (95% CI, 0.928–0.929), respectively. The estimated cutoff for F2 was 7.9 (range, 6.1–11.8) kPa, with a sensitivity of 74.3% and specificity of 78.3%. For F3, the cutoff value was determined to be 8.8 (range, 8.1–9.7) kPa, with a sensitivity of 74.0% and specificity of 63.8%. The cutoff value for F4 was 11.7 (range, 7.3–17.5) kPa, with a sensitivity of 84.6% and specificity of 81.5%.
Conclusion:TE can be performed with good diagnostic accuracy for quantifying liver fibrosis in patients with CHB.
Citation:Chon YE, Choi EH, Song KJ, Park JY, Kim DY, et al. (2012) Performance of Transient Elastography for the Staging of Liver Fibrosis in Patients with Chronic Hepatitis B: A Meta-Analysis. PLoS ONE 7(9): e44930. doi:10.1371/journal.pone.0044930
Editor:James Fung, The University of Hong Kong, Hong Kong
ReceivedApril 24, 2012;AcceptedAugust 10, 2012;PublishedSeptember 25, 2012
Copyright:ß2012 Chon et al. This is an open-access article distributed under the terms of the Creative Commons Attribution License, which permits unrestricted use, distribution, and reproduction in any medium, provided the original author and source are credited.
Funding:This study was supported by a grant of the Korea Healthcare Technology R & D Project, Ministry of Health and Welfare, Republic of Korea (A102065). The funders had no role in study design, data collection and analysis, decision to publish, or preparation of the manuscript.
Competing Interests:The authors have declared that no competing interests exist.
* E-mail: [email protected] (SHA); [email protected] (SUK)
.These authors contributed equally to this work.
Introduction
Liver fibrosis occurs in response to almost all causes of chronic liver insult, and its initiation is an important phase of chronic liver disease. [1] Without appropriate intervention, liver fibrosis progresses, leading to changes in liver morphology and de-terioration of liver function and hemodynamics. Eventually, progression of liver fibrosis increases the risk for hepatocellular carcinoma (HCC) and hepatic decompensation, which are serious complications in patients with end-stage liver disease. [2,3] Therefore, estimating the precise degree of liver fibrosis is important for predicting prognosis, surveillance, and optimizing treatment strategies in patients with chronic liver disease.
Liver biopsy (LB) is currently the gold standard for assessing liver fibrosis, but this invasive procedure may cause discomfort and pain, and rarely causes serious complications such as bleeding or biopsy-related mortality. [4] In addition, sampling errors and inter- and intraobserver variability may impede diagnostic
accuracy. [5,6] Despite these pitfalls, LB remains the standard diagnostic tool due to the absence of better alternatives. Therefore, many investigators have focused on the development and evaluation of noninvasive liver fibrosis assessment methods to replace LB. [7–9] Liver stiffness measurement (LSM) using transient elastography (TE; FibroScanH; Echosens, Paris, France) has been introduced as a promising noninvasive device for assessing liver fibrosis, with considerable accuracy and reproduc-ibility for predicting cirrhosis. [10,11].
cannot be extrapolated to populations in Asian countries where hepatitis B virus (HBV) infection is more prevalent than hepatitis C virus (HCV).
In recent years, the performance of TE has been evaluated in Asian patients with chronic hepatitis B (CHB),[19,20] and the experiences of TE in these populations have accumulated. However, the overall performance of TE in patients with CHB has not been reported. Hence, in this study, we performed a meta-analysis to assess the overall performance of TE for the diagnosis of liver fibrosis in patients with CHB.
Materials and Methods
Transient Elastography
TE is a novel device for obtaining images using ultrasound. [21] TE is performed on the right lobe of the liver through the intercostal spaces on patients lying in the dorsal decubitus position with the right arm in maximal abduction. The operator locates a liver portion that is at least 6 cm thick and free of large vascular structures, and presses the transducer probe button to start the measurement. A vibration from the probe toward the tissue induces an elastic shear wave that propagates through the tissue. The velocity of the pulse-echo ultrasound following this propaga-tion is measured; velocity increases with liver stiffness. The success rate is calculated by dividing the number of valid measurements by the total number of measurements. The interquartile range (IQR) is an index of intrinsic variability of TE, expressed as the interval of LSM results containing 50% of valid measurements between the 25th and 75th percentiles. The median value of successful measurements is selected as a representative LSM result, expressed in kilopascals (kPa).
Literature Search
We searched medical databases (PubMed [MEDLINE], EMBASE, the Cochrane Library, and Google Scholar) to identify articles published between 2002 (when TE was first introduced) and March 2011. The search terms used were ‘‘FibroScan,’’ ‘‘transient elastography,’’ ‘‘elastography and liver,’’ ‘‘liver stiff-ness,’’ and ‘‘liver fibrosis.’’ In addition, we scanned the websites and conference abstract books of the American Association for the Study of the Liver, European Association for the Study of the Liver, Digestive Disease Week, and Asian Pacific Association for the Study of the Liver.
Inclusion and Exclusion Criteria
For inclusion in this meta-analysis, studies needed to satisfy the following criteria: 1) enrolled only patients with CHB or performed a sub-group analysis of such patients; 2) evaluated the performance of TE to establish liver fibrosis stages based on LB as a reference standard; 3) used a comparable LB staging system, such as METAVIR or the systems of Ishak, Brunt, Ludwig, Knodell, Desmet, or Scheuer; and 4) evaluated the diagnostic accuracy of TE in assessing liver fibrosis stages using area under the receiver operating characteristic curves(AUROCs) and/or expressed sensitivity, specificity, positive predictive values (PPVs), or negative predictive values (NPVs) for the diagnosis of fibrosis stage based on certain cutoff TE values.
Studies were excluded from this analysis if they did not include patients with CHB, did not use LB as a reference test, did not use a fibrosis staging system comparable with METAVIR, and/or did not report AUROC values or diagnostic indices such as sensitivity, specificity, PPVs, or NPVs. Abstracts with data that were subsequently published as full-length articles or that obviously presented data from the same study at different meetings (same
study group and patient population, identical study design, and same or increased number of patients) were evaluated, and only the most recent abstracts were included in this analysis. Reports not written in English were also excluded. Data extraction was performed independently by two reviewers (Chon YE and Kim SU), and when discrepancies surfaced, a final consensus opinion was adopted after discussion.
Data Analysis
Data and results of the included studies are summarized in Tables 1 and 2. For meta-analysis, AUROC values were obtained from all included studies and the standard error of each study was determined or approximated from the available data using a 95% confidence interval (CI). To calculate the mean AUROC, scores from various fibrosis staging systems were standardized using a scale ranging from 0 to 4 points. For example, Ishak scores (0–6) were transformed to METAVIR scores, with Ishak$F3 assigned to METAVIR$F2, Ishak$F4 assigned to METAVIR $ F3, and Ishak $ F5 assigned to METAVIR F4, respectively.
Using AUROC and sensitivity values from each study, we performed a homogeneity test for each effect. Heterogeneity resulting from the effects of many different factors (different staging systems, different LB skills and lengths of specimen, TE skills and failure rates, and different patient demographics) existed among the studies. Therefore, we evaluated the significance of the estimated combined effects using a random effects model [22], which addressed the heterogeneity of studies in analyzing the efficacy of TE. The quality of the studies included in the meta-analysis was assessed by the Quality Assessment of Studies of Diagnostic Accuracy Included in Systematic Review (QUADAS) questionnaire (Table S1)and each item was rated as yes, no, or unclear. [23].
Results
Selection of Candidate Studies
The literature search identified 52 primary studies (30 full-length articles and 22 abstracts) that evaluated the performance of TE. However, several studies were excluded because they did not include patients with CHB (13 studies), did not provide data for diagnostic accuracy (AUROC; 6 studies), did not provide sensitivity or specificity values for any fibrosis stage (6 studies), were not written in English (3 studies), did not used LB as a reference (3 studies), and/or used a fibrosis staging system that was not comparable with METAVIR (3 studies). Finally, 18 studies[19,24–40] were included in the meta-analysis after reading each study in full and adopting inclusion and exclusion criteria. All eighteen studies fulfilled.10/14 QUADAS items and successfully passed the quality assessment.
Patient Characteristics and Study Results
Meta-analysis of TE for Staging Liver Fibrosis
Table 2shows the AUROC, 95% CI, cutoff values, sensitivity, and specificity of each study. Based on these data, the meta-analysis was performed to obtain TE cutoff values for each liver fibrosis stage (Table 3).
Ten (55.6%) studies provided cutoff values for predicting significant fibrosis ($F2). Five studies reported all diagnostic accuracy parameters (sensitivity, specificity, PPV, and NPV), and the other five studies reported only sensitivity and specificity. A total of 1,625 patients were included in the meta-analysis and 7.9 kPa (range, 6.1–11.8 kPa; sensitivity, 74.3%; specificity, 78.3%) was determined as a cutoff value for predicting significant fibrosis. Based on the AUROC values and corresponding 95% CIs for predicting significant fibrosis of 10 (55.6%) studies, the combined AUROC value considering random effects was calculated as 0.859 (95% CI, 0.857–0.860) (Figure 1a).
Four (22.2%) studies provided cutoff values for predicting advanced fibrosis ($F3). Two studies reported all diagnostic indices, whereas two reported only sensitivity and specificity. The cutoff value from 960 patients was determined as 8.8 kPa (range, 8.1–9.7 kPa; sensitivity, 74.0%; specificity, 63.8%). Based on the AUROC values and corresponding 95% CIs for predicting advanced fibrosis of six (33.3%) studies, the combined AUROC value considering random effects was 0.887 (95% CI, 0.886–0.887) (Figure 1b).
Thirteen (72.2%) studies were used to determine the cutoff values for cirrhosis (F4). Seven studies reported all diagnostic indices, whereas six reported only sensitivity and specificity. The cutoff value from 2,051 patients was determined as 11.7 kPa (range, 7.3–17.5 kPa; sensitivity, 84.6%; specificity, 81.5%). Based
on the AUROC values and corresponding 95% CIs for predicting cirrhosis of 12 (66.7%) studies, the combined AUROC value considering random effects was 0.929 (95% CI, 0.928–0.929) (Figure 1c).
Publication Bias
No outlier study and possible publication bias was identified in
$F2,$F3, and F4, respectively (Figure 1a–c).
Discussion
To overcome the limitations of LB in assessing the severity of liver fibrosis in patients with chronic liver disease, a great effort has been made to develop and validate noninvasive methods for detecting liver fibrosis. Among these noninvasive methods, TE has been widely studied as a novel noninvasive method of quantifying the degree of liver fibrosis, mainly in patients with CHC. [12,41] Recently, the application of TE has also been extended to patients with CHB, based on cumulated evidence indicating accuracy comparable with that of CHC. [25,42] Because a systematic approach is required for integrating the TE data from in-dependent studies, we performed a meta-analysis to provide a combined systematic review of the accuracy of TE diagnostics in patients with CHB. In contrast to four previous meta-analyses that included individual studies comprising mostly patients with CHC,[15–18] our study tried to elevate the accuracy of the meta-analysis by exclusively selecting patients with CHB, thereby eliminating potential bias due to different viral etiologies.
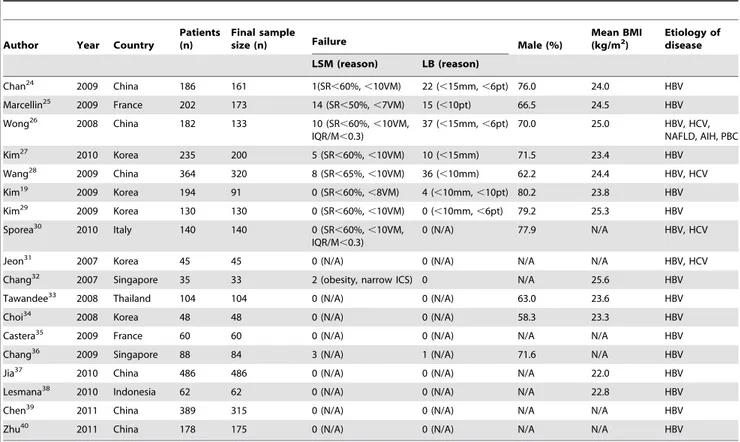
The combined effect of AUROC values using a random-effect model[22] for the diagnosis of $F2, $F3, and F4 were 0.859 Table 1.Characteristics of studies evaluating the performance of transient elastography for staging liver fibrosis.
Author Year Country
Patients (n)
Final sample
size (n) Failure Male (%)
Mean BMI (kg/m2)
Etiology of disease
LSM (reason) LB (reason)
Chan24 2009 China 186 161 1(SR
,60%,,10VM) 22 (,15mm,,6pt) 76.0 24.0 HBV
Marcellin25 2009 France 202 173 14 (SR
,50%,,7VM) 15 (,10pt) 66.5 24.5 HBV
Wong26 2008 China 182 133 10 (SR
,60%,,10VM, IQR/M,0.3)
37 (,15mm,,6pt) 70.0 25.0 HBV, HCV, NAFLD, AIH, PBC
Kim27 2010 Korea 235 200 5 (SR
,60%,,10VM) 10 (,15mm) 71.5 23.4 HBV
Wang28 2009 China 364 320 8 (SR
,65%,,10VM) 36 (,10mm) 62.2 24.4 HBV, HCV
Kim19 2009 Korea 194 91 0 (SR
,60%,,8VM) 4 (,10mm,,10pt) 80.2 23.8 HBV
Kim29 2009 Korea 130 130 0 (SR
,60%,,10VM) 0 (,10mm,,6pt) 79.2 25.3 HBV
Sporea30 2010 Italy 140 140 0 (SR
,60%,,10VM, IQR/M,0.3)
0 (N/A) 77.9 N/A HBV, HCV
Jeon31 2007 Korea 45 45 0 (N/A) 0 (N/A) N/A N/A HBV, HCV
Chang32 2007 Singapore 35 33 2 (obesity, narrow ICS) 0 N/A 25.6 HBV
Tawandee33 2008 Thailand 104 104 0 (N/A) 0 (N/A) 63.0 23.6 HBV
Choi34 2008 Korea 48 48 0 (N/A) 0 (N/A) 58.3 23.3 HBV
Castera35 2009 France 60 60 0 (N/A) 0 (N/A) N/A N/A HBV
Chang36 2009 Singapore 88 84 3 (N/A) 1 (N/A) 71.6 N/A HBV
Jia37 2010 China 486 486 0 (N/A) 0 (N/A) N/A 22.0 HBV
Lesmana38 2010 Indonesia 62 62 0 (N/A) 0 (N/A) N/A 22.8 HBV
Chen39 2011 China 389 315 0 (N/A) 0 (N/A) N/A N/A HBV
Zhu40 2011 China 178 175 0 (N/A) 0 (N/A) N/A N/A HBV
(95% CI, 0.857–0.860), 0.887 (95% CI, 0.886–0.887),and 0.929 (95% CI, 0.928–0.929) respectively, which are not excellent, but are acceptable and comparable to those from previous meta-analyses (Table 4). [43] Although the sensitivity and specificity of our study for predicting $F2 (74.3% and 78.3%, respectively) were similar to those from previous meta-analyses (70–79% and 78–84%, respectively), they were lower for predicting F4 (84.6% and 81.5%, respectively) than those from previous studies (83– 87% and 89–91%, respectively; Table 4). This slightly lower sensitivity and specificity in our study can be explained in part by differences in the composition of the study population. In previous
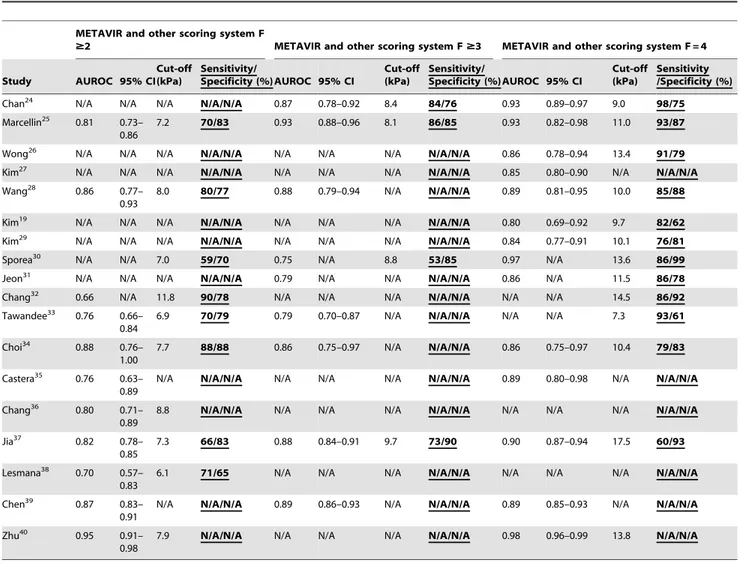
meta-analyses, the predominant etiology of chronic liver disease was chronic HCV infection. Indeed, the proportions of individual studies focusing on patients with CHC were 85.7% (18/21) in the study by Stebbing et al.,[16] 77.8% (7/9) in that by Talwalkar et al.,[15] and 42.5% (17/40) in the study by Tsochatzis et al.,[18] whereas our study included only patients with CHB. Compared with CHC, CHB displays a more complex natural history and frequent exacerbations accompanied by fluctuating alanine aminotransferase (ALT) levels. [44,45] Therefore, overestimated TE values due to high ALT levels at the time of measurement Table 2.Diagnostic indices of studies evaluating the performance of transient elastography for staging liver fibrosis.
METAVIR and other scoring system F
$2 METAVIR and other scoring system F$3 METAVIR and other scoring system F = 4
Study AUROC 95% CI
Cut-off (kPa)
Sensitivity/
Specificity (%) AUROC 95% CI
Cut-off (kPa)
Sensitivity/
Specificity (%)AUROC 95% CI
Cut-off (kPa)
Sensitivity /Specificity (%)
Chan24 N/A N/A N/A N/A/N/A 0.87 0.78–0.92 8.4 84/76 0.93 0.89–0.97 9.0 98/75
Marcellin25 0.81 0.73– 0.86
7.2 70/83 0.93 0.88–0.96 8.1 86/85 0.93 0.82–0.98 11.0 93/87
Wong26 N/A N/A N/A N/A/N/A N/A N/A N/A N/A/N/A 0.86 0.78–0.94 13.4 91/79
Kim27 N/A N/A N/A N/A/N/A N/A N/A N/A N/A/N/A 0.85 0.80–0.90 N/A N/A/N/A
Wang28 0.86 0.77– 0.93
8.0 80/77 0.88 0.79–0.94 N/A N/A/N/A 0.89 0.81–0.95 10.0 85/88
Kim19 N/A N/A N/A N/A/N/A N/A N/A N/A N/A/N/A 0.80 0.69–0.92 9.7 82/62
Kim29 N/A N/A N/A
N/A/N/A N/A N/A N/A N/A/N/A 0.84 0.77–0.91 10.1 76/81
Sporea30 N/A N/A 7.0 59/70 0.75 N/A 8.8 53/85 0.97 N/A 13.6 86/99
Jeon31 N/A N/A N/A N/A/N/A 0.79 N/A N/A N/A/N/A 0.86 N/A 11.5 86/78
Chang32 0.66 N/A 11.8 90/78 N/A N/A N/A N/A/N/A N/A N/A 14.5 86/92
Tawandee33 0.76 0.66– 0.84
6.9 70/79 0.79 0.70–0.87 N/A N/A/N/A N/A N/A 7.3 93/61
Choi34 0.88 0.76– 1.00
7.7 88/88 0.86 0.75–0.97 N/A N/A/N/A 0.86 0.75–0.97 10.4 79/83
Castera35 0.76 0.63– 0.89
N/A N/A/N/A N/A N/A N/A N/A/N/A 0.89 0.80–0.98 N/A N/A/N/A
Chang36 0.80 0.71– 0.89
8.8 N/A/N/A N/A N/A N/A N/A/N/A N/A N/A N/A N/A/N/A
Jia37 0.82 0.78– 0.85
7.3 66/83 0.88 0.84–0.91 9.7 73/90 0.90 0.87–0.94 17.5 60/93
Lesmana38 0.70 0.57– 0.83
6.1 71/65 N/A N/A N/A N/A/N/A N/A N/A N/A N/A/N/A
Chen39 0.87 0.83– 0.91
N/A N/A/N/A 0.89 0.86–0.93 N/A N/A/N/A 0.89 0.85–0.93 N/A N/A/N/A
Zhu40 0.95 0.91– 0.98
7.9 N/A/N/A N/A N/A N/A N/A/N/A 0.98 0.96–0.99 13.8 N/A/N/A
AUROC, area under receiver operating characteristic curve; CI, confidence interval; kPa, kilopascal;N/A, not available. doi:10.1371/journal.pone.0044930.t002
Table 3.Meta-analysis results of LSM cutoff values for staging liver fibrosis.
Patients (n)
Weighted Mean
LSM value (kPa) Range (kPa) Sensitivity (%) Specificity (%)
F$2 1,625 7.9 6.1–11.8 74.3 78.3
F$3 960 8.8 8.1–9.7 74.0 63.8
F = 4 2,051 11.7 7.3–17.5 84.6 81.5
might have produced false-positive results[27] and reduced the overall sensitivity and specificity of TE in our study.
The optimal cutoff values in our study were 7.9 kPa for$F2, 8.8 kPa for$F3, and 11.7 kPa for F4. However,Stebbing et al. [16] determined higher cutoff values (7.81 kPa for$F2 and 15.56 kPa for F4), which increased further when calculated only for patients with CHC (8.44 kPa for$F2 and 16.14 kPa for F4).Fredrich-rust et al. [17] andTsochatzis et al.[18] also adopted higher cutoff values (13.01 and 15.0 kPa, respectively) for determining F4 compared with that found in our study (11.7 kPa;Table 4). This tendency of low cutoff TE values in our study may be explained by two unique features of CHB. First,Sturm et al.[46] concluded recently that the total amount of liver fibrosis reflected by the fibrosis area was significantly lower in patients with CHB, because the fibrous septa might be thinner in these patients than in those with CHC with the same histological stage (F4). Second, because CHB tends to progress to cirrhosis with larger nodules (macronodular cirrhosis) than CHC, the TE pulse is more likely to pass through the normal liver parenchyma between fibrotic bands in patients with CHB than in those with CHC. [47] These two observations might have
resulted in a lower cutoff TE value for patients with CHB compared with patients with CHC. Thus, physicians should be aware of the pitfalls of TE, such as false negativity or lower cutoff values resulting from macro nodular cirrhosis and thin fibrous septa, and false positivity or lower performance resulting from high ALT levels. [48] Accordingly, TE results should be interpreted within the clinical context.
Based on the results of our meta-analysis, TE seems to be a good tool for assessing liver fibrosis in patients with CHB, but it is not excellent. However, because LB is not a perfect gold standard, it is nearly impossible to achieve an AUROC close to 1 in an analysis based on LB data, even with a hypothetically perfect noninvasive liver fibrosis measurement tool. [49] Although TE is inferior to histological evaluation in principle, TE is superior to clinical diagnostic criteria in diagnosing compensated cirrhosis. [19,50] Thus, the performance of TE in our study (AUROC = 0.93) for predicting cirrhosis is sufficiently accurate. Accurate evaluation of TE diagnostic performance will only be possible after establishing an optimal reference standard, such as laparoscopic biopsy from a designated liver location.
Figure 1. Forest plot from meta-analysis of AUROC value using a random-effect model for fibrosis stages (a) significant fibrosis (b) severe fibrosis (c) cirrhosis.The distribution is depicted according to the sample size and the length of the horizontal line represents the 95% CI. : AUROC of the studies with patients with CHB only. : AUROC of the studies with mixed etiologies with available sub-group analysis for patients with CHB.
doi:10.1371/journal.pone.0044930.g001
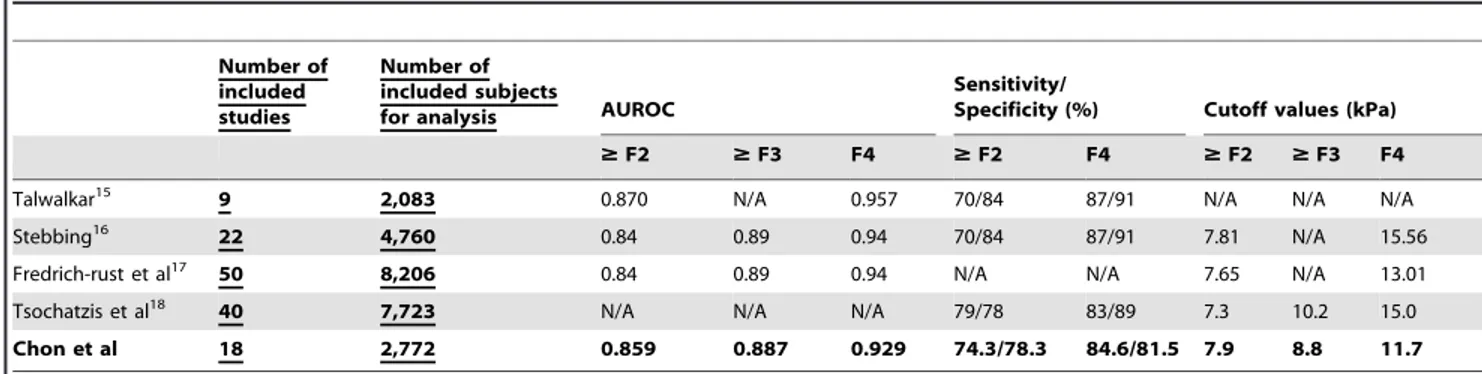
Table 4.Characteristics of previous reported meta-analyses versus current study.
Number of included studies
Number of included subjects
for analysis AUROC
Sensitivity/
Specificity (%) Cutoff values (kPa)
$F2 $F3 F4 $F2 F4 $F2 $F3 F4
Talwalkar15 9 2,083 0.870 N/A 0.957 70/84 87/91 N/A N/A N/A
Stebbing16 22 4,760 0.84 0.89 0.94 70/84 87/91 7.81 N/A 15.56
Fredrich-rust et al17 50 8,206 0.84 0.89 0.94 N/A N/A 7.65 N/A 13.01
Tsochatzis et al18 40 7,723 N/A N/A N/A 79/78 83/89 7.3 10.2 15.0
Chon et al 18 2,772 0.859 0.887 0.929 74.3/78.3 84.6/81.5 7.9 8.8 11.7
The presence of significant fibrosis ($F2) has been regarded as an important indicator of chronic liver disease progression to grave prognosis. Therefore, intervention with antiviral treatment to stop or slow the disease progression is optimally performed at the time of identification of significant fibrosis in patients with chronic liver disease. [51,52] However, the diagnostic accuracy of TE in predicting significant fibrosis seems imperfect in our study (AUROC = 0.86), as proved in previous reports examining patients with CHC. [15–17] Although the combined use of TE and other serological markers has been investigated to improve the diagnostic accuracy of distinguishing fibrosis stage$F2 from F0/ 1,[12,53] this approach has been unsatisfactory, and histological evaluation still has a significant role in this condition.
Although the optimal reference cutoff values were established from our meta-analysis, a cross-sectional comparison between LB and TE values might be unsatisfactory in providing more clinical implications. Thus, recent studies have focused on the potential role of TE as an independent parameter in predicting the future clinical endpoint in longitudinal follow-up settings. Indeed, the TE value was significantly associated with the risk of HCC de-velopment[50,54] or liver-related events. [55] In addition, TE has shown superiority to other serological fibrosis prediction models in predicting HCC or hepatic decompensation. [56] These data converge into a conclusion that TE can be used as a novel tool to
help predict future prognosis in patients with chronic liver disease, although cannot fully replace LB as a diagnostic tool.
In conclusion, using the meta-analysis method, this systematic review focused on the performance of TE for detecting liver fibrosis in patients with CHB.TE seems to be a good method for quantifying hepatic fibrosis in these patients, and further longitudinal studies are required to validate our data.
Supporting Information
Table S1 The QUADAS tool. (DOC)
Acknowledgments
The authors are grateful to Dong-Su Jang, (Medical Illustrator, Medical Research Support Section, Yonsei University College of Medicine, Seoul, Korea) for his help with the figures.
Author Contributions
Conceived and designed the experiments: YEC EHC SHA SUK. Performed the experiments: YEC EHC. Analyzed the data: YEC EHC KJS. Contributed reagents/materials/analysis tools: JYP DYK KHH CYC SHA SUK. Wrote the paper: YEC EHC.
References
1. Kim SU, Han K, Ahn SH (2010) Non-invasive assessment of liver fibrosis: time to move from cross-sectional studies to longitudinal ones. Journal of Gastroenterology and Hepatology 25: 1472–1473.
2. Pungpapong S, Kim WR, Poterucha J (2007) Natural history of hepatitis B virus infection: an update for clinicians. Mayo Clinic Proceedings Mayo Clinic 82: 967–975.
3. Yoshida H, Shiratori Y, Moriyama M, Arakawa Y, Ide T, et al. (1999) Interferon therapy reduces the risk for hepatocellular carcinoma: national surveillance program of cirrhotic and noncirrhotic patients with chronic hepatitis C in Japan. IHIT Study Group. Inhibition of Hepatocarcinogenesis by Interferon Therapy. Annals of Internal Medicine 131: 174–181.
4. Bravo AA, Sheth SG, Chopra S (2001) Liver biopsy. New England Journal of Medicine 344: 495–500.
5. Rousselet M, Michalak S, Dupr F, Crou A, Bedossa P, et al. (2005) Sources of variability in histological scoring of chronic viral hepatitis. Hepatology (Baltimore, Md) 41: 257–264.
6. Bedossa P, Dargre D, Paradis V (2003) Sampling variability of liver fibrosis in chronic hepatitis C. Hepatology (Baltimore, Md) 38: 1449–1457.
7. Wai C, Greenson JK, Fontana RJ, Kalbfleisch JD, Marrero JA, et al. (2003) A simple noninvasive index can predict both significant fibrosis and cirrhosis in patients with chronic hepatitis C. Hepatology (Baltimore, Md) 38: 518–526. 8. Kim BK, Kim SA, Park YN, Cheong JY, Kim HS, et al. (2007) Noninvasive
models to predict liver cirrhosis in patients with chronic hepatitis B. Liver International 27: 969–976.
9. Sheth SG, Flamm SL, Gordon FD, Chopra S (1998) AST/ALT ratio predicts cirrhosis in patients with chronic hepatitis C virus infection. The American Journal of Gastroenterology 93: 44–48.
10. Ganne-Carri N, Ziol M, de Ledinghen V, Douvin C, Marcellin P, et al. (2006) Accuracy of liver stiffness measurement for the diagnosis of cirrhosis in patients with chronic liver diseases. Hepatology (Baltimore, Md) 44: 1511–1517. 11. Foucher J, Chanteloup E, Vergniol J, Castra L, Le Bail B, et al. (2006) Diagnosis
of cirrhosis by transient elastography (FibroScan): a prospective study. Gut 55: 403–408.
12. Castra L, Vergniol J, Foucher J, Le Bail B, Chanteloup E, et al. (2005) Prospective comparison of transient elastography, Fibrotest, APRI, and liver biopsy for the assessment of fibrosis in chronic hepatitis C. Gastroenterology 128: 343–350.
13. Nahon P, Thabut G, Ziol M, Htar MT, Cesaro F, et al. (2006) Liver stiffness measurement versus clinicians’ prediction or both for the assessment of liver fibrosis in patients with chronic hepatitis C. The American Journal of Gastroenterology 101: 2744–2751.
14. Kettaneh A, Marcellin P, Douvin C, Poupon R, Ziol M, et al. (2007) Features associated with success rate and performance of FibroScan measurements for the diagnosis of cirrhosis in HCV patients: a prospective study of 935 patients. Journal of Hepatology 46: 628–634.
15. Talwalkar JA, Kurtz DM, Schoenleber SJ, West CP, Montori VM (2007) Ultrasound-based transient elastography for the detection of hepatic fibrosis: systematic review and meta-analysis. Clinical Gastroenterology and Hepatology 5: 1214–1220.
16. Stebbing J, Farouk L, Panos G, Anderson M, Jiao LR, et al. (2010) A meta-analysis of transient elastography for the detection of hepatic fibrosis. Journal of Clinical Gastroenterology 44: 214–219.
17. Friedrich-Rust M, Ong MF, Martens S, Sarrazin C, Bojunga J, et al. (2008) Performance of transient elastography for the staging of liver fibrosis: a meta-analysis. Gastroenterology 134: 960–974.
18. Tsochatzis EA, Gurusamy KS, Ntaoula S, Cholongitas E, Davidson BR, et al. (2011) Elastography for the diagnosis of severity of fibrosis in chronic liver disease: a meta-analysis of diagnostic accuracy. Journal of Hepatology 54: 650– 659.
19. Kim DY, Kim SU, Ahn SH, Park JY, Lee JM, et al. (2009) Usefulness of FibroScan for detection of early compensated liver cirrhosis in chronic hepatitis B. Digestive Diseases and Sciences 54: 1758–1763.
20. Kim SU, Seo YS, Cheong JY, Kim MY, Kim JK, et al. (2010) Factors that affect the diagnostic accuracy of liver fibrosis measurement by Fibroscan in patients with chronic hepatitis B. Alimentary Pharmacology & Therapeutics 32: 498– 505.
21. Sandrin L, Fourquet B, Hasquenoph J, Yon S, Fournier C, et al. (2003) Transient elastography: a new noninvasive method for assessment of hepatic fibrosis. Ultrasound in Medicine & Biology 29: 1705–1713.
22. DerSimonian R, Laird N (1986) Meta-analysis in clinical trials. Controlled Clinical Trials 7: 177–188.
23. Whiting P, Rutjes AW, Reitsma JB, Bossuyt PM, Kleijnen J (2003) The development of QUADAS: a tool for the quality assessment of studies of diagnostic accuracy included in systematic reviews. BMC Medical Research Methodology 3: 25.
24. Chan HL, Wong GL, Choi PC, Chim AM, Yiu KK, et al. (2009) Alanine aminotransferase-based algorithms of liver stiffness measurement by transient elastography (Fibroscan) for liver fibrosis in chronic hepatitis B. Journal of Viral Hepatitis 16: 36–44.
25. Marcellin P, Ziol M, Bedossa P, Douvin C, Poupon R, et al. (2009) Non-invasive assessment of liver fibrosis by stiffness measurement in patients with chronic hepatitis B. Liver International 29: 242–247.
26. Wong GL, Wong VW, Choi PC, Chan AW, Chum RH, et al. (2008) Assessment of fibrosis by transient elastography compared with liver biopsy and morphometry in chronic liver diseases. Clinical Gastroenterology and Hepatol-ogy 6: 1027–1035.
27. Kim SU, Kim do Y, Park JY, Lee JH, Ahn SH, et al. (2010) How can we enhance the performance of liver stiffness measurement using FibroScan in diagnosing liver cirrhosis in patients with chronic hepatitis B? Journal of Clinical Gastroenterology 44: 66–71.
28. Wang JH, Changchien CS, Hung CH, Eng HL, Tung WC, et al. (2009) FibroScan and ultrasonography in the prediction of hepatic fibrosis in patients with chronic viral hepatitis. Journal of Gastroenterology 44: 439–446. 29. Kim SU, Ahn SH, Park JY, Kang W, Kim do Y, et al. (2009) Liver stiffness
30. Sporea I, Sirli R, Deleanu A, Tudora A, Popescu A, et al. (2010) Liver stiffness measurements in patients with HBV vs HCV chronic hepatitis: a comparative study. World Journal of Gastroenterology : WJG 16: 4832–4837.
31. Jeon SW, Cho CM, Park YD, Jung YJ, Tak WY, et al. (2006) Correlation between liver elasticity measured by FibroScanHand liver fibrosis assessed by histology; Preliminary study in Korea. Digestive Disease Week S1610. 32. Chang J, Tan HH, Yew BS, Thia K, Ang D, et al. (2006) Transient
elastography(FibroScanH) to assess hepatic fibrosis in Chinese with chronic hepatitis B. Hepatology International 1: 785.
33. Tanwandee T, Charatcharoenwitthaya P, Viboolsirikul V, Chotiyaputta W, Chainuvati S, et al. (2008) Utility of liver stiffness measured by transient elastography for determining significant liver fibrosis in patients with chronic hepatitis B. Hepatology (Baltimore, Md) 48: 709.
34. Choi JW, Kim DY, Park JY, Ahn SH, Yoon KT, et al. (2008) Clinical usefulness of liver stiffness measurement in HBeAg-positive chronic hepatitis B patients with ALT level,2 times upper limit of normal. Hepatology (Baltimore, Md) 48: 750.
35. Castera L, Bernard PH, LeBail LB, Foucher J, Trimoulet P, et al. (2009) Prospective longitudinal comparison of trenasient elastography (fibroscan) and fibrotest for discriminating inactive hepatitis B carriers from HBeAg-negative disease. Hepatology (Baltimore, Md) 50: 978.
36. Chang J, Lui HF, Tan CK, Chow WC (2009) Transient elastography (FibroScanH) is reliable for non-invasive diagnosis of significant fibrosis in chronic hepatitis B with milde transaminitis but becomes less reliable at higher ALT levels. Hepatology (Baltimore, Md) 50: 501.
37. Jia JD, Hou JL, Ding HG, Chen JM, Xie Q, et al. (2010) Liver stiffness measured by transient elastography can predict liver fibrosis in Chinese patients with chronic hepatitis B. Hepatology International 4: 22.
38. Lesmana CR, Lesmana LA, Krisnuhoni E, Pakasi L, Salim S, et al. (2010) Diagnostic accuracy of transient elastography versus aspartate transaminase to platelet ratio index in assessing liver fibrosis in chronic hepatitis B: preliminary data. Hepatology International 4: 21.
39. Chen Y, Liang X, Dai L, Zhang Q, Hou J (2011) Improving Performance of Liver Stiffness Measurement Detecting Liver Cirrhosis in Chinese Patient with Compensated Chronic Hepatitis B. Hepatology International 54: 304. 40. Zhu X, Wang LC, Chen EQ, Chen LY, Tang H (2011) Prospective Evaluation
of FibroScan for the Diagnosis of Hepatic Fibrosis in Patients with Chronic Hepatitis B Virus Infection. Hepatology International 54: 306.
41. Ziol M, Handra-Luca A, Kettaneh A, Christidis C, Mal F, et al. (2005) Noninvasive assessment of liver fibrosis by measurement of stiffness in patients with chronic hepatitis C. Hepatology (Baltimore, Md) 41: 48–54.
42. Verveer C, Zondervan PE, Ten Kate FJ, Hansen BE, Janssen HL, et al. (2011) Evaluation of transient elastography for fibrosis assessment compared with large biopsies in chronic hepatitis B and C. Liver International.
43. Swets JA (1988) Measuring the accuracy of diagnostic systems. Science 240: 1285–1293.
44. Chien R, Lin C, Liaw Y (2003) The effect of lamivudine therapy in hepatic decompensation during acute exacerbation of chronic hepatitis B. Journal of Hepatology 38: 322–327.
45. Garg H, Sarin SK, Kumar M, Garg V, Sharma BC, et al. (2011) Tenofovir improves the outcome in patients with spontaneous reactivation of hepatitis B presenting as acute-on-chronic liver failure. Hepatology (Baltimore, Md) 53: 774–780.
46. Sturm N, Cheveau A, Arvers P (2009) Comparative morphometric assessment of fibrosis in chronic hepatitis B versus chronic hepatitis C liver biopsies: implication for fibrosis assessement by non invasive methods. Journal of Hepatology 50.
47. Gaia S, Carenzi S, Barilli AL, Bugianesi E, Smedile A, et al. (2011) Reliability of transient elastography for the detection of fibrosis in non-alcoholic fatty liver disease and chronic viral hepatitis. Journal of Hepatology 54: 64–71. 48. Fung J, Lai C, Cheng C, Wu R, Wong DK, et al. (2011) Mild-to-moderate
elevation of alanine aminotransferase increases liver stiffness measurement by transient elastography in patients with chronic hepatitis B. The American Journal of Gastroenterology 106: 492–496.
49. Kim SU, Han K, Ahn SH (2011) Non-invasive assessment of liver fibrosis: the gap between ideal and real. Journal of Gastroenterology and Hepatology 26: 937–939.
50. Jung KS, Kim SU, Ahn SH, Park YN, Kim DY, et al. (2011) Risk assessment of hepatitis B virus-related hepatocellular carcinoma development using liver stiffness measurement (FibroScan). Hepatology (Baltimore, Md) 53: 885–894. 51. Lok AS, McMahon BJ (2009) Chronic hepatitis B: update 2009. Hepatology
(Baltimore, Md) 50: 661–662.
52. Ghany MG, Strader DB, Thomas DL, Seeff LB (2009) Diagnosis, management, and treatment of hepatitis C: an update. Hepatology (Baltimore, Md) 49: 1335– 1374.
53. Foucher J, Vergniol J, Castera L (2005) Fibrosis evaluation in chronic liver diseases: comparison of FibroScanHwith liver biopsy, FibroTestH, Forns score, APRI, hyaluronan, prothrombin time, and AST/ALT ratio. Journal of Hepatology 42: 78A.
54. Masuzaki R, Tateishi R, Yoshida H, Goto E, Sato T, et al. (2009) Prospective risk assessment for hepatocellular carcinoma development in patients with chronic hepatitis C by transient elastography.
55. Kim SU, Kim JK, Park YN, Han K (2012) Discordance between Liver Biopsy and FibroScanHin Assessing Liver Fibrosis in Chronic Hepatitis B: Risk Factors and Influence of Necroinflammation. PLoS One 7: e32233–e32233. 56. Chon YE, Jung ES, Park JY, Kim DY, Ahn SH, et al. (2012) The accuracy of