Laser Speckle Imaging: A Novel Method for
Detecting Dental Erosion
Nelson H. Koshoji1,4, Sandra K. Bussadori1,2, Carolina C. Bortoletto1,2, Renato A. Prates1,2, Marcelo T. Oliveira1,2, Alessandro M. Deana1,3*
1Dep. of Biophotonics, Nove de Julho University (UNINOVE), São Paulo, Brazil,2School of Dentistry, Nove de Julho University (UNINOVE), São Paulo, Brazil,3School of Information Technology, Nove de Julho University (UNINOVE), São Paulo, Brazil,4School of Engineering, Nove de Julho University (UNINOVE), São Paulo, Brazil
Abstract
Erosion is a highly prevalent condition known as a non-carious lesion that causes progres-sive tooth wear due to chemical processes that do not involve the action of bacteria. Speck-le images proved sensitive to even minimal mineral loss from the enamel. The aim of the present study was to investigate the use of laser speckle imaging analysis in the spatial do-main to quantify shifts in the microstructure of the tooth surface in an erosion model. 32 frag-ments of the vestibular surface of bovine incisors were divided in for groups (10 min, 20 min. 30 min and 40 min of acid etching) immersed in a cola-based beverage (pH approximately 2.5) twice a day during 7 days to create an artificial erosion. By analyzing the laser speckle contrast map (LASCA) in the eroded region compared to the sound it was observed that the LASCA map shifts, proportionally to the acid each duration, by: 18%; 23%; 39% and 44% for the 10 min; 20 min; 30 min and 40 min groups, respectively. To the best of our knowl-edge, this is the first study to demonstrate the correlation between speckle patterns and erosion progression.
Introduction
Laser speckle imaging is a diagnostic technique in which the features of scattered coherent light are explored. At first considered noise, the image of the scatter pattern actually contains infor-mation on the microstructure and micro-movements of the surface of a given tissue. By em-ploying statistical analysis of the temporal and spatial fluctuations in the light scattered by microstructure dynamics and heterogeneities, it is possible to extract information on the dy-namics of the abdominal wall in rats, pulp vitality in teeth and cerebral blood flow.
The ability of laser speckle imaging to allow the evaluation of dynamic features in tissues using a non-invasive, non-destructive cost-effective, real-time method has stimulated the aca-demic community to focus efforts on the study of this method in the time domain (dynamic speckle analysis). However, the analysis of speckle patterns in the spatial domain also contains information on the microstructure and heterogeneities of the surface, which can be explored
a11111
OPEN ACCESS
Citation:Koshoji NH, Bussadori SK, Bortoletto CC, Prates RA, Oliveira MT, Deana AM (2015) Laser Speckle Imaging: A Novel Method for Detecting Dental Erosion. PLoS ONE 10(2): e0118429. doi:10.1371/journal.pone.0118429
Academic Editor:Thomas R. Howdieshell, University of New Mexico HSC, UNITED STATES
Received:November 5, 2014
Accepted:January 16, 2015
Published:February 13, 2015
Copyright:© 2015 Koshoji et al. This is an open access article distributed under the terms of the
Creative Commons Attribution License, which permits unrestricted use, distribution, and reproduction in any medium, provided the original author and source are credited.
Data Availability Statement:All relevant data are within the paper and its Supporting Information files.
Funding:The authors have no support or funding to report.
by applying the proper statistical analysis. Deanaet al. [1] describes a method to enhance the contrast between sound and decayed tooth tissue through the study of laser speckle pattern shifts in the spatial domain.
Tooth erosion is defined as change in the ultrastructure of the enamel, which is currently as-sessed only using clinical diagnostics. Erosion is highly prevalent, affecting more than 50% of the population under five years of age and up to 77% of elderly individuals (>60 years of age)
[2,3]. Tooth wear is a natural process caused by friction during chewing and brushing as well as exposure to acidic foods and beverages. This process becomes pathological when the degree of destruction compromises the function and esthetics of the teeth, with the emergence of sen-sitivity, which can range from mild discomfort to the impossibility of ingesting certain sub-stances [4–6].
Tooth erosion in all age groups has gained importance in recent years due to the pace of modern life, which often leads to the replacement of fresh foods by industrialized foods con-taining acidic ingredients and conservatives. Indeed, there is a close association between the in-crease in tooth erosion and the ingestion of acidic foods and beverages [7]. Moreover, tooth erosion is associated with certain adverse health conditions, such as acid reflux, bulimia and vomiting due to excessive alcohol intake, as gastric fluid is highly acidic [8,9].
Demineralization of the teeth is generally caused by an acidic substance with a lower pH than the critical threshold for the enamel (5.5) and dentin (4.5), which can dissolve hydroxyap-atite crystals [9,10]. The main signs and symptoms of demineralization are pain, discoloration, transparency, cracking and the formation of pits, with microscopic changes to the
tooth surface.
A large number of studies have investigated the prevention of erosion lesions [2–12], but the loss of dental tissue is irreversible. Thus, early diagnosis is crucial to minimizing the amount of damage and plays an important role in the decision-making process of dentists.
The aim of the present study was to detect and quantify small changes in the microstructure of teeth using laser speckle imaging analysis to assess dental tissue demineralization.
Materials and Methods
Ethics
The Brazilian law number 11.797 (that regulates animal procedures) published on October 8th, 2008, paragraph 3rd, article 3 defines animal experiments as:“procedures made on live ani-mals”, therefore since all samples were obtainedpost mortemfrom disposable parts of animals grown for commercial slaughter purposes at Frigobet, this work don’t require approval from the animal ethics committee.
Sample preparation
Using the method proposed by Shellis et al.[13], Schluter et al. [14], Young et al. [15] and Cheng et al.[16], 32 fragments of the vestibular surface of bovine incisors were obtained. Two fragments measuring approximately 6 x 6 mm² were embedded in each sample holder (PVC tube) with acrylic resin with the enamel exposed, horizontal and parallel. Each sample was pol-ished for 60 seconds using wet sandpaper with different degrees of coarseness (400, 600, 1000 and 1200, Buehler, UK). A felt disk with a diamond paste (3M, USA) was then used for polish-ing. Each fragment was divided into two parts, one of which was protected with nail polish (classified as sound tissue) and the other was left exposed and submitted to chemical corrosion (classified as eroded tissue).
(approximately 25°C). Immersion was performed twice a day over seven consecutive days using the following experimental protocol:
• Group 1 (n = 8) - 10 minutes;
• Group 2 (n = 8) - 20 minutes;
• Group 3 (n = 8) - 30 minutes;
• Group 4 (n = 8) - 40 minutes.
After each challenge, the samples were rinsed with de-ionized water for 20 seconds, dried at room temperature and stored in a humid environment until the subsequent etching acid. Two outliers were excluded from group 2 [13–16].
Laser speckle imaging
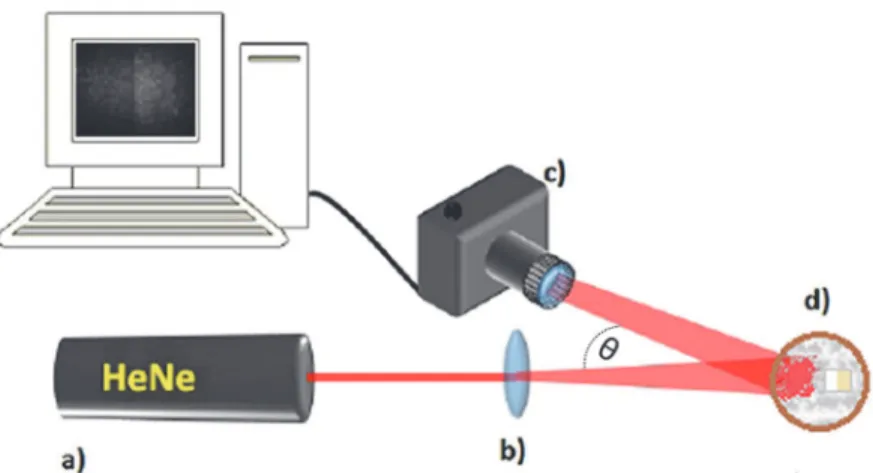
Fig. 1shows the schematic diagram of the laser speckle imaging system. The surfaces of each sample were imaged under a coherent light illumination at normal incidence. A HeNe laser (Uniphase, USA) emitting at 633 nm with 40 mW of continuous wave power was used. The bean was expanded by a f = 100 mm lens (K&F concept, China) achieving a circular spot size with 6 mm in diameter. The samples were than imaged using a CMOS sensor with 23.7 mm X 15.3 mm (4752 x 3168 pixels; pixel pitch = 4.99μm) (Canon EOS Rebel T1i camera fitted with a macro 100 mm Canon lens, Japan) and stored. The photometric parameters were: exposure time = 1/200 s; f/ 29; ISO 100 and the camera was placed at an angleθ<10° with the laser
(Fig. 1). No data binning was performed by the camera.
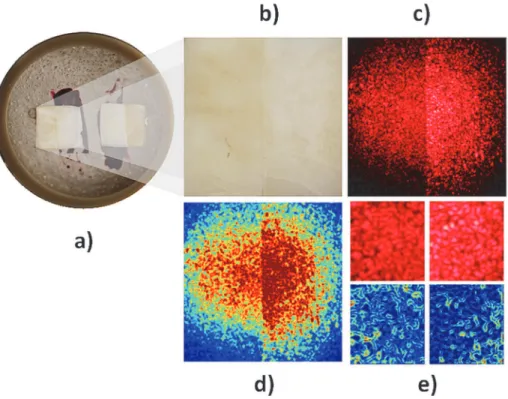
The samples were placed inside a plastic tube (Fig. 2a). Each sample was imaged under white (Fig. 2b) and laser (Fig. 2c) illumination.Fig. 2dpresents the speckle imaging mean (n = 4x4) in which a false color algorithm was applied to increase the visual contrast. Each raw image was manually trimmed to obtain a 700 x 700 pixel image (Fig. 2e) containing the region of interest with a sample of the sound tissue (right) and a sample of eroded tissue (left).
The methods currently used to extract information from speckle images are mainly based on the analysis of pixel intensity (brightness) of the image [1,17,18]. The images were analyzed by a custom software written (by the authors) in Python Language Reference (version 2.7,) based on the theoretical analysis of speckle images presented in ref. [19]. According to [19], the
Fig 1. Schematic diagram of laser speckle imaging system.(a) HeNe laser emitting at 633 nm; (b) Beam expander lens; (c) CMOS camera; (d) samples.
scattered amplitude fields are randomly distributed and the intensity values follow a negative exponential distribution (1) [19]:
PðIÞ ¼eð I
<I>Þ ð1Þ
in which<I>is the mean intensity given by (2):
<I>¼
Xn
i¼1I
n ð2Þ
and the standard deviation of the pixel intensity is (3):
s¼
ffiffiffiffiffiffiffiffiffiffiffiffiffiffiffiffiffiffiffiffiffiffiffiffiffiffiffiffiffiffiffiffiffiffiffiffiffiffi
Xn
i¼1ðIi <I>Þ
2
n 1
s
ð3Þ
in whichnis the sample size.
High spatial resolution is desirable when analyzing oral tissues. Therefore, analysis of vari-ance should be performed on small samples, but without compromising the statistical accuracy. Extrapolating data obtained from Deana et al. [1], a sample size ofn= 4 x 4 was used in the present study, resulting in a 175 x 175 pixel image (Fig. 2d).
Laser speckle contrast analysis (LASCA) is another statistical method that is usually com-bined with the extraction of movement information from a spatial image and it is calculated as shown (4):
Ci;j¼
s
i;j <Ii;j>
ð4Þ
Fig 2. Procedure for acquisition and analysis of speckle images.(a) sample; (b) image under white light; (c) image under coherent light; (d) image with false colors; (e) LASCA method.
in which the contrastCis a number ranging between 0 and 1. Low contrast values denote fast moving particles, whereas high values denote slow moving particles [20].
Although usually associated with movement, contrast analysis also reveals interesting fea-tures in the spatial domain, as will be demonstrated in this paper, whereby the contrast map of the images is also studied.
To avoid heterogeneity in laser beam intensity, the contrast map was calculated only for the central portion of the image, where the illumination intensity is homogeneous (Fig. 2e).
Statistical analysis
The data were found to present normal distributions (Shapiro-Wilk; p>0.05), therefore
analy-sis of variance was used in order to compare multiple groups followed by Tukey as post-hoc. The correlation between the acid etching duration and the LASCA ratio was assessed by the Pearson’s test. The inferential analysis was performed by BioEstat 5.3 (Brazil) and the signifi-cance level is set atα= 0,05.
Results and Discussion
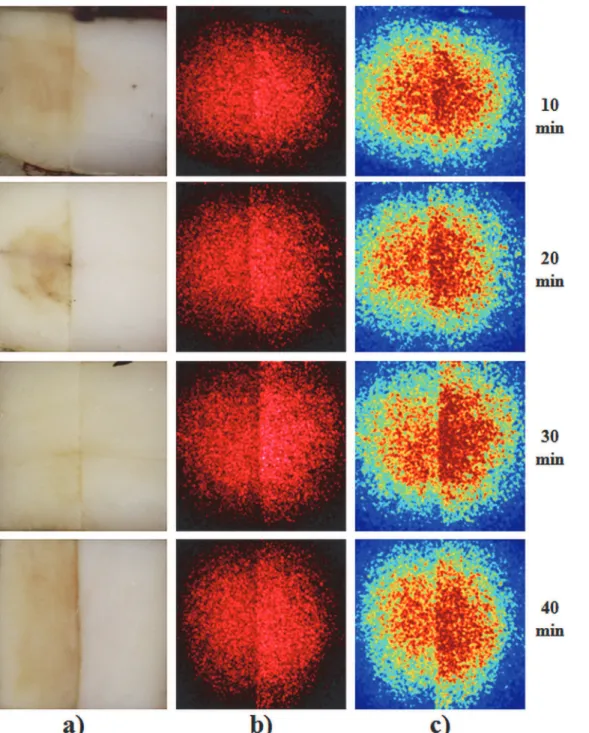
The laser speckle images demonstrate that it is possible to acquire information on the micro-structure of the enamel and detect minimal changes, such as early non-carious lesions.Fig. 3a
shows a representative sample from each group under white illumination. Although there are visible stains in the left portion of each sample due the dye from the cola beverage, structural changes are difficult to assess with the naked eye.
InFig. 3b, each sample was imaged under laser illumination. The images were then averaged (n = 4 x 4) and a false color algorithm was applied to facilitate the visualization.
All samples exhibited lower average intensity of the backscattered light on the eroded tissue, which is seen on the left side ofFig. 3a and b, in comparison to sound tissue (right side).Fig. 3c
presents the speckle imaging mean (n = 4x4) in which a false color algorithm was applied to en-hance the visual contrast. Moreover, the standard deviation of each sample was larger in the eroded tissue in comparison to the sound tissue (Fig. 4). Both effects are related to the hetero-geneity induced in the microstructure of the enamel by the demineralization process, which in-creases the interprismatic spaces, exposing the top of the prism, which has greater porosity [21]. This increases the number of scattering centers, thereby increasing the light scattering, but mineral loss also reduces the backscattering coefficient. This opaque surface therefore re-sults in a larger standard deviation and less average intensity in laser speckle images (Fig. 4).
To differentiate the sound and eroded tissues, contrast analysis was performed of the speckle patterns in the images. Since this analysis is, in its essence, the ratio of the standard deviation and average intensity, the LASCA map of the lesion is generally higher than in sound tissue. This phenomenon is demonstrated in the LASCA maps inFig. 5, which show the greater prev-alence of dark blue on the right side, indicating sound tissue, and lower prevprev-alence on the left side, indicating eroded tissue.
The contrast ratio of the LASCA map of the sound and eroded tissue in each sample is also analyzed according to (5) [22]:
1 <Csound>
<Clesion> ð5Þ
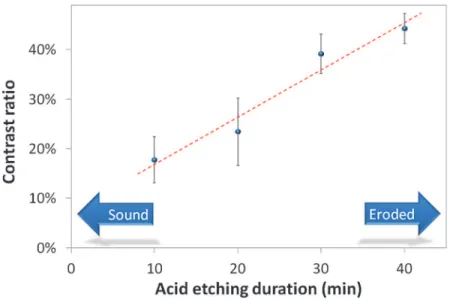
Plotting the average contrast ratio for each group against its acid etching duration, a correlation is found between the speckle signal and demineralization process (Fig. 6).
images is sensitive to even small changes in the microstructure of the surface.. Although the dif-ference between 10 and 20 minutes; and between 30 and 40 minutes data points are not statisti-cally significant, the overall trend would tend toward a linear correlation with the etching acid duration. (Pearson’s coefficient r = 0.9737, p = 0.0263)
Ten minutes of acid etching in a cola-based beverage resulted in a contrast ratio of 18%, meaning that the LASCA signal originating from the lesion was 18% lower than that from the
Fig 3. Sample; (a) white light image; (b) coherent light image; (c) false color image with averaged intensity.
Fig 4. Average intensity and standard deviation of a typical laserspeckle image of tooth enamel.
doi:10.1371/journal.pone.0118429.g004
Fig 5. Typical LASCA maps of; (a) eroded tissue; (b) sound tissue.
sound region which, at the significance levelα= 0.05, is statistically different from the 0%
refer-ence value (p<0.0001). For the groups 20, 30 and 40 min of etching acid, the contrast ration
also statistically differs from the reference value (p<0.0001). These data indicates the contrast
ratio is strongly correlated to the etching acid, correctly detecting the demineralization due to the erosion process even for process as initial as 10 min of acid etch.
At 30 min of acid etching, the contrast ratio increased to 39%, which statistically differs from 10 min (p = 0.0195) and from 20 min (p = 0.0149. The 40 min group, does not statistically differs from the 30 min group but, it is different in comparison with the 10 min group and 20 min group (p = 0.0095 and p = 0.0077, respectively). This demonstrates the proposed meth-od is capable of more than just detect—it also quantifies—the erosion progress thus this pro-cess provides an objective way of analyzing the disease progression.
Conclusions
Erosion is highly prevalent in people of all ages. However, an objective diagnostic procedure is still needed, thus the study of the laser speckle imaging for tooth enamel may provide the first low cost objective diagnostic method for this disease.
The analysis of laser speckle imaging in the spatial domain is a powerful diagnostic tech-nique that provides information on the surface microstructure. To the best of our knowledge, this is the first study to demonstrate it is possible to analyze information on the microstructure of tooth enamel after an acid etching procedure using patterns and LASCA maps. In an erosion model, these patterns are associated with mineral loss from the enamel.
This method has proven sensitive to 10 minutes of acid etching on tooth enamel, which is a lesion so incipient that is not likely to be detected in clinical practice even by a trained dentist, besides it is also sensitive to the erosion progression.
In conclusion, even though it has never been tested in a clinical trial, the highlights of the method such as: non-contact non-destructive cost-effective in theory makes it ideal for the clinical practice.
Fig 6. Contrast ratio x acid etching duration (equal letters means statistical difference).The arrow means the group statistically differs from the reference contrast ratio 0%.
Author Contributions
Conceived and designed the experiments: AMD SKB CCB. Performed the experiments: NHK AMD CCB. Analyzed the data: AMD NHK. Contributed reagents/materials/analysis tools: CCB SKB. Wrote the paper: AMD SKB NHK CCB MTO RAP.
References
1. Deana AM, Jesus SHC, Koshoji NH, Busadori SK, Oliveira MT. Detection of early carious lesions using contrast enhancement with coherent light scattering (speckle imaging). Laser Physics 2013;
23:075607.
2. Murakami C, Oliveira LB, Sheiham A, Nahás Pires Corrêa MS, Haddad AE, Bonecker M. Risk Indica-tors for Erosive Tooth Wear in Brazilian Preschool Children. Caries Research 2011; 45:121–129. doi:
10.1159/000324807PMID:21430381
3. Bartlett D. A new look at erosive tooth wear in elderly people. Journal of the American Dental Associa-tion 2013; 138 (suppl 1):21S–25S.
4. Lussi A, Jaeggi T. Erosion: diagnosis and risk factors. Clinical Oral Investigations 2008; 12 (suppl 1):5–13.
5. Amaechi BT, Higham SM. Dental erosion: possible approaches to prevention and control. Journal of Dentistry 2005; 33(3): 243–252. PMID:15725524
6. Zero DT, Lussi A. Erosion: chemical and biological factors of importance to the dental practitioner. Inter-national Dental Journal 2005; 55(S4): 285–290.
7. West NX, Hughes JA, Addy M. The effect of pH on the erosion of dentine and enamel by dietary acids in vitro. Journal of Oral Rehabilitation 2001; 28(9): 860–864. PMID:11580825
8. Scheutzel P. Etiology of dental erosion-intrisic factors. European Journal of Oral Sciences 1996; 104 (2):178–190. PMID:8804885
9. Barron RP, Carmichael RP, Marcon MA, Sandor GK. Dental erosion in gastroesophageal reflux dis-ease. Journal Canadian Dental Association 2003; 69(2): 84–89. PMID:12559056
10. Grippo JO, Simring M, Schreiner S. Attrition, abrasion, corrosion and abfraction revisited: a new per-spective on tooth surface lesions. Journal of the American Dental Association 2004; 135(8): 1109–1118. PMID:15387049
11. Grenby TH. Methods of assessing erosion and erosive potential. European Journal of Oral Sciences 1669; 104(2): 207–214.
12. Jager DH, Vieira AM, Ruben JL, Huysmans MC. Estimated erosive potential depends on exposure time. Journal of Dentistry 2012; 40(12):1103–1108. doi:10.1016/j.jdent.2012.09.004PMID:23000470 13. Shellis RP, Gans C, Ren Y, Zero DT, Lussi A. Methodology and models in erosion research: discussion
and conclusions. Caries Research 2011; 45 (suppl 1): 69–77. doi:10.1159/000325971PMID:
21625135
14. Schluter N, Hara A, Shellis RP, Ganss C. Methods for the measurement and characterization of erosion in enamel and dentine. Caries Research 2011; 45 (suppl 1): 13–23. doi:10.1159/000326819PMID:
21625129
15. Young A, Tenuta LMA. Initial Erosion Models. Caries Research 2011; 45 (suppl 1): 33–42.
16. Cheng ZJ, Wang XM, Cui FZ, Ge F, Yan JX. The enamel softening and loss during early erosion stud-ied by AFM, SEM and nanoindentation. Biomedical Materials 2009; 4: 015020. doi: 10.1088/1748-6041/4/1/015020PMID:19193971
17. O’driscoll P, Mitchell J, Shelton J, Knowless JC, Gulabivala K. Laser speckle photography in measure-ment of tooth strain. In: International Endodontic Journal 1998; 376–376.
18. Uchino M, Fujisaki W, Kurihara E, Matsuda K, Koseki T. Characteristics of Laser Speckle Measurement of Tooth Roughness. Key Engineering Materials 2004; 261/263: 1581–1586.
19. Goodman JW. Statistical Properties of Laser Speckle Patterns. In: Dainty JC, editor. Berlin: Springer 1984.
20. Briers JD, Webster S. Laser speckle contrast analysis (LASCA): a nonscanning, full-field technique for monitoring capillary blood flow. Journal of Biomedical Optics 1996; 1(2): 174–179. PMID:23014683 21. Zhou SL, Wen LY, Zhou J, Xuan K, Watanabe S. In vitro study of the effects of fluoride-releasing dental
materials on remineralization in an enamel erosion model. Journal of Dentistry 2012; 40 (3): 255–263. doi:10.1016/j.jdent.2011.12.016PMID:22227269