Three-dimensional evaluation of mandibular anterior
dental crowding in digital dental casts
Luciana Quintanilha Pires Fernandes1, Livia Kelly Ferraz Nunes1,
Luana Santos Alves1, Felipe de Assis Carvalho Ribeiro1, Jonas Capelli Júnior1
Introduction: Digital dental models provide a more accurate and comprehensive assessment of orthodontic cases. Although this technique is quite promising, there are few three-dimensional measurements methods described in the literature. Objectives: The aim of this study was to propose a method for assessing the degree of mandibular anterior dental crowding in the three planes of space, using digital dental models. Methods: Thirty dental casts were selected and scanned by Mae-stro 3D Dental Scanner and imported by Geomagic Qualify 2013 software. The degree of crowding was calculated by two examiners, based on the Little’s Irregularity Index, by means of the definition of axial, coronal and sagittal planes for each model. Intraexaminer analysis was performed with Dahlberg’s Formula (DF) and Intraclass Correlation Coefficients (ICC), and interexaminer analysis was performed with ICC and paired t-test. Results: The ICC showed an excellent agreement (p < 0.05) for all measurements, except for the intraexaminer and interexaminer in the Z-axis, in which it was found a moderate agreement. The DF showed a satisfactory accuracy with all measurements showing less than 1 mm difference. The paired t-test showed statistical difference between the examiners in two measurements, although it was clinical irrelevant. Conclusion: When comparing the three planes of space, the Z-axis showed the greatest variation in landmarks placement; however, overall, the present method seems precise and reproducible.
Keywords:Orthodontics. Diagnosis. Dental models. Malocclusion.
1 Universidade do Estado do Rio de Janeiro, Department of Orthodontics, Rio
de Janeiro, RJ, Brazil.
» The authors report no commercial, proprietary or financial interest in the products or companies described in this article.
DOI: https://doi.org/10.1590/2177-6709.22.3.064-071.oar
How to cite this article: Fernandes LQP, Nunes LKF, Alves LS, Ribeiro FAC, Capelli Júnior J. Three-dimensional evaluation of mandibular anterior dental crowding in digital dental casts. Dental Press J Orthod. 2017 May-Ju-ne;22(3):64-71. DOI: https://doi.org/10.1590/2177-6709.22.3.064-071.oar
Submitted: June 14, 2016 - Revised and accepted: December 17, 2016
Contact address: Luciana Quintanilha Pires Fernandes
Boulevard 28 de Setembro, 157, Vila Isabel – Rio de Janeiro/RJ, Brasil CEP: 20.551-030 – E-mail: [email protected]
Introdução: os modelos digitais fornecem uma avaliação mais precisa e abrangente dos casos ortodônticos. Embora essa técni-ca seja bastante promissora, existem poucos métodos de medição tridimensional descritos na literatura. Objetivo: o objetivo do presente estudo foi propor um método para avaliar o grau de apinhamento dentário anteroinferior, nos três planos do espaço, usando modelos digitais. Métodos: trinta modelos de gesso foram selecionados, escaneados pelo scanner Maestro Dental 3D e importados para o software Geomagic Qualify 2013. Dois examinadores calcularam o grau de apinhamento, com base no Índice de Irregularidade de Little, mediante a definição dos planos axial, coronal e sagital para cada modelo. A análise intraexaminador foi realizada por meio da fórmula de Dahlberg (FD) e do Coeficiente de Correlação Intraclasse (ICC), enquanto a análise inte-rexaminadores foi realizada com o ICC e o teste t pareado. Resultados: o ICC mostrou um excelente grau de concordância (p < 0,05) para todas as medições, exceto para as avaliações intraexaminador e interexaminadores no eixo Z, onde foi encontrado um grau moderado. A FD mostrou uma precisão satisfatória, com todas as medidas apresentando diferença menor que 1 mm. O teste t pareado mostrou diferenças estatisticamente significativas entre os examinadores em duas medidas, apesar de terem sido clinicamente irrelevantes. Conclusão: ao se comparar os três planos do espaço, o eixo Z mostrou maior variação na mar-cação de pontos; no entanto, em geral, o presente método parece ser preciso e reprodutível.
INTRODUCTION
Dental casts are widely used in dental practice as well as on research projects. In Orthodontics, it is con-sidered to be of extreme value for diagnosis and the clinical decision making process. With the introduc-tion of three-dimensional scanners, it has become pos-sible to obtain digital dental models aiming the study of dental arches. These models feature precision and can be manipulated through speciic sotware, en-abling the completion of its analysis, which is an
im-portant step for orthodontic treatment planning.1
Among the many advantages attributed to the dig-ital dental models, it can be cited the easy manipu-lation and the fact that they do not require physical space to be stored. They are saved on the computer, producing durable images without loss or damage to
the original models.2-4 Certain limitations of plaster
dental casts, as its manufacturing time and its weight and volume, would be eliminated with the use of digital dental models, especially with the increased demand for information exchange and ease of
com-munication between professionals.5-7
Digital dental models acquisition by
comput-ed tomography,8 optical scanning of plaster dental
casts,3,4,7,9-13 digital dental models obtained by
direct-ly scanning the alginate impressions14 and through
two-dimensional photographs2 have been evaluated
and compared to conventional plaster dental casts. According to these studies, all of these methods were reliable and accurate.
Some studies have analyzed the reliability of the digital dental models compared to conventional exams, by comparing linear measurements in both
digital and plaster dental casts.2-5,7-16 Among the
pa-rameters chosen to assess the reproducibility and re-liability of digital dental models, the most used were
the dental discrepancy,8,13,14 the mesiodistal tooth
dimension,3,4,7,10,11 arch width measurements,4,9,10,12
overbite and overjet3,9-11 and midline discrepancy.3,9,10
The virtual orthodontic planning (setup) also be-came possible with the introduction of digital dental
models.17,18 Im et al19 found intra-arch and interarch
similar measurements when comparing virtual and manual tooth setups.
Although an extensive literature proving digital dental models can substitute plaster dental casts with satisfactory degrees of accuracy and reproducibility of
linear measurements,20 only few studies used
meth-odologies that evaluated the parameters through the Cartesian coordinate system. Described by Renee Descartes (1596-1650), the coordinate system allows to determine the specific localization of each point in the three dimensions of space, by projecting its
local-ization in the three fixed perpendicular planes.21
Mandibular anterior crowding often leads patients to seek for dental alignment; being so, this maloc-clusion should be investigated, in order to obtain an appropriate treatment plan. Many methods have
been proposed to evaluate this malocclusion22-29 and
the most used is the Irregularity Index described by
Little in 1975.30 This method aims to quantify the
de-gree of crowding in the mandibular anterior region by measuring the linear displacement of the anatomic contact points of each incisor from the adjacent tooth anatomic point, assessing the degree of tooth mis-alignment in the horizontal plane.
The goal of this study was to propose a method to assess the degree of mandibular anterior dental crowding in the three planes of space, using Cartesian coordinates on digital dental models.
MATERIAL AND METHODS
Ater approval by the Institution Ethical Committee, thirty lower plaster dental casts were selected from the diagnostic records of patients that were receiving
orth-odontic treatment at the Orthorth-odontic Clinic of the
Uni-versidade do Estado do Rio de Janeiro (UERJ, Brazil).
The inclusion criteria were lower dental casts with complete permanent dentition, with or without the second and third molars. The irst molars should have their ive cusps relatively equidistant in relation to the occlusal plane. Models with tipped irst molars and/or lacking structural integrity could compromise the mea-surements and thus were excluded from this study.
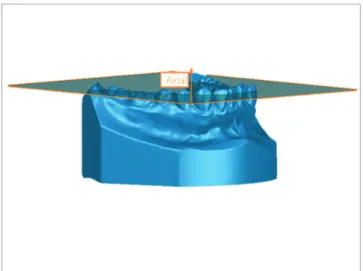
Figure 1 - Axial plane.
Figure 2 - Coronal plane.
Figure 3 - Sagittal plane.
An individual coordinate system was created for each digital dental model in order to permit a cus-tomized assessment of them in the three planes of space, as proposed in this study. The whole process was made by two examiners, who were previously calibrated before performing the landmark placement and measurements.
Axial, coronal and sagittal planes
It was established that the axial plane should be coincident with the patients’ occlusal plane. Three points defined it: mesiobuccal cusp tip of both lower first molars and the contact point between lower cen-tral incisors. If the patient had a diastema in this re-gion, the third point was marked where it should be the contact point in the lower right central incisor. This plane was related to the X and Y-axes (Fig 1).
Three points also defined the coronal plane: mass center (centroid) of the dental crowns of both lower first molars and center of the mesiodistal groove of the right lower first molar. This plan was related to the X and Z-axes (Fig 2).
Sagittal plane was defined as being perpendicu-lar to the two plans previously described, passing through the contact point between lower central in-cisors. If the patient had a diastema in this region, the third point was marked where it should be the con-tact point in the lower right central incisor. This plan was related to the Y and Z-axes (Fig 3).
Coordinate system definition
For the custom-made coordinate system de-scribed above, changes in the X-axis reflected trans-versal displacements in the anterior region of the digital dental models (Fig 4A), while changes in the Y-axis represented anterior-posterior changes (Fig 4B). Differences in the Z-axis meant vertical changes (Fig 4C).
Usually, while creating a digital dental model, it is placed in a standard coordinate system according to the spatial position of the dental model in the scan-ner at the time of acquisition. Aiming proper mea-surements as planned, it was mandatory to set the software to use the newly defined coordinate system instead of the standard one. From this time-point on, all markings and measurements made were related to the customized coordinate system (Fig 5).
Axial
Coronal
Landmark placement
In order to quantify the degree of crowding in the mandibular anterior region of each dental model, it was necessary to mark the contact points of the incisors and its adjacent teeth. Thus, the anatomic points from the mesial of the right canine to the mesial of the let canine were
marked, as proposed by the Irregularity Index.30 The
digi-tal images of the dendigi-tal models could be rotated around any axis and enlarged on screen to facilitate the landmark placement. The objective was to achieve high accuracy in deining the exact location of these points (Fig 6).
Degree of crowding measurement in the three planes of space
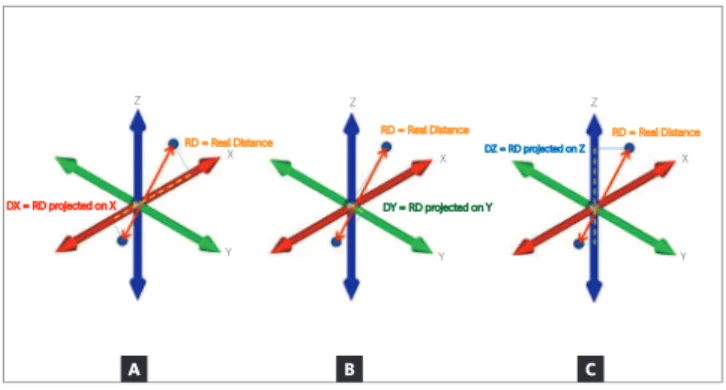
The next step was to measure the linear displace-ment of the contact points in this region. As proposed by this study, it was evaluated not only the real dis-tance (RD), defined as the linear disdis-tance between two points without projecting its localization in the three planes of space (the distance obtained when a dental cast is measured with a digital caliper, for ex-ample), but the measurements of the projections of the RD on the three axes (X, Y and Z), separate-ly (Fig 7). So, it was obtained four measurements for each pair of points (RD, DX, DY and DZ), which allow to decompose the RD identifying how much anterior-posterior (DY), transversal (DX) and verti-cal (DZ) components were present.
All data was recorded and compiled in a spread-sheet, followed by the statistical analysis. All of the values found for the RD, DX, DY and DZ were
add-ed, in an analogous way to that described by Little,30
to obtain the final crowding value of the assessed re-gion. Thus, the DX found between the five pairs of points (mesial of right canine to the distal of right lateral incisor, mesial of right lateral incisor to the distal of right central incisor, mesial of right central incisor to the mesial of left central incisor, distal of left central incisor to the mesial of left lateral incisor and distal of left lateral incisor to the mesial of left canine) were added and the anterior crowding in the transversal axis were obtained. Similarly, the anterior crowding in the anterior-posterior axis (DY) and in the vertical axis (DZ) were calculated, as well as the total crowding calculated based on the RDs.
Figure 4 - A) Transversal displacement between left central lower incisor and left lateral lower incisor (X-axis). B) Anterior-posterior displacement between left central lower incisor and left lateral lower incisor (Y-axis). C) Vertical displacement between left central lower incisor and left lateral lower incisor (Z-axis).
Figure 5 - Coordinate system: the red axes correspond to the customized coordinate system created for this model; the green axes correspond to the standard coordinate system that the software presents.
A B C
Customized Coordinate System
Standard Coordinate System
Y
X Z
Z
Statistical analysis
Statistical analysis was done with the IBM SPSS Statistics 22 software. The sample size calculation was carried out using an expected difference of 0.5mm, with 90% power and an 5% alpha level. The Shapiro-Wilk test found normal distribution and the Levene test verified the equality of variances. Two examin-ers made the whole process of landmark placement and measurements, in order to assess the reproduc-ibility and the interexaminer precision of the pro-posed method, which was performed with Intraclass
Correlation Coefficient (ICC) and with paired t-test.
Ten randomly selected digital dental models had all measurements repeated after fifteen days by both ex-aminers, in order to evaluate the reproducibility and the intraexaminer precision, which were evaluated with Intraclass Correlation Coefficient (ICC) and with Dahlberg’s Formula (DF).
RESULTS
The Shapiro-Wilk test indicated a normal distribu-tion for the sample, and the sample’s descriptive analysis is shown in Table 1.
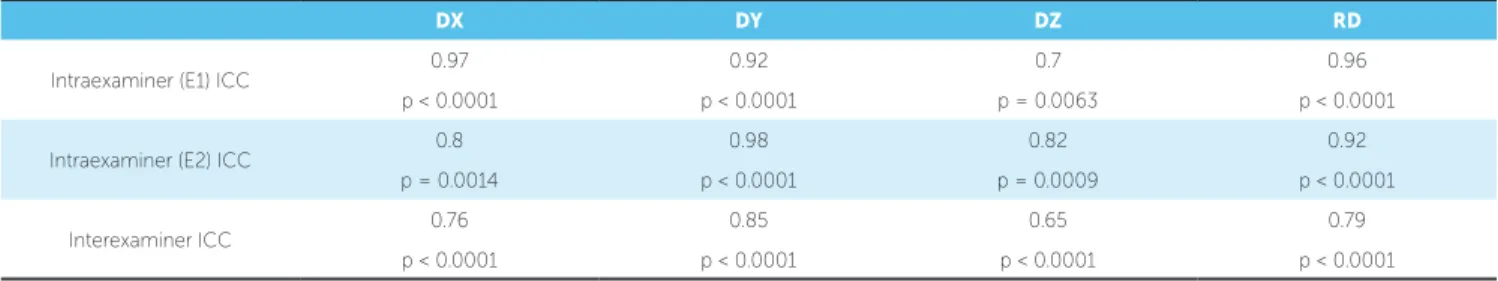
The DF showed a satisfactory precision of all measure-ments (DX, DY, DZ and RD) showing less than 1 mm diference (Table 2). The less precise measurement found by examiner 1 (E1) was related to the Z-axis (DZ), while for examiner 2 (E2) was related to the real distance (RD). The most precise measurement found by E1 was related to the X-axis (DX), while for E2 was related to Y-axis (DY).
The ICC showed an excellent agreement for almost all measurements, except for intraexaminer of examiner 1 in the Z-axis and interexaminer in the Z-axis, where it
ob-served a moderate agreement (Table 3). The paired t-test
showed statistical diferences between both examiners for real distance (RD) and for the X-axis (DX). The results
were considered signiicant at p < 0.05 (Table 4).
Figure 6 - Points used to evaluate the mandibular anterior dental crowding. Figure 7 - Graphic representation of the projections of the RD on the: A) X-axis (DX); B) Y-axis (DY); C) Z-axis (DZ).
DX DY DZ RD
E1 E2 E1 E2 E1 E2 E1 E2
Sample size 30 30 30 30 30 30 30 30
Minimum (mm) 1 1.3 0.5 0.8 1 0.8 2.5 2.9
Maximum (mm) 5.3 5.8 8.7 8.8 4.8 8.3 11.7 13.2
Mean (mm) 2.6 3.1 3.8 3.8 2.5 2.8 5.8 6.3
Standard deviation (mm) 1.1 1.2 2.2 2.2 1 1.5 2.4 2.5
Table 1 - Descriptive analysis: DX, real distance projected on the X axis; DY, real distance projected on the Y axis; DZ, real distance projected on the Z axis; RD, real distance; E1, examiner 1; E2, examiner 2.
DX = RD projected on X DY = RD projected on Y
RD = Real Distance
RD = Real Distance DZ = RD projected on Z RD = Real Distance
X X X
Z Z
Z
Y Y Y
Table 2 - Dahlberg’s Formula (DF): DX, real distance projected on the X axis; DY, real distance projected on the Y axis; DZ, real distance projected on the Z axis; RD, real distance; E1, examiner 1; E2, examiner 2.
Table 3 - Intraexaminer and Interexaminer Intraclass Correlation Coefficient (ICC) : DX, real distance projected on the X axis; DY, real distance projected on the Y axis; DZ, real distance projected on the Z axis; RD, real distance; E1, examiner 1; E2, examiner 2.
Table 4 - Paired t-test: DX, real distance projected on the X axis; DY, real distance projected on the Y axis; DZ, real distance projected on the Z axis; RD, real
distance; E1, examiner 1; E2, examiner 2; SD, standard deviation.
DX (mm) DY (mm) DZ (mm) RD (mm)
Intraexaminer (E1) DF 0.19 0.44 0.58 0.46
Intraexaminer (E2) DF 0.62 0.47 0.64 0.8
DX DY DZ RD
Intraexaminer (E1) ICC 0.97 0.92 0.7 0.96
p < 0.0001 p < 0.0001 p = 0.0063 p < 0.0001
Intraexaminer (E2) ICC 0.8 0.98 0.82 0.92
p = 0.0014 p < 0.0001 p = 0.0009 p < 0.0001
Interexaminer ICC 0.76 0.85 0.65 0.79
p < 0.0001 p < 0.0001 p < 0.0001 p < 0.0001
DX DY DZ RD
E1 E2 E1 E2 E1 E2 E1 E2
Mean 2.57 3.08 3.85 3.82 2.55 2.82 5.8 6.35
SD 1.11 1.21 2.19 2.16 0.98 1.55 2.37 2.5
Diference between examiners 0.51 0.03 0.27 0.55
p value < 0.0001 0.8979 0.1600 0.0090
DISCUSSION
The present study’s choice for evaluation of the mandibular anterior crowding is justiied by the clini-cal relevance of this malocclusion. To assess the degree of mandibular anterior crowding, it was chosen the Ir-regularity Index as the measurement parameter, since this is the most accepted and used method by ortho-dontists. However, since this index was described with-out the support of digital images, it has limitations, as the tooth misalignment is seen only in the horizontal
plane.30 The method proposed by this study allows a
more comprehensive assessment of crowding, quanti-fying the degree of this malocclusion not only in the horizontal plane but also in the vertical and transverse planes. This way, when evaluating crowding using this three-dimensional method, the orthodontist can distin-guish the degree of misalignment and unleveling in the mandibular anterior teeth, separately.
we decided to measure only ten dental casts in order to evaluate intraexaminer precision.
We believe that the coordinate system created by this study is user friendly, since the chosen points were con-sidered to be easy to identify and mark on digital dental models. A possible limitation of this system is the refer-ence of the sagittal and axial planes between the cen-tral incisors, since the evaluated region has a parabolic shape that will create an angle in relation to the sagit-tal plane when evaluating the canines’ position. Nev-ertheless, since this method was proposed only to the anterior teeth, the degree of distortion embedded in the obtained measurements is irrelevant. Another limitation of this method is the molar used as reference for the oc-clusal plane deinition; so, this method is applicable only when the irst molars are in a proper position. In cases with tipped irst molars or without them, we suggest the use of premolars as a substitute reference for the occlusal plane deinition, although this new coordinate system should be evaluated by other studies.
The greatest observed diference between the com-pared groups was of 0.8 mm, which grants this method a high precision. When comparing the results found for the three axes separately, it was observed that the Z-axis showed the worst result with bigger diferences in both intraexaminer evaluations. So, based on the results of this study, when evaluating mandibular anterior crowd-ing as proposed by this work, the operator should care-fully mark the points, especially in the vertical direction. The authors believe that this diference might have oc-curred due to the fact that the cervical-occlusal distance of the anterior teeth is bigger than the buccal-lingual distance; so, it is expected to observe more landmark variations in the vertical direction, when comparing to the anterior-posterior and transverse directions.
The paired t-test showed a statistical diference
be-tween both examiners when comparing RD and DX measurements, although it was an irrelevant clinical diference (0.55 mm and 0.51 mm, respectively; hence, 0.05 mm and 0.01 mm higher than the value stipulated in the sample size calculation). The greatest diference observed in the RD is because it represents the projec-tions of the axes (X, Y, Z), so small diferences in each axis are summed in the RD.
Although the digital dental models are well known and recently widely studied, it can still be considered a new diagnostic approach, not being used very oten by
most orthodontists worldwide, since there are additional costs that could limit the accessibility and the difusion of this three-dimensional method. Moreover, as any other technique, there is a learning curve for the clini-cian to be proicient in the use of digital dental models. The goal of this study was to propose a diagnostic tool that allows a comprehensive assessment of the man-dibular anterior crowding through the three-dimen-sional analysis that is available on the Geomagic Qualify sotware. More studies should be carried out using a true three-dimensional analysis of digital dental mod-els, through a customized coordinated system, in order to corroborate and/or reject the indings of the present study aiming to supply clinicians the best and accurate tools possible to support diagnosis, treatment planning at the same time it provides a more efective assessment of treatment results.
CONCLUSIONS
The results of this study indicated that:
» The proposed method of assessing the degree of mandibular anterior dental crowding in the three planes of space, using Cartesian coordinates in digital dental models, is precise and reproducible, although the accu-racy of the method was not tested.
» When comparing the three planes separately, it was concluded that the Z-axis showed the greatest variation in landmarks placement, indicating that it is necessary a special attention in vertical direction when evaluating mandibular anterior dental crowding using the method proposed by this study.
Authors’ contribution
1. Quimby ML, Vig KW, Rashid RG, Firestone AR. The accuracy and reliability of measurements made on computer-based digital models. Angle Orthod. 2004 June;74(3):298-303.
2. Mok CW, Zhou L, McGrath C, Hagg U, Bendeus M. Digital images as an
alternative to orthodontic casts in assessing malocclusion and orthodontic treatment need. Acta Odontol Scand. 2007;65(6):362-8.
3. Stevens DR, Flores-Mir C, Nebbe B, Raboud DW, Heo G, Major PW.
Validity, reliability, and reproducibility of plaster vs digital study models: comparison of peer assessment rating and Bolton analysis and their constituent measurements. Am J Orthod Dentofacial Orthop. 2006 June;129(6):794-803.
4. Zilberman O, Huggare JA, Parikakis KA. Evaluation of the validity of tooth size and arch width measurements using conventional and three-dimensional virtual orthodontic models. Angle Orthod. 2003 June;73(3):301-6. 5. Garino F, Garino GB. Digital treatment objectives: procedure and clinical
application. Prog Orthod. 2004;5(2):248-58.
6. Rheude B, Sadowsky PL, Ferreira A, Jacobson A. An evaluation of the use of digital study models in orthodontic diagnosis and treatment planning. Angle Orthod. 2005;75(3):300-4.
7. Sanches JO, Santos-Pinto LAM, Santos-Pinto A, Grehs B, Jeremias F. Comparison of space analysis performed on plaster vs. digital dental casts applying Tanaka and Johnston’s equation. Dental Press J Orthod. 2013;18(1):128-33.
8. Akyalcin S, Dyer DJ, English JD, Sar C. Comparison of 3-dimensional dental models from diferent sources: Diagnostic accuracy and surface registration analysis. Am J Orthod Dentofacial Orthop. 2013;144(6):831-7.
9. Lippold C, Kirschneck C, Schreiber K, Abukiress S, Tahvildari A, Moiseenko T, et al. Methodological accuracy of digital and manual model analysis in orthodontics: a retrospective clinical study. Comput Biol Med. 2015 July;62:103-9.
10. Reuschl RP, Heuer W, Stiesch M, Wenzel D, Dittmer MP. Reliability and validity of measurements on digital study models and plaster models. Eur J Orthod. 2016;38(1):22-6.
11. Santoro M, Galkin S, Teredesai M, Nicolay OF, Cangialosi TJ. Comparison of measurements made on digital and plaster models. Am J Orthod Dentofacial Orthop. 2003 July;124(1):101-5.
12. Sousa MVS, Vasconcelos EC, Janson G, Garib D, Pinzan A. Accuracy and reproducibility of 3-dimensional digital model measurements. Am J Orthod Dentofacial Orthop. 2012 Aug;142(2):269-73.
13. Correia GDC, Habib FAL, Vogel CJ. Tooth-size discrepancy: a comparison between manual and digital methods. Dental Press J Orthod. 2014 July-Aug;19(4):107-13.
REFERENCES
14. Leifert MF, Leifert MM, Efstratiadis SS, Cangialosi TJ. Comparison of space analysis evaluations with digital models and plaster dental casts. Am J Orthod Dentofacial Orthop. 2009;136(1):16.e1-4.
15. Ayoub A, Wray D, Moos KF, Jin J, Niblett TB, Urquhart C, et al. A three-dimensional imaging system for archiving dental study casts: a preliminary report. Int J Adult Orthodon Orthognath Surg. 1997;12(1):79-84. 16. Garino F, Garino GB. Comparison of dental arch measurements between
stone and digital casts. World J Orthod. 2002;3(3):250-4.
17. Fabels LNJ, Nijkamp PG. Interexaminer and intraexaminer reliabilities of 3-dimensional orthodontic digital setups. Am J Orthod Dentofacial Orthop. 2014;146(6):806-11.
18. Barreto MS, Faber J, Voguel CJ, Araujo TM. Reliability of digital orthodontic setups. Angle Orthod. 2016;86(2):255-9.
19. Im J, Cha J, Lee K, Yu H, Hwang C. Comparison of virtual and manual tooth setups with digital and plaster models in extraction cases. Am J Orthod Dentofacial Orthop. 2014;145(4):434-42.
20. Rossini G, Parrini S, Castrolorio T, Deregibus A, Debernardi CL. Diagnostic accuracy and measurement sensitivity of digital models for orthodontic purposes: a systematic review. Am J Orthod Dentofacial Orthop. 2016;149(2):161-70.
21. Cacheco C, Amberman BD, Hans MG, Palomo JM. A three-dimensional evaluation of Class II subdivision malocclusion correction using Cartesian coordinates. Semin Orthod. 2014;20(4):287-98.
22. Barrow GV, White JR. Developmental changes of the maxillary and mandibular dental arches. Angle Orthod. 1952;22(1):41-6.
23. Bjork A, Krebs A, Solow B. A method for epidemiological registration of malocclusion. Acta Odontol Stand. 1964;22(1):27-41.
24. Draker HL, Albany NY. Handicapping labio-lingual deviations: a proposed index for public health purposes. Am J Orthod. 1960;46(4):295-305. 25. Moorrees CFA, Reed RB. Biometrics of crowding and spacing of the teeth of
the mandible. Am J Phys Anthropol. 1954;12(1):77-88.
26. Proit WR, Ackerman JL. Rating the characteristics of malocclusion: a systematic approach for planning treatment. Am J Orthod. 1973;64(3):258-69.
27. Salzmann JA. Handicapping malocclusion assessment to establish treatment priority. Am J Orthod. 1968;54(10):749-65.
28. Summers CJ. The occlusal Index: A system for identifying and scoring occlusal disorders. Am J Orthod. 1971;59(6):552-67.
29. Van Kirk LE Jr, Pennell EH. Assessment of malocclusion in population groups. Am J Public Health. 1959;49(9):1157-63.