Abstract— In this paper we present a novel heuristic approach that increases the accuracy of the K-means algorithm. K-means is a widely used iterative clustering algorithm but usually converges to a local best solution away from the optimal one. While some of the resulting clusters may include more than one natural cluster, some others may not correspond to any natural cluster. After several K-means iterations, clusters of each type are heuristically located in the proposed algorithm. The cluster of latter type is removed and a new cluster is introduced in the cluster of former type. Experimental results show that, our approach not only improves the results produced by the state of art K-means methods if it is employed as post process, but also outperforms them when initialized randomly.
Index Terms— Clustering, initialization, K-means, perturbative-heuristics
I. INTRODUCTION
Clustering is to split data into subgroups according to some selected features of the samples. It aims to reveal similarity information about samples. A vast amount of heuristic and metaheuristic algorithms having various objective functions are developed to solve the clustering problem [12]. K-means is one of the oldest but still widely used algorithms [9]. It starts with some initial cluster centers (centroids). Samples are assigned to the clusters which have the nearest center points. Later cluster centers are updated to the center of gravity of the cluster members. Application of this process iteratively minimizes the objective function which is the total distance between samples and their cluster centers. The algorithm is terminated when the convergence is achieved or the change of the location of the center points decreases below a threshold value.
K-means is an iterative improvement method; however the global optimum is not guaranteed [13]. The algorithm may be trapped in a local best solution. Running K-means algorithm for a number of times and selecting the best solution according to objective function value may improve performance of standard K-means [13, 14]. As the number of clusters increases, the chance of converging to a local optimum increases as well. So, while restarting K-means algorithm improves the result for small number of clusters, a constant number of repetitions does not benefit much for
Manuscript received July 23, 2012; revised August 11, 2012. Hakan Gumus is with the Computer Engineering Department, Gebze Institute of Technology, Gebze, Turkey (phone: +90-555-686-9191, e-mail: [email protected])
Fatih Erdogan Sevilgen is with the Computer Engineering Department, Gebze Institute of Technology, Gebze, Turkey (e-mail:
problems which have large number of clusters, i.e., number of repetitions should be increased as K gets larger.
There are two main kinds of approaches employed to improve the performance of the K-means algorithm [3]. One is to use perturbative heuristics. In this approach, improvements are made on an initial solution. For this kind of heuristics, using good starting center locations is essential since it may converge to a local optimum. The other approach is to use constructive heuristics. In this approach, each center location is constructed consecutively. These heuristics could also be used as initial center points for the perturbative heuristics.
There has been a great deal of research on constructive heuristics [9]. In [2], (Refining K-means), clustering subsamples of data for a number of times is suggested. It creates a new data which consists of the center points obtained after all trials. Then, clustering this new data gives new initial center points. In [8], it is proposed to select centroids in turn. A new sample selected as centroid which has maximum distance to the closest one of the formerly selected centroids. The procedure continues until all K center points are found. In [1] (K-means++), a similar approach is suggested. The centers are selected iteratively. Each candidate point has the chance proportional to its distance to the nearest center.
The second kind of procedure is not as widespread as the first one. Main drawback of the heuristic methods which use this approach is the speed. In [4], a neighborhood is defined as to change a sample with a cluster center. In each turn, a sample and cluster center pair is selected according to the change in the objective function value. A genetic algorithm is suggested in [6] to find the optimal solution. It uses K-means algorithm as crossover and a distance based strategy as mutation. In [5], a tabu search procedure is used. Initial centroids are found by using K-means algorithm. Then tabu search is used to improve the solution. The cluster ids of the samples are changed using various neighborhood structures. Although these methods provide improvement over standard K-means, they require relatively long execution times.
In our method, clusters' own fitness values are used to change the centroid locations iteratively. So, the algorithm can be considered as a cluster based perturbation method.
When the standard K-means algorithm runs, some of the centroids are converged to the center of their natural clusters (real clusters which are independent from algorithms). However, some of them are not. These clusters are either does not correspond to a natural cluster (placed between natural clusters) or include samples from other clusters besides a natural cluster. We call the former as superfluous clusters and later as oversized clusters. Superfluous and oversized clusters are observed even when the clusters are
Refining K
-
means Algorithm by Detecting
Superfluous and Oversized Clusters
homogenous, spherically shaped, and separated by a certain distance.
Our method is based on following two facts about superfluous and oversized clusters: An oversized cluster includes parts of other natural clusters which usually do not have any assigned centroids. Since we assume that the actual number of clusters (K) is known, if there is a superfluous cluster, there should be at least one oversized cluster as well.
In our algorithm, first, several iterations of K-means algorithm are performed to find initial centroid locations. Later, the center of a superfluous cluster is moved to a randomly selected sample in an oversized cluster and several K-means iterations are employed to improve the current centroids. The relocation of the centers and K-means iterations continues until no more further improvement is achieved.
The algorithm is tested using some real world data from UCI respiratory. To examine the weaknesses and strong sides of the algorithm several experiments on synthetic datasets obtained by CARP [7] dataset generator are performed as well. CARP generator offers means to change the number of dimensions, overlap percentage between clusters, homogeneity, and distribution style and number of clusters. Our algorithm achieved global optimum for most of
obtained good results for harder datasets.
The structure of the paper is as follows. Section 2 introduces the metrics which are used to locate superfluous and oversized clusters and the proposed SO K-means algorithm. In section 3, experimental datasets are presented and our algorithm is compared with the state of art K-means methods experimentally. We conclude the paper in section 4.
II. METHODOLOGY A. Intuition
As mentioned earlier, the proposed algorithm is different from other methods as cluster fitness values are employed besides the regular K-means objective function. By using these fitness values, oversized and superfluous clusters are identified.
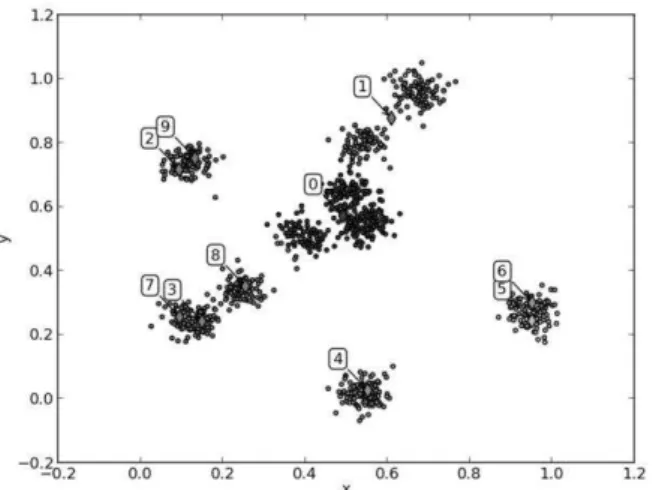
In the following, the supporting idea and the terminology used are explained with the example in Fig. 1. There are 10 clusters with zero covariance, Gaussian distribution and equal mixing proportions in the example dataset. Even if it is a simple data, in experiments, K-means result in Fig. 1 (a) where cluster centers converges to some local optima apart from the global one is observed. It is easily seen that, while Fig. 1 (a). Cluster distribution after k-means algorithm with random
initial centers converged.
Fig. 1 (b). Cluster distribution after first SO iteration.
Fig. 1 (c). Cluster distribution after second SO iteration.
(3, 7), (5, 6)}, others do not have any centroid. The members of such natural clusters are assigned to some clusters which have the nearest centroids {0, 1}. In this paper, the name “superfluous cluster” is used for the clusters which do not correspond to any natural cluster but located in a natural cluster with other clusters i.e., clusters 2, 9, 3, 7, 5 and 6. The clusters which include a natural cluster and parts of other clusters are called “oversized clusters” i.e., cluster 0 and 1. So, moving the center of a superfluous cluster to a position in an oversized cluster may improve clustering result. Fig. 1 (b) shows the clusters after moving the center of a superfluous cluster (cluster 2) to a sample in an oversized cluster (cluster 1) and performing several K-means iterations. Here, the clusters 2 and 9 perfectly correspond to natural clusters. Similarly in Fig. 1 (c), the center of cluster 7 and in Fig. 1 (d) the center of cluster 6 are relocated to more natural places.
B. Metrics
Detecting superfluous and oversized clusters is the core of our algorithm. However, identifying a cluster as a superfluous or oversized is a rather hard problem. So we propose heuristic metrics to identify the most probable superfluous and oversized clusters.
Cluster Absence Metric (CAM)
Assume cluster centers are converged after a number of K-means iterations. If a center is removed and all members of the corresponding cluster are assigned to other nearest clusters, WSS (Within group Sum of Square Distance) value increases. This increase is called Cluster Absence Metric. If nearest clusters are not far away from the members compared to the removed center, the increase in WSS will be small. If a cluster’s absence metric is small the cluster is dispensable, i.e., the cluster does not correspond to a natural cluster. The cluster which has smallest CAM is the most probable Superfluous Cluster. In the algorithm such a cluster is removed without a considerable increase in the WSS.
It is quite clear that, the cluster absence metric is not a good indicator for an oversized cluster. Even though deleting an oversized cluster is a costly operation, removing a natural cluster which is far away from all other clusters can be costlier. So, other metrics for detection of oversized clusters are required.
Cluster Presence Metric (CPM)
CPM is the WSS value of the members of an individual cluster. If member counts of the clusters are similar, and the distributions of the clusters are not so different from each other, the oversized clusters will most likely have larger CPM value, compared to the natural or superfluous clusters.
Normalized Cluster Absence Metric (NCAM)
NCAM value of a cluster is calculated by dividing its CAM value by the number of cluster members. If the member counts of the clusters vary excessively, this metric offers a standard comparison independent of member counts.
Normalized Cluster Presence Metric (NCPM)
NCPM value of a cluster is calculated by dividing its CPM value by its member count. This metric also offers a standard comparison independent of the member counts of clusters.
Two Nearest Center Metric (NCM)
It is calculated by dividing CPM value by CAM value. If the members of the cluster are all on the center the value of the metric is 0, but if the nearest centers of other clusters are as close as the removed center the value approaches to 1.
Experiments indicate that CAM and CPM are more accurate metrics than others for detecting the most probable superfluous and oversized clusters, respectively.
C. The Algorithm
Let be a dataset with N
observations, be a set of K clusters, and
be the set of centroids
corresponding to these clusters. The objective is to minimize Within Cluster Sum of Square distance (WSS) value:
∑ ∑ ‖ ‖
where is an indicator function specifying whether belongs to kth cluster.
The K-means Clustering Algorithm
1) Initialization: Start the algorithm with given K p-dimensional centroids,
2) Expectation: Assign each data point to the cluster which has closest center point.
{
‖
‖
3) Maximization: Calculate each cluster’s center point as the mean (center of gravity) of all the data points.
∑
∑
4) Termination: If WSS value does not converge then go to Step 2, else stop.
The Proposed Algorithm (SO)
1) Initialization: Run K-means algorithm with randomly assigned K p-dimensional means, or with an initialization algorithm to obtain updated . 2) Finding Superfluous Cluster: For all extract
rth center point and assign members of cluster to the clusters which have nearest centers to them.
{
‖
‖
∑ ∑
‖
‖
Calculate new WSS values for each of these solutions as , and select the one which has minimum value as
3) Finding Oversized Cluster: Calculate the WSS values of each cluster separately, and select the one which has the greatest value.
∑
‖
‖
4) Moving the Centroid: Randomly select a member of the oversized cluster, and make it the center point of the superfluous cluster.
5) Update: Run K-means algorithm to update the centroids .
6) Termination: If WSS value does not converge then go to Step 2, else stop.
The most probable superfluous and oversized clusters are determined during the maximization phase. This process increases the complexity of the K-means algorithm by a constant factor. The proposed algorithm uses K-means to converge the centers after each center movement. When a movement does not decreases the WSS value, the algorithm stops. So the complexity of the algorithm is the complexity of the K-means multiplied by the number of center movements. Additionally, apart from the first K-means run, other runs which are used after each center movement terminates much faster than the standard K-means
algorithm, because most of the cluster centers and their members do not changed during the process.
III. EXPERIMENTS
It is possible to use many real-world datasets to compare the performance of the K-means refinement algorithms. However it is not easy to analyze the performance of the algorithms on these datasets, since their inner structure is not known [7]. Some datasets are biased towards some algorithms. CARP dataset generator is proposed to overcome this deficiency and to be a new testing environment for the machine learning algorithms.
CARP generator offers generalized overlap criterion for the hardness of the datasets. For experimental evaluation, datasets with various complexities are generated using this criterion. The generated datasets have 2 dimensions; 5, 10, 20, 50, 100 clusters; 500, 1000, 2000, 5000, 10000 samples (each cluster has 100 sample on its own) and 0.001, 0.05, 0.01 generalized overlap values. They are homogenous and spherically distributed.
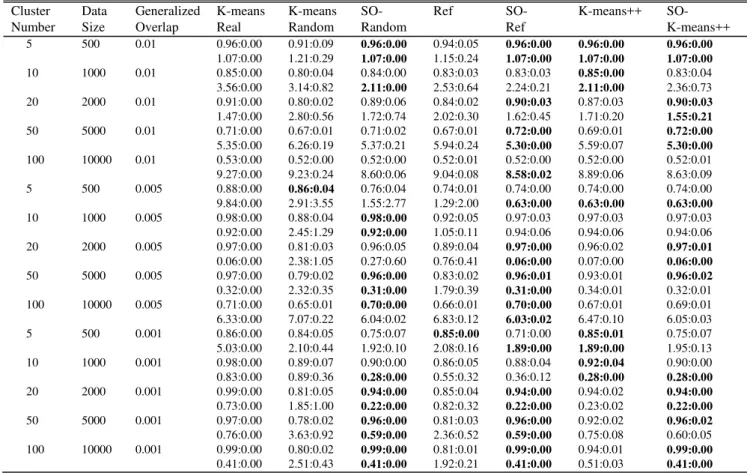
Experiments on real-world datasets are performed as well. Cloud [10] and Spam [11] datasets are selected from the UC-Irvine Machine Learning Repository since they are also used in [1] and [9] for performance analysis. The Cloud dataset includes 1024 points in 10 dimensions. It is Philippe Collard’s cloud cover database. The Spam dataset on the other hand includes 4601 points in 58 dimensions. It represents features available to an e-mail spam detection system. For each dataset, experiments for 10, 25, and 50 clusters are performed similar to [1] and [9].
In the experiments, all algorithms are allowed to take the same amount of computer time on the average. Faster
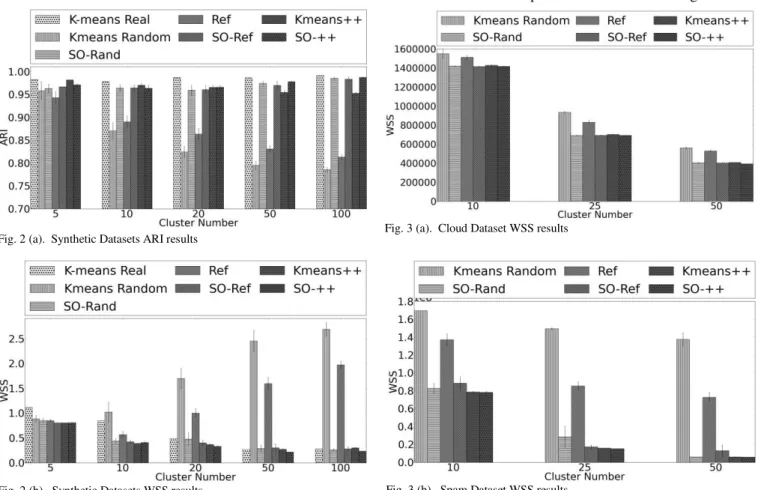
Fig. 2 (a). Synthetic Datasets ARI results
Fig. 2 (b). Synthetic Datasets WSS results
Fig. 3 (a). Cloud Dataset WSS results
algorithms repeated several times and the best solutions which have smallest WSS are selected.
To have more accurate results, 10 datasets for each type of combination are generated and 10 repetitions are performed for each dataset.
The performances of the algorithms are compared using adjusted rand index (ARI), and WSS values.
The mean and standard deviation of the ARI and WSS values of the algorithms are graphically shown for different number of clusters in Fig. 2 (a) and 2 (b). ARI values gets close to 1 as the correct clusters are found. For each dataset,
the first bar is for the K-means algorithm initialized with real center points. The second bar shows the K-means algorithm with random initialization. As we see from the figure the performance of standard K-means algorithm decreases dramatically as the number of clusters increases. The 4th bar is for the Refining k-means [2] algorithm. It has similar performance decrease as well. The 6th bar is for K-means++ [1]. Although, there is a decrease in the ARI value while number of clusters increases, it is not as severe as the first two algorithms. The 3rd, 5th and 7th bars shows the performance of the proposed algorithm (SO) with initialization of random centers, refining means and
K-TABLEII
AVERAGE REPETITION OF ALGORITHMS FOR EACH DATASET Cluster
Number
Data Size Generalized Overlap
K-means Random
SO- Random
Ref SO-
Ref
K-means++ SO- K-means++
5 500 0.01 6.01 1.40 1.98 1.00 6.62 1.49
10 1000 0.01 4.93 1.13 2.15 1.00 5.46 1.36
20 2000 0.01 5.11 1.04 2.53 1.02 5.72 1.41
50 5000 0.01 5.83 1.02 3.66 1.01 6.28 1.21
100 10000 0.01 5.34 1.01 3.89 1.04 5.78 1.22
5 500 0.005 6.30 1.40 1.88 1.00 6.93 1.56
10 1000 0.005 5.38 1.14 2.15 1.00 6.03 1.45
20 2000 0.005 5.49 1.06 2.53 1.01 6.17 1.54
50 5000 0.005 7.17 1.01 3.78 1.02 8.23 1.68
100 10000 0.005 8.29 1.03 5.15 1.05 9.09 1.34
5 500 0.001 6.69 1.41 2.01 1.00 7.49 1.62
10 1000 0.001 5.74 1.17 2.26 1.00 6.96 1.66
20 2000 0.001 5.82 1.09 2.58 1.01 7.19 1.83
50 5000 0.001 7.41 1.00 3.69 1.03 8.69 2.23
100 10000 0.001 10.59 1.01 5.43 1.04 12.04 2.46
The average numbers of repetitions of each algorithm for each dataset. TABLEI
ARI AND WSSVALUES OF ALGORITHMS WITH MEAN AND STD VALUES FOR EACH DATASET Cluster Number Data Size Generalized Overlap K-means Real K-means Random SO-Random
Ref SO-
Ref
K-means++ SO- K-means++ 5 500 0.01 0.96:0.00
1.07:0.00 0.91:0.09 1.21:0.29 0.96:0.00 1.07:0.00 0.94:0.05 1.15:0.24 0.96:0.00 1.07:0.00 0.96:0.00 1.07:0.00 0.96:0.00 1.07:0.00 10 1000 0.01 0.85:0.00
3.56:0.00 0.80:0.04 3.14:0.82 0.84:0.00 2.11:0.00 0.83:0.03 2.53:0.64 0.83:0.03 2.24:0.21 0.85:0.00 2.11:0.00 0.83:0.04 2.36:0.73 20 2000 0.01 0.91:0.00
1.47:0.00 0.80:0.02 2.80:0.56 0.89:0.06 1.72:0.74 0.84:0.02 2.02:0.30 0.90:0.03 1.62:0.45 0.87:0.03 1.71:0.20 0.90:0.03 1.55:0.21 50 5000 0.01 0.71:0.00
5.35:0.00 0.67:0.01 6.26:0.19 0.71:0.02 5.37:0.21 0.67:0.01 5.94:0.24 0.72:0.00 5.30:0.00 0.69:0.01 5.59:0.07 0.72:0.00 5.30:0.00 100 10000 0.01 0.53:0.00
9.27:0.00 0.52:0.00 9.23:0.24 0.52:0.00 8.60:0.06 0.52:0.01 9.04:0.08 0.52:0.00 8.58:0.02 0.52:0.00 8.89:0.06 0.52:0.01 8.63:0.09 5 500 0.005 0.88:0.00
9.84:0.00 0.86:0.04 2.91:3.55 0.76:0.04 1.55:2.77 0.74:0.01 1.29:2.00 0.74:0.00 0.63:0.00 0.74:0.00 0.63:0.00 0.74:0.00 0.63:0.00 10 1000 0.005 0.98:0.00
0.92:0.00 0.88:0.04 2.45:1.29 0.98:0.00 0.92:0.00 0.92:0.05 1.05:0.11 0.97:0.03 0.94:0.06 0.97:0.03 0.94:0.06 0.97:0.03 0.94:0.06 20 2000 0.005 0.97:0.00
0.06:0.00 0.81:0.03 2.38:1.05 0.96:0.05 0.27:0.60 0.89:0.04 0.76:0.41 0.97:0.00 0.06:0.00 0.96:0.02 0.07:0.00 0.97:0.01 0.06:0.00 50 5000 0.005 0.97:0.00
0.32:0.00 0.79:0.02 2.32:0.35 0.96:0.00 0.31:0.00 0.83:0.02 1.79:0.39 0.96:0.01 0.31:0.00 0.93:0.01 0.34:0.01 0.96:0.02 0.32:0.01 100 10000 0.005 0.71:0.00
6.33:0.00 0.65:0.01 7.07:0.22 0.70:0.00 6.04:0.02 0.66:0.01 6.83:0.12 0.70:0.00 6.03:0.02 0.67:0.01 6.47:0.10 0.69:0.01 6.05:0.03 5 500 0.001 0.86:0.00
5.03:0.00 0.84:0.05 2.10:0.44 0.75:0.07 1.92:0.10 0.85:0.00 2.08:0.16 0.71:0.00 1.89:0.00 0.85:0.01 1.89:0.00 0.75:0.07 1.95:0.13 10 1000 0.001 0.98:0.00
0.83:0.00 0.89:0.07 0.89:0.36 0.90:0.00 0.28:0.00 0.86:0.05 0.55:0.32 0.88:0.04 0.36:0.12 0.92:0.04 0.28:0.00 0.90:0.00 0.28:0.00 20 2000 0.001 0.99:0.00
0.73:0.00 0.81:0.05 1.85:1.00 0.94:0.00 0.22:0.00 0.85:0.04 0.82:0.32 0.94:0.00 0.22:0.00 0.94:0.02 0.23:0.02 0.94:0.00 0.22:0.00 50 5000 0.001 0.97:0.00
0.76:0.00 0.78:0.02 3.63:0.92 0.96:0.00 0.59:0.00 0.81:0.03 2.36:0.52 0.96:0.00 0.59:0.00 0.92:0.02 0.75:0.08 0.96:0.02 0.60:0.05 100 10000 0.001 0.99:0.00
0.41:0.00 0.80:0.02 2.51:0.43 0.99:0.00 0.41:0.00 0.81:0.01 1.92:0.21 0.99:0.00 0.41:0.00 0.94:0.01 0.51:0.03 0.99:0.00 0.41:0.00 ARI mean : ARI standard deviation
means++, respectively. Given the same amount of time, it is clear that the proposed clustering algorithm outperforms other algorithms and the best performance is achieved when it is used with K-means++ algorithm. Similar observations are possible in Fig. 2 (b). Note that smaller WSS value means that the algorithm produces better result.
The detailed list of results is presented in Table I. For different number of clusters and different generalized overlap values, given the same amount of time, the table shows the mean and standard deviation values of the ARI and WSS results. The best performers are indicated using the bold font. In Table II, the average numbers of repetitions of each algorithm in these experiments are presented. It can be seen from the table that the run time of the SO algorithm compare to the K-means does not change much as the cluster number increases and it is just 4-7 times slower. So, in order to achieve better results, the proposed algorithm is advised instead of running the K-means algorithm for a constant number of times.
For real world datasets (see Fig. 3 (a) and 3 (b)), the performance results are similar. Running K-means++ algorithm several times produces quite good results, however given the same amount of time the proposed algorithm outperforms it when it uses the results of a K-means++ run as initial solution.
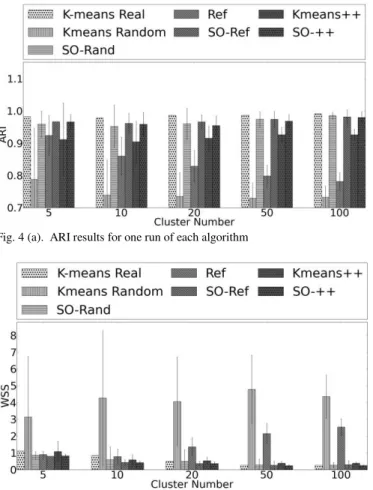
Additionally, in Fig. 4 (a) and 4 (b), we present the results of synthetic datasets which are obtained by running the algorithms until they converge without any time limitation. The figures show the incremental effect of the proposed (“SO”) method on the clusters obtained by 3 K-means initialization algorithms.
IV. CONCLUSION
In this paper, a novel method is proposed to increase the effectiveness of K-means clustering algorithm. The proposed algorithm given the same amount of time produces promising results compared to state of art refining algorithms. It can also be used after K-means algorithms to improve their results.
We define the notion superfluous and oversized clusters, and propose new metrics to locate such clusters. In the future we would like to investigate other metrics to improve the effectiveness of the proposed algorithm.
The method can also be improved by using metaheuristic approaches and/or by moving more cluster centers each time. Even though metaheuristics have time disadvantage, they are effective methods to escape from local optimum.
REFERENCES
[1] D. Arthur and S. Vassilvitskii, “k-means++: The advantages of careful seeding,” ACM-SIAM Symposium on Discrete Algorithms (SODA 2007) Astor Crowne Plaza, New Orleans, Louisiana, pp. 1– 11, 2007.
[2] P. S. Bradley and U. M. Fayyad, “Refining initial points for K-Means clustering,” in Proc. 15th International Conf. on Machine Learning.Morgan Kaufmann, San Francisco, CA, 1998, pp. 91–99. [3] E. K. Burke, M. Hyde, G. Kendall, G. Ochoa,E. Ozcan, and J. R.
Woodward. A classifcation ofhyper-heuristic approaches. In M. Gendreau and J. Potvin, editors, Handbook of Meta-Heuristics 2nd Edition, pages 449{468. Springer, 2010
[4] P. Hansen and N. Mladenoviæ, “J-means: A new local search heuristic for minimum sum of squares clustering,” Pattern Recognit., vol. 34, pp. 405–413, 2001
[5] Kharrousheh, A., S. Abdullah and M.Z.A. Nazri, A modified tabu search approach for the clustering problem. J. Applied Sci., 11: 3447-3453 2011.
[6] K. Krishna and M. Murty, “Genetic K-means algorithm,” IEEE Trans. Syst., Man, Cybern. B, Cybern., vol. 29, no. 3, pp. 433–439, Jun. 1999
[7] Melnykov and Maitra, V. Melnykov, R. Maitra CARP: Software for fishing out good clustering algorithms Journal of Machine Learning Research, 12 (2011), pp. 69–73 2011
[8] B. Mirkin, Clustering for data mining: A data recovery approach.London: Chapman and Hall, 2005
[9] A. D. Peterson, A. P. Ghosh, and R. Maitra. A systematic evaluation of different methods for initializing the k-means clustering algorithm. Technical Report 07, Iowa State University, Department of Statistics, Ames, A, 2010.
[10] Philippe Collard’s cloud cover database. ftp://ftp. ics.uci.edu/pub/machine-learning-databases/
undocumented/taylor/cloud.data. [11] Spam e-mail database.
http://www.ics.uci.edu/mlearn/databases/spambase/.
[12] Rui Xu; Wunsch, D., II; , "Survey of clustering algorithms," Neural Networks, IEEE Transactions on , vol.16, no.3, pp.645-678, May 2005 doi: 10.1109/TNN.2005.845141
[13] U. von Luxburg. Clustering stability: An overview. Foundations and Trends in Machine Learning, 2(3):235{274, 2010.
[14] U. von Luxburg, R. C. Williamson, and I. Guyon. Clustering: Science or art? In ICML 2011 Unsupervised and Transfer Learning Workshop. JMLR W&CP, this volume, 2012
Fig. 4 (a). ARI results for one run of each algorithm