of tropical dissolved organic carbon (DOC)
S. Cook
1, M. Peacock
2, C.D. Evans
3, S.E. Page
1, M. Whelan
1, V. Gauci
2and K.L. Khoon
41 Centre for Landscape & Climate Research, Department of Geography, University of Leicester, UK 2 Department of Environment, Earth and Ecosystems, The Open University, Milton Keynes, UK
3 Environment Centre Wales, Centre for Ecology and Hydrology, Bangor, UK
4 Biological Research Division, TPRI, Malaysian Palm Oil Board, Kajang, Selangor, Malaysia
_______________________________________________________________________________________
SUMMARY
Fluvial fluxes of dissolved organic carbon (DOC) may represent an important loss for terrestrial carbon stores in the tropics. However, there is currently limited guidance on the preservation of tropical water samples for DOC analysis. Commonly employed preservation techniques such as freezing or acidification can limit degradation but may also alter sample properties, complicating DOC analysis. We examined the effects of cold storage at 4 °C on DOC concentration and quality in water samples collected from a tropical peat catchment. Samples were stored in the dark at 4 °C for periods of 6–12 weeks. Freeze/thaw experiments were also made. Mean DOC concentrations in samples stored for six weeks at 4 °C were 6.1 % greater than in samples stored at ambient room temperature (33 °C) over the same period. Changes in DOC concentrations, in two sample sets, during cold storage were 2.25 ± 2.9 mg L-1 (8 %) to 2.69 ± 1.4 mg L-1 (11 %) over a 12-week period.
Freeze/thaw resulted in alterations in the optical properties of samples, and this in turn altered the calculated DOC concentrations by an average of 10.9 %. We conclude that cold storage at 4 °C is an acceptable preservation method for tropical DOC water samples, for moderate time periods, and is preferable to freezing or storage at ambient temperatures.
KEY WORDS: freezing, oil palm estate, refrigeration, sample storage, tropical peat, water samples
_______________________________________________________________________________________
INTRODUCTION
Dissolved organic carbon (DOC) is increasingly being recognised as an important component of the global carbon cycle (Cole et al. 2007). The fluvial transport of DOC provides an important pathway for carbon transfer from terrestrial to aquatic ecosystems (Kalbitz et al. 2000, Freeman et al. 2004). DOC is biologically and chemically reactive (Cauwet 2002, Benner2004,Mooreetal.2011),leadingtoimportant emissions of carbon dioxide to the atmosphere (Evans et al. 2012, 2015; Muller et al. 2015).
The susceptibility of DOC to microbial and photochemical degradation makes the long-term storage of DOC water samples challenging, with guidance suggesting that analysis should take place within 48 hours of sampling (Karanfil et al. 2002). When this is not possible, attempts are often made to preserve samples; i.e. to limit biological, chemical and physical changes so that the samples can be stored and analysed later. Common preservation practices include freezing and acidification (Moore et al. 2011, Peacock et al. 2014). However, these can alter both the concentration of DOC and its absorbance and fluorescence properties, influencing
the specific UV absorbance at 254 nm (SUVA254) and
E ratios (ratios of absorbance at different wavelengths: Spencer et al. 2007, Fellman et al. 2008, Peacock et al. 2015). These ratios give an insight into the specific structural and compositional properties of DOC (Thurman 1985, Peacock et al. 2014). The E2:E3 ratio (254 nm:350 nm), is often used as an indicator of aromaticity and the molecular weight of humic substances (Peuravuori & Pihlaja 1997). SUVA254 is also a measure of aromaticity;
high SUVA254 values indicate high recalcitrance
Peacock et al. (2014, 2015) have investigated the effectiveness of cold storage at 4 °C as an alternative DOC preservation method. Peacock et al. (2014) reported little change in the absorbance properties of DOC in water samples collected from a UK ombrotrophic peatland when filtered and stored at 4 °C for a period of 12 weeks. A second study found that only 5 % of DOC was lost in cold storage over a similar period (Peacock et al. 2015). Additional studies found no significant changes in DOC concentrations in samples stored at 4 °C for periods of two weeks and 7–17 weeks, respectively (Ekström
et al. 2011, Carter et al. 2012).
Taken together, these investigations suggest that storing filtered water samples in the dark at 4 °C is viable for medium-term (e.g. 2–17 weeks) preservation of DOC and that this storage method does not hinder subsequent DOC analyses. However, these studies were all focused on water samples collected from temperate peatlands. We know of no published study of the effectiveness of cold storage on the quality and quantity of DOC in samples collected from tropical peatlands. Recently there has been a strong interest in DOC losses from tropical peatland catchments (Sjogersten et al. 2014, Muller
et al. 2015), particularly in relation to anthropic disturbance (Moore et al. 2011, 2013). This has been driven, in part, by a realisation that losses of carbon from tropical peatlands to ‘blackwater’ rivers may be substantial (Evans et al. 2014), coupled with the recognition that these areas function as significant long-term carbon stores (Page et al. 2011). Investigations of tropical systems tend to be carried out in remote places with limited on-site laboratory facilities. Robust sample preservation methods are, therefore, paramount.
The two aims of our investigation were:
(1) to quantify the effect of cold storage on the concentration and quality of tropical DOC; and
(2) to assess whether quantitative and qualitative DOC changes during the storage of samples from tropical peatlands differ from those in samples from high latitudes.
METHODS
The study sites were in the Malaysian province of Sarawak, northern Borneo, Southeast Asia. This region is characterised by an equatorial climate with high temperatures throughout the year (mean 26 °C), and heavy rainfall (3000 mm yr-1) without a distinct
dry season (Melling et al. 2005). Water samples were collected from the Sebungan and Sabaju oil palm estates, east of the coastal town of Bintulu (from
3°07.81′ N to 3°14.91′ N, and 113°18.72′ E to 113°32.19′ E). The estates belong to the Sarawak Oil Palms Berhad (SOPB), Bintulu division, and cover a total area of 9,614 ha.
All water samples were collected and stored in 60 ml transparent polypropylene Nalgene® bottles.
Electrical conductivity (μS cm-1), pH and
temperature (°C) were measured on the unfiltered samples as they were collected. The bottled samples were transported immediately back to the field laboratory. There, samples were filtered through 0.45 μm cellulose nitrate membrane filters using a hand-operated suction pump. Two preservation experiments were conducted. In Experiment 1, DOC concentrations in refrigerator-stored samples were compared to those in samples stored at ambient temperature for a period of six weeks. In Experiment 2, DOC concentrations were determined on samples a short time (within five days) after collection and compared with concentrations determined on the same samples after cold storage (at 4 °C) for approximately 12 weeks. Details of these experiments follow.
Experiment 1. Effect of cold storage on DOC quantity and quality
Ten 60 ml water samples were collected from drainage ditches within the Sebungan oil palm plantation estate on 14 April 2015. Average water sample pH was 3.7, with temperature and electrical conductivity averaging 26 °C and 167 μS cm-1,
respectively. After filtration each sample was divided, resulting in two sets of identical samples. The 30 ml sub-samples were stored in 60 ml bottles (30 ml of sample + 30 ml of air). One set was placed in a refrigerator at 4 °C and the other was stored at ambient temperature (around 33 °C) in a dark cabinet for a period of six weeks, after which samples were transported in polystyrene boxes, by courier, back to the UK. Total transport time was no more than four days, during which samples were kept in air-conditioned facilities (<18 °C).
Upon return to the UK, samples were analysed using the non-purgeable organic carbon (NPOC) method (Sharp 1993) on a Shimadzu Total Carbon Analyser. The samples were acidified by syringe injection with 1 M hydrochloric acid to pH <3, then sparged with purified air to remove any inorganic carbon (IC) (Sharp 1993). Total organic carbon was then measured using a non-dispersive infrared sensor and subsequently compared to a NPOC calibration curve with standards range 0–100 mg L-1. In addition,
400, 600 and 700 nm. This allowed the quality of the DOC to be quantified by calculating the E2:E3, E2:E4 and E4:E6 ratios, along with SUVA254 which
was calculated as:
SUVA
254=
�254�DOC
× 100
[1]where SUVA254 has units of L mg-C-1 m-1, A254 is the
absorbance at 254 nm and CDOC is the DOC
concentration (mg L-1).
Experiment 2. DOC changes during cold storage and the effect of freeze/thaw
An additional 34 water samples were collected from drainage ditches within both oil palm estates (Sebungan and Sabaju), on 03 August 2015 (sample set 1) and 05 October 2015 (sample set 2). Average pH was 3.6 for sample set 1 and 4.4 for sample set 2. For sample sets 1 and 2, respectively, average temperatures were 29 °C and 30 °C, and average electrical conductivity values were 200 μS cm-1 and
196 μS cm-1. Samples were filtered in the same way
as those collected on 14 April 2015 for Experiment 1 (see above) and stored at 4 °C for an average of 12 weeks (total cold storage time in both the UK and the tropics; range 73–101 days depending on the availability of analysis equipment). During this time, the samples were analysed (within five days of collection) on a portable Cole-Parmer UV/visible spectrophotometer at wavelengths of 270, 350, 400, 600 and 700 nm. DOC concentrations were determined using a two-wavelength approach (Tipping et al. 2009, Carter et al. 2012) and the universal calibration parameters outlined in Carter et al. (2012).
The samples were transported back to the UK as described for Experiment 1. Upon return to the UK, samples from set 1 (n=17) were re-analysed on a Cole-Parmer UV/visible spectrophotometer, across the same set of wavelengths, on 11 November 2015 (i.e. 101 days after sample collection). The same procedure was followed for sample set 2 (n=17) on 16 December 2015 (i.e. 73 days after sample collection). DOC concentrations were re-determined using the same two-wavelength approach (Tipping et al. 2009, Carter et al. 2012) as described above.
DOC concentrations determined at the field laboratory were compared with the post-storage concentrations determined in the UK in order to estimate changes in DOC concentration occurring during cold storage (4 °C) and transport (<18 °C).
After analysis, the 17 samples belonging to set 1 were frozen at -20 °C for 48 hours, then left to melt at ambient laboratory temperature in the dark. These
samples were then re-analysed for absorbance at 270, 350 and 700 nm.
Statistical analyses
Quantitative data analysis was performed using parametric statistical tests when appropriate (GraphPad Prism, version 6). Normality was tested using the Shapiro-Wilk test and homogeneity using the Bartlett test. Differences between samples were then assessed using t-tests (paired and un-paired) and ANOVAs. Where data were not normally distributed, Mann-Whitney, Wilcoxon, Kruskal Wallis and Friedman tests were used.
RESULTS
Experiment 1. Effect of cold storage on DOC quantity and quality
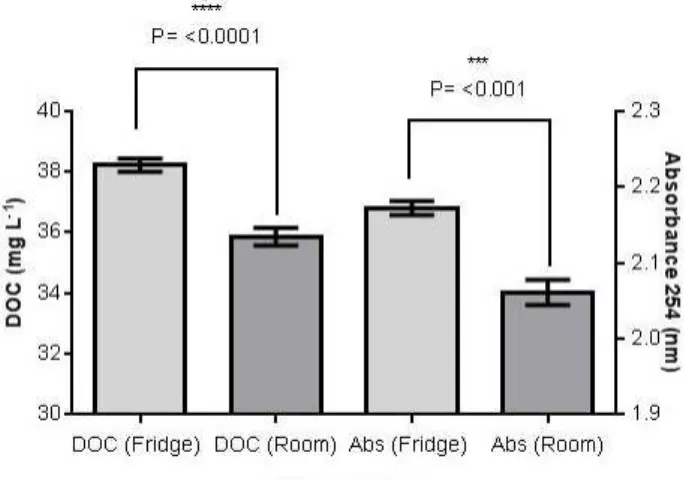
In Experiment 1, DOC concentrations were significantly greater in refrigerated samples (P≤0.0001) than in those stored at room temperature (Figure 1). Differences in concentrations ranged from 0.26 mg L-1 (0.7 % difference) to 3.79 mg L-1 (9.9 %
difference). The mean DOC concentration from the refrigerated samples was 6.1 % (2.4 ± 0.4 mg L-1)
greater than that from samples stored at ambient temperature. Similarly, absorbance at 254 nm was significantly greater (P≤0.001) in refrigerated samples than in those stored at room temperature (Figure 1), by an average of 0.11 ± 0.02.
SUVA254 values ranged between 5.6 and 5.9
L mg-C-1 m-1 for all samples in Experiment 1. These
values are high compared with those reported for river systems, in both northern(1.3–4.5 L mg-C-1 m-1)
andtropical(3.7–4.1 L mg-C-1 m-1)latitudes (Spencer
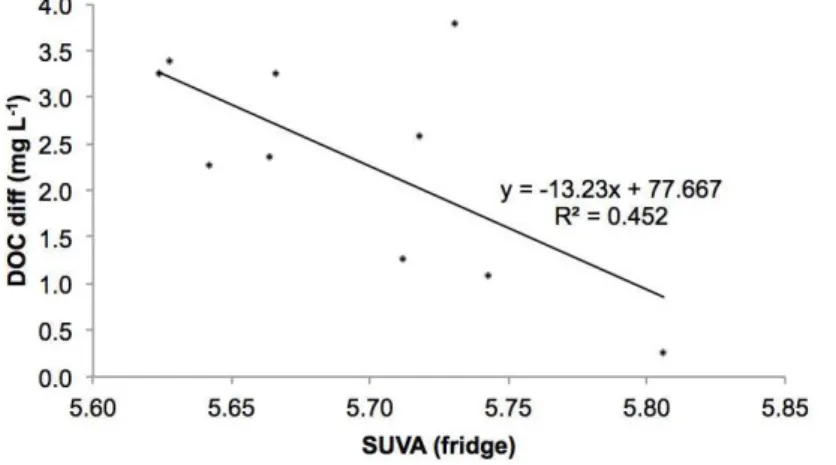
et al. 2008, Moore et al. 2013). A statistically significant negative relationship (Figure 2) was found
between SUVA254 and differences in DOC
concentrations (R2 =0.45; P≤0.05). This shows that
high values of SUVA254, an indicator of recalcitrance,
correlate with low DOC differences between storage techniques and, thus, suggests that recalcitrant DOC in samples stored at room temperature may be less susceptible to biodegradation over time. However, due to the small range in our SUVA254 values, these
findings cannot conclusively support SUVA254 as an
indicator for DOC aromaticity.
Experiment 2. DOC changes during cold storage
Absorbance changes
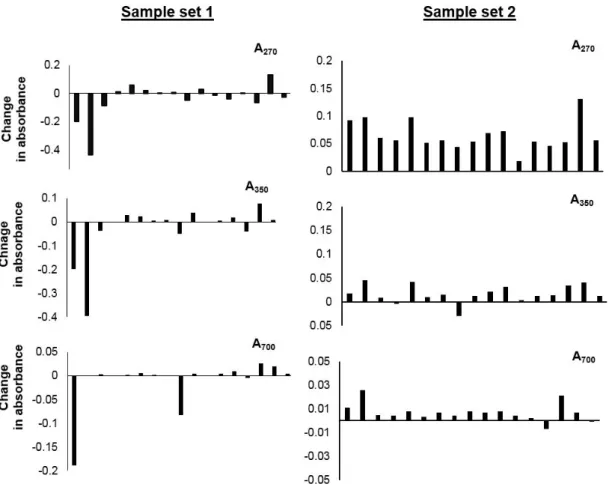
Differences in absorbance measured immediately after sampling and after approximately 12 weeks of cold storage are shown in Figure 3. In sample set 1, absorbance gains were displayed in nine samples and losses in eight samples, at wavelengths of both 270 nm and 350 nm. At a wavelength of 700 nm, absorbance gains were recorded in ten samples and losses in three samples, whilst four samples showed no change. In contrast, sample set 2 exhibited gains in all samples at 270 nm, and only two of the 17 samples exhibited losses at both 350 nm and 700 nm. Mean absolute absorbance changes at 270 nm were 0.07±0.03 and 0.065±0.006, for sample sets 1and 2, respectively. For both sample sets, absorbance values at 270 nm after cold storage were statistically significantly (P≤0.05) different from the original absorbance values before cold storage. Mean
absolute absorbance changes at 350 nm were notably greater in sample set 1 (0.06±0.02) compared with sample set 2 (0.024±0.004). However, absorbances at 350 nm before and after cold storage, for both sample sets, did not differ significantly (P>0.05). Changes in absolute absorbance at 700 nm were 0.02±0.01 and 0.009±0.002 for sample sets 1 and 2, respectively, resulting in significant differences (P≤0.01) between the absorbance values recorded at 700 nm before and after cold storage, for both sample sets.
DOC changes
The overall average absolute % difference in DOC concentration before and after cold storage was 9.6 % (2.5±0.5 mg L-1). In sample set 1 the average
normalised difference in DOC concentration was 2±1 mg L-1 (i.e. 8 %) and in sample set 2 it was
2.7±0.4 mg L-1 (i.e. 11 %) (Figure 4). Percentage
changes in DOC concentrations were significantly greater in sample set 2 compared with sample set 1 (P≤0.05) (Figure 4).
Experiment 2. Effect of freezing and thawing on DOC quality
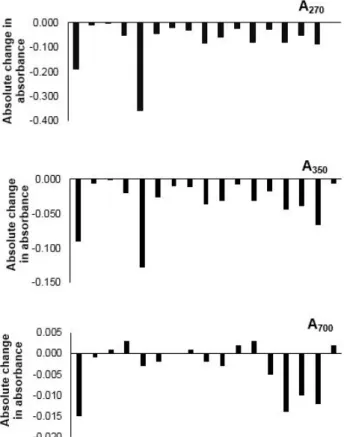
Following freeze/thaw, absorbance losses were observed for all samples at both 270 and 350 nm (Figure 5). At 700 nm, there was a reduction in absorbance in ten samples and an increase in absorbance in six samples with no change in one sample (Figure 5). The average changes in absolute absorbanceat 270, 350 and 700 nm, before and after freeze/thaw, were 0.07±0.02, 0.034±0.008 and 0.003±0.001, respectively. Absorbance values after freeze/thaw in comparison to the original
Figure 2. Relationship between SUVA254 of the refrigerated samples and DOC concentration differences
Figure 3. Experiment 2: changes in absorbance at 270 nm (A270), 350 nm (A350) and 700 nm (A700) of samples
during approximately 12 weeks of cold storage (4 °C) Positive values are increases. There are two sets of 17 samples. Set 1 was collected on 03 August 2015, and set 2 on 05 October 2015.
Figure 4. Average normalised % differences in DOC observed, for the same sample, before and after approximately 12 weeks of cold storage (4 °C), for both sample sets in Experiment 2. DOC concentrations were calculated using the two-wavelength approach (Carter et al. 2012). Error bars show the standard error of the mean. The significance of differences is also shown (unpaired two-tailed t-tests, n=17).
absorbances were significantly different (P≤0.0001) at wavelengths of 270 nm and 350 nm, but not at 700 nm (P>0.05).
Average calculated DOC concentrations, using the two-wavelength approach, before and after freeze/thaw are shown in Figure 6. The freeze/thaw process resulted in a small loss in overall calculated DOC concentrations, which was not significant compared to the original DOC concentrations recorded in August 2015. Absolute changes in DOC concentrations after the freeze/thaw process ranged from 0.12 to 18.5 mg L-1 across the sample set, with
an average change of 3±1.1 mg L-1. This represents
Figure 5. Experiment 2: changes in absolute absorbance values at 270 nm (A270), 350 nm (A350)
and 700 nm (A700), following freeze/thaw. Positive
values are increases. There is one set of 17 samples.
Figure 6. Comparison of DOC concentrations before and after freeze/thaw, in Experiment 2. DOC concentrations were calculated using the two-wavelength approach (Carter et al. 2012). Error bars show the standard error of the mean (n=17).
DISCUSSION
In Experiment 1, loss rates of DOC in samples kept at an ambient temperature of 33°C were high (6.1 % over six weeks) relative to those stored at 4 °C, suggesting that tropical DOC concentrations could experience decreases of about 1 % per week. This is not surprising considering the temperature that these samples were exposed to during storage, which will have enhanced microbial activity and associated degradation of DOC (Kalbitz et al. 2000), and even non-biological chemistry. These differences in DOC concentrations are also reflected in the significant differences (P≤0.001) in absorbance at 254 nm observedbetweenthetwostoragemethods(Figure1).
Greater sample SUVA254 values indicate the
presence of humic and fulvic acids, including phenolic compounds, which remain biologically intact in the environment for long periods of time (Clark et al. 2010, Benner & Kaiser 2011). A significant negative relationship was observed between SUVA254 and the difference in DOC
between the two storage methods (Figure 2). High SUVA254 values are indicative of recalcitrant DOC
compounds, thus this observation suggests that even with prolonged exposure to high temperatures, more of the aromatic DOC remains relatively resistant to degradation (Weishaar et al. 2003). But the small range in SUVA254 values presented in Figure 2 limits
the support for SUVA254 as a proxy for DOC
bioavailability.
In terms of cold storage effects on DOC quality (Experiment 2), changes in absorbance occurred across the DOC spectra (270 nm, 350 nm and 700 nm) for both sample sets. These observed changes, before and after cold storage, were significant at wavelengths of 270 nm and 700 nm. Interestingly, in sample set 2 the majority of the samples showed increased absorbance at all wavelengths. This could be a reflection of DOC flocculation with storage time resulting in a shift in the absorbance properties of the samples. However, absorbance corrections at 700 nm were made when calculating all DOC concentrations in order to adjust for turbidity and, thus, sample flocculation, as suggested by Carter et al. (2012). Consequently, it is more likely that the differences in absorbance responses between the two sample sets is a reflection of the different months in which the two samples sets were collected (August versus October) and thus reflect differences in both water chemistry and perhaps DOC composition.
stored for approximately 12 weeks at 4 °C. This suggests that if water samples are collected, filtered immediately and refrigerated, then DOC losses in water samples from tropical peatlands may be acceptable. From a fieldwork perspective the practical implications of this finding are significant: samples can be stored and shipped back (at a temperature below 20 °C) for analysis when convenient, avoiding the complex logistical issues associated with immediate analysis in remote locations.
The average variance in DOC loss over the 12 weeks in cold storage was 9.5 mg L-1; however, this
was skewed by one data point indicating a large change in DOC concentration during cold storage (50 %). Removal of this single outlier results in an average difference of 2 mg L-1, suggesting that losses
of DOC during cold storage are low and somewhat predictable.
The data from the freeze/thaw experiment demonstrate that, whilst overall changes in DOC concentrations before and after freeze/thaw were small (losses of 10.9 % compared to 9.6 % under cold storage; Experiment 2), significant changes in the absorbance spectra at 270 nm and 350 nm were observed even after only 48 hours of frozen storage. This suggests that although changes in total DOC concentration may be minor, changes in the quality of the DOC may be occurring. This may be a consequence of the stability of the different fractions that comprise the DOC molecule changing during the freeze/thaw process (Spencer et al.2007). In addition, as samples were not re-filtered after freezing, it is possible that this process caused aggregation, leaving suspended particles of DOC, further contributing to the modifications observed in the optical properties of the DOC. Taken together these observations suggest that freezing may be a suitable preservation method if bulk DOC measurements (only) are of interest, but unsuitable if DOC quality is the main focus, directly supporting findings by Peacock et al. (2015). To confirm this observation, further experimentation into the effects of freezing the samples would need to be undertaken.
ACKNOWLEDGEMENTS
For support we thank the Malaysian Oil Palm Board (grant: R010913000); the Universities of Aberdeen and St. Andrews, and Sarawak Oil Palms Berhad; and the Natural Environment Research Council (NERC) (grant: X402NE53). VG and SC are grateful to the AXA Research Fund for support. Furthermore, SEP and MW thank the University of Leicester for study leave. We thank Dicky Clymo as editor, and one anonymous reviewer, for their useful comments.
REFERENCES
Benner, R. (2004) What happens to terrestrial organic matter in the ocean? Marine Chemistry, 92, 307– 310.
Benner, R. & Kaiser, K. (2011) Biological and photochemical transformations of amino acids and lignin phenols in riverine dissolved organic matter. Biogeochemistry, 102, 209–222.
Carter, H.T., Tipping, E., Koprivnjak, J-F., Miller, M.P., Cookson, B. & Hamilton-Taylor, J. (2012) Freshwater DOM quantity and quality from a two-component model of UV absorbance. Water Research, 46, 4532–4542.
Cauwet, G. (2002) DOM in the coastal zone. In: Hansell, D.A & Carlson, C.A (eds.)
Biogeochemistry of Marine Dissolved Organic Matter. Academic Press, San Diego, 579–609. Clark, J.M., Bottrell, S.H., Evans, C.D., Monteith,
D.T., Bartlett, R., Rose, R., Newton, J.R. & Chapman, P.J. (2010) The importance of the relationship between scale and process in understanding long-term DOC dynamics. Science of the Total Environment,408, 2768–2775. Cole, J.J., Prairie, Y.T., Caraco, N.F., McDowell,
W.H., Tranvik, L.J., Striegl, R.G., Duarte, C.M., Kortelainen, P., Downing, J.A., Middelburg, J.J. & Melack, J. (2007) Plumbing the global carbon cycle: integrating inland waters into the terrestrial carbon budget. Ecosystems, 10, 172–185.
Ekström, S.M., Kritzberg, E.S., Kleja, D.B., Larsson, N., Nilsson, P.A., Graneli, W. & Bergkvist, B. (2011) Effect of acid deposition on quantity and quality of dissolved organic matter in soil-water.
Environmental Science and Technology, 45, 4733–4739.
Evans, C.D., Jones, T.G., Burden, A., Ostle, N., Piotr, Z., Cooper, M.D.A., Peacock, M., Clark, J.M., Oulehle, F., Cooper, D. & Freeman, C. (2012) Acidity controls on dissolved organic carbon mobility in organic soils. Global Change Biology, 18, 3317–3331.
Evans, C.D., Page, S.E., Jones, T., Moore, S., Gauci, V., Laiho, R., Hruška, J., Allott, T.H.E., Billett, M.F., Tipping, E., Freeman, C. & Garnett, M.H. (2014) Contrasting vulnerability of drained tropical and high-latitude peatlands to fluvial loss of stored carbon. Biogeochemical Cycles, 28, 1215–1234.
Evans, C.D., Renou-Wilson, F. & Strack, M. (2015) The role of waterborne carbon in the greenhouse gas balance of drained and re-wetted peatlands.
Aquatic Sciences, 78, 573–590.
surface water samples. Science of the Total
Environment, 392, 305–312.
Freeman, C., Fenner, N., Ostle, N.J., Kang, H., Dowrick, D.J., Reynolds, B., Lock, M.A., Sleep, D., Hughes, S. & Hudson, J. (2004) Export of dissolved organic carbon from peatlands under elevated carbon dioxide levels. Nature, 430, 195– 198.
Kalbitz, K., Solinger, S., Park, J.H., Michalzik, B. & Matzner, E. (2000) Controls on the dynamics of dissolved organic matter in soils: A review. Soil Science, 165, 277–304.
Karanfil, T., Schlautman, M.A. & Erdogan, I. (2002) Survey of DOC and UV measurement practices with implications for SUVA determination.
Journal of American Water Works Association, 94, 68–80.
Melling, L., Hatano, R. & Goh, K.J. (2005) Soil CO2
flux from three ecosystems in tropical peatland of Sarawak, Malaysia. Tellus, 75, 1–11.
Moore, S., Evans, C.D., Page, S.E., Garnett, M.H., Jones, T.H., Freeman, C., Hooijer, A., Wiltshire, A., Limin, S. & Gauci, V. (2013) Deep instability ofdeforestedtropicalpeatlandsrevealedbyfluvial organic carbon fluxes. Nature, 493, 660–664. Moore, S., Gauci, V., Evans., C.D. & Page, S.E.
(2011) Fluvial organic carbon losses from a Bornean blackwater river. Biogeosciences, 8, 901–909.
Muller, D., Warneke, T., Rixen, T., Muler, M., Mujahids, A., Banges, H.W. & Notholt, J. (2015) Fateofpeat-derivedcarbonandassociatedCO2and
COemissionsfromtwoSoutheastAsianestuaries.
Biogeosciences Discussion, 12, 8299–8340. Page, S.E., Rieley, J.O. & Banks, C.J. (2011) Global
and regional importance of the tropical peatland carbonpool.GlobalChangeBiology,17,798–818. Park, S., Joe, K.S., Han, S.H. & Kim, H.S. (1999) Characteristics of dissolved organic carbon in the leachate from Moonam Sanitary Landfill.
Environmental Technology, 20, 419–424.
Peacock, M., Evans, C.D., Fenner, N., Freeman, C., Gough, R., Jones, T.G. & Lebron, I. (2014) UV-visible absorbance spectroscopy as a proxy for peatlanddissolvedorganiccarbon(DOC)quantity and quality: considerations on wavelength and absorbance degradation. Environmental Science: Processes and Impacts, 16, 1445–1461.
Peacock, M., Freeman, C., Gauci, V., Lebron, I. & Evans, C.D. (2015) Investigations of freezing and cold storage for the analysis of peatland dissolved
organic carbon (DOC) and absorbance properties.
Environmental Science: Processes and Impacts, 17, 1290–1301.
Peuravuori, J. & Pihlaja, K. (1997) Molecular size distribution and spectroscopic properties of aquatic humic substances. Analytica Chimica Acta, 337, 133–149.
Sharp, J.H. (1993) The dissolved organic carbon controversy: an update. Oceanography, 6, 45–50. Sharp, J.H., Peltzer, E.T., Alperin, M.J., Cauwet, G., Farrington, J.W., Fry, B., Karl, D.M., Martin, J.H., Spitzy, A., Tugrul, S. & Carlson, C.A. (1993) Procedures subgroup report. Marine Chemistry, 41, 37–49.
Sjögersten, S., Black, C.R., Evers, S., Hoyos-Santillan, J., Wright, E.L. & Turner, B.L. (2014) Tropical wetlands: a missing link in the global carbon cycle? Global Biogeochemical Cycles, 28 1371–1386.
Spencer, R.G.M., Aiken, G.R., Wickland, K.P., Striegl, R.G. & Hernes, P.J. (2008) Seasonal and spatial variability in dissolved organic matter quantity and composition from the Yukon river basin, Alaska. Global Biogeochemical Cycles, 22, 1–13.
Spencer, R.G.M., Bolton, L. & Baker, A. (2007) Freeze/thaw and pH effects on freshwater dissolved organic matter fluorescence and absorbance properties from a number of UK locations. Water Research, 41, 2941–2950. Thurman, E.M. (1985) Organic Geochemistry of
Natural Waters. Springer, The Netherlands, 103– 110.
Tipping, E., Corbishley, H.T., Koprivnjak, J-F., Lapworth, D.J., Miller, M.P., Vincent, C.D. & Hamilton-Taylor, J. (2009) Quantification of natural DOM from UV absorption at two wave-lengths. Environmental Chemistry, 6, 472–476. Weishaar, J.L., Aiken, G.R., Bergamaschi, B.A.,
Fram, M.S., Fujii, R. & Mopper, K. (2003) Evaluation of specific ultraviolet absorbance as an indicator of the chemical composition and reactivity of dissolved organic carbon.
Environmental Science and Technology, 37, 4702–4708.
Worrall, F., Burt, T.P. & Adamson, J.K. (2006) The rate of and controls upon DOC loss in a peat catchment. Journal of Hydrology, 321, 311–325.
Submitted 25 Jly 2016, final revision 25 Oct 2016 Editor: R.S. Clymo
_______________________________________________________________________________________
Author for correspondence: Sarah Cook, Geography, 1st Floor, Bennett Building, University of Leicester,