BGD
9, 12433–12467, 2012
4 decades of annual N addition on DOM in
a boreal forest soil
M. O. Rappe-George et al.
Title Page
Abstract Introduction
Conclusions References
Tables Figures
◭ ◮
◭ ◮
Back Close
Full Screen / Esc
Printer-friendly Version Interactive Discussion
Discussion
P
a
per
|
Dis
cussion
P
a
per
|
Discussion
P
a
per
|
Discussio
n
P
a
per
|
Biogeosciences Discuss., 9, 12433–12467, 2012 www.biogeosciences-discuss.net/9/12433/2012/ doi:10.5194/bgd-9-12433-2012
© Author(s) 2012. CC Attribution 3.0 License.
Biogeosciences Discussions
This discussion paper is/has been under review for the journal Biogeosciences (BG). Please refer to the corresponding final paper in BG if available.
The impact of four decades of annual
nitrogen addition on dissolved organic
matter in a boreal forest soil
M. O. Rappe-George, A. I. G ¨arden ¨as, and D. B. Kleja
Department of Soil and Environment, Swedish University of Agricultural Sciences, P.O. Box 7014, 750 07 Uppsala, Sweden
Received: 10 May 2012 – Accepted: 29 August 2012 – Published: 13 September 2012
Correspondence to: M. O. Rappe-George ([email protected])
BGD
9, 12433–12467, 2012
4 decades of annual N addition on DOM in
a boreal forest soil
M. O. Rappe-George et al.
Title Page
Abstract Introduction
Conclusions References
Tables Figures
◭ ◮
◭ ◮
Back Close
Full Screen / Esc
Printer-friendly Version Interactive Discussion
Discussion
P
a
per
|
Dis
cussion
P
a
per
|
Discussion
P
a
per
|
Discussio
n
P
a
per
|
Abstract
Addition of mineral nitrogen (N) can alter the concentration and quality of dissolved organic matter (DOM) in forest soils. The aim of this study was to assess the effect of long-term mineral N addition on soil solution concentration of dissolved organic car-bon (DOC) and dissolved organic nitrogen (DON) in the Str ˚asan experimental forest
5
(Norway spruce) in Central Sweden. N was added yearly at two levels of intensity and duration: the N1 treatment represented a lower intensity, but a longer duration (43 yr) of N addition than the shorter N2 treatment (24 yr). N additions were terminated in the N2 treatment in 1991. The N treatments began in 1967 when the spruce stands were 9 yr old. Soil solution in the forest floor O, and soil mineral B, horizons were sampled
10
during the growing seasons of 1995 and 2009. Tension and non-tension lysimeters were installed in the O horizon (n=6) and tension lysimeters were installed in the un-derlying B horizon (n=4): soil solution was sampled at two-week intervals. Although tree growth and O horizon carbon (C) and N stock increased in treatments N1 and N2, the concentration of DOC in O horizon leachates was similar in both N treatments and
15
control. This suggests an inhibitory direct effect of N addition on O horizon DOC. El-evated DON and nitrate in O horizon leachates in the ongoing N1 treatment indicated a move towards N saturation. In B-horizon leachates, the N1 treatment approximately doubled leachate concentration of DOC and DON. DON returned to control levels but DOC remained elevated in B-horizon leachates in N2 plots 19 yr after termination of N
20
addition. Increased aromaticity of the sampled DOM in mineral B horizon in both the ongoing and terminated N treatment indicated that old SOM in the mineral soil was a source of the increased DOC.
1 Introduction
Soil carbon (C) in boreal forests is an important carbon pool globally (Schlesinger,
25
BGD
9, 12433–12467, 2012
4 decades of annual N addition on DOM in
a boreal forest soil
M. O. Rappe-George et al.
Title Page
Abstract Introduction
Conclusions References
Tables Figures
◭ ◮
◭ ◮
Back Close
Full Screen / Esc
Printer-friendly Version Interactive Discussion
Discussion
P
a
per
|
Dis
cussion
P
a
per
|
Discussion
P
a
per
|
Discussio
n
P
a
per
|
et al., 2003). Zech and Guggenberger (1996) estimated the proportion of dissolved or-ganic carbon (DOC) on the total C input into the mineral soil in an acid forest soil in the Fichtelgebirge, Germany, to be as high as 75 %. In a more recent study of C fluxes in Swedish boreal forests this estimate was lower, ranging from 26 % in the south to 10– 15 % in the north (Kleja et al., 2008). Moreover, structural similarities between dissolved
5
organic matter (DOM) and solid-phase organic matter from the Spodosol mineral B horizon suggests that DOM is a significant source of C in spodic B horizons (Guggen-berger et al., 1994). Once retained in the B horizon, adsorbed/precipitated DOM slowly mineralizes, probably due to its inherent recalcitrant nature and stabilization through the binding to Al and Fe(III) (Boudot et al., 1989; Kaiser and Guggenberger, 2000).
10
Therefore, mobilization and transport of DOM in spodic soils are important processes in the C balance of boreal forests. Dissolved organic matter is an important component in the biogeochemical cycles of elements like nitrogen (N) and phosphorous and can act as a vector for both naturally occurring and pollutant metals (Tyler, 1981).
In many areas in Europe the deposition of nitrogen (N) is high and will probably
15
remain so in the foreseeable future (Galloway et al., 2004). Measured N in through-fall indicates unchanged or even slight increases in throughthrough-fall inorganic N concen-tration in the Swedish throughfall monitoring network nationwide during 1996–2008 (Pihl-Karlsson et al., 2011). Prolonged, high N inputs will decrease the decomposi-tion rate of old soil organic matter (SOM) in temperate forest ecosystems (Berg and
20
Matzner, 1997) and litter decomposition is negatively correlated to N enrichment, in particular for low quality substrates (Knorr et al., 2005). Also, there are reports of de-creasing C mineralization rates from O horizon material following application of NH+4 salts in laboratory studies (Sj ¨oberg et al., 2003). Incomplete decomposition of lignin type SOM induced by high availability of N may be linked to an increase in availability of
25
BGD
9, 12433–12467, 2012
4 decades of annual N addition on DOM in
a boreal forest soil
M. O. Rappe-George et al.
Title Page
Abstract Introduction
Conclusions References
Tables Figures
◭ ◮
◭ ◮
Back Close
Full Screen / Esc
Printer-friendly Version Interactive Discussion
Discussion
P
a
per
|
Dis
cussion
P
a
per
|
Discussion
P
a
per
|
Discussio
n
P
a
per
|
through applying sodium nitrate at 30 kg N ha−1yr−1to a North American deciduous for-est stand, water extractable DOC increased and the oxidative enzyme activity in soil was reduced (Sinsabaugh et al., 2004).
However, there is little information on how an elevated supply of N affects long-term leaching of DOM at stand level. In the Harvard Forest experiment in
North-5
Eastern America, Currie et al. (1996) did not find a significant increase in the con-centration of DOC in the forest floor after 7 yr of NH4NO3 application. Conversely, in mature sugar maple dominated stands, the leaching of DOC through mineral soil in-creased (more than three times than the control) and leaching of dissolved organic nitrogen (DON) increased (more than six times than the control) after the addition
10
of 30 kg NO3−N ha−1yr−1 for 8 yr (Pregitzer et al., 2004). In the study by Pregitzer
et al. (2004), the effect of elevated N deposition on leaching of DOC and DON in min-eral B horizon was tested experimentally across a gradient of N availability, temperature and N deposition.
In N addition experiments, the contrasting effects of treatment on DOC might be
ex-15
plained by changes in soil acidity (Evans et al., 2008) because dissociation of functional groups can increase DOC solubility and presence of polyvalent cations limit it. In exper-iments where N addition probably acidified the soil (e.g. N added as. NH4SO4), DOC in soil solution should by this mechanism decrease, whereas, if N addition decreased acidity (e.g. N added as NaNO3), DOC in soil solution should increase.
20
The leaching of DOC positively correlates with litterfall production in five coniferous forests across Europe (Gundersen et al., 1998). In a laboratory experiment the amount of substrate C increased the amount of extractable DOC (Park et al., 2002). However, the extent to which soil carbon and nitrogen stocks influence the concentration of DOC or DON is unclear (Kalbitz et al., 2000). As long term N addition might influence net
pri-25
BGD
9, 12433–12467, 2012
4 decades of annual N addition on DOM in
a boreal forest soil
M. O. Rappe-George et al.
Title Page
Abstract Introduction
Conclusions References
Tables Figures
◭ ◮
◭ ◮
Back Close
Full Screen / Esc
Printer-friendly Version Interactive Discussion
Discussion
P
a
per
|
Dis
cussion
P
a
per
|
Discussion
P
a
per
|
Discussio
n
P
a
per
|
ammoniumnitrate, NH4NO3, since 1967. The aim was to contrast the effect of long-term (>40 yr), intermediate intensity N addition (37 kg N ha−1yr−1) to shorter duration (24 yr), high intensity N addition (73 kg N ha−1yr−1) on soil solution concentration of DOC and DON in O and B horizon soil solution. The properties of the DOM, as de-termined by fractionation based on hydrophobicity and acidity (Leenheer, 1981) and
5
UV absorbance at 254 and 280 nm, were studied. The hypothesis was that N addition increased the formation of partially decomposed lignin degradation products found in O horizon, resulting in increased DOC concentrations in O and B horizon leachates. This increase in DOC should be linked with higher abundance of aromatic moieties of the DOM, indicated by increased specific UV absorption (at 254 and 280 nm) and an
10
increased hydrophobicity of the DOM.
2 Materials and methods
2.1 Site description
The field site E26A Str ˚asan (Tamm et al., 1974) is an experimental spruce forest lo-cated 350 m a.s.l. in Central Sweden (60◦55′N, 16◦01′E). The soil type is classified
15
as a haplic podzol (Berggren et al., 1997). Parent material consists of glacial till, with medium and fine sand as dominating fractions and a normal to high frequency of stones. Roots are present down into the mineral B horizon. Average horizon depths were 10 cm (O horizon), 6 cm (E horizon) and 14 cm (B1 horizon) in 2011.
The experiment was designed as a randomized block experiment with two blocks.
20
Plots were 30 m×30 m, with measuring plots of 25 m×25 m. Measurements were taken
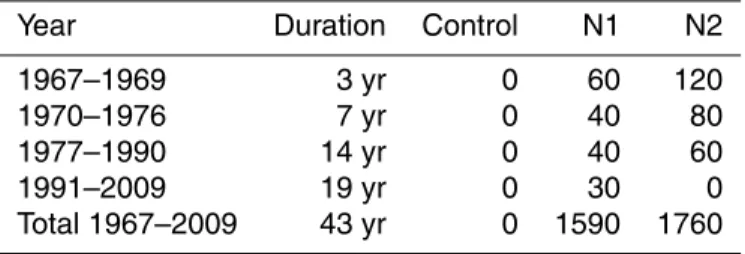
in the control and N fertilized plots to which ammonium nitrate, NH4NO3, had been added at average rates of 35 (N1) and 73 (N2) kg ha−1yr−1 (Table 1). The N addition in the N1 treatment was of lower intensity, but longer duration (43 yr), than the N2 treatment, which was of higher intensity and shorter duration (24 yr). Although the N
25
BGD
9, 12433–12467, 2012
4 decades of annual N addition on DOM in
a boreal forest soil
M. O. Rappe-George et al.
Title Page
Abstract Introduction
Conclusions References
Tables Figures
◭ ◮
◭ ◮
Back Close
Full Screen / Esc
Printer-friendly Version Interactive Discussion
Discussion
P
a
per
|
Dis
cussion
P
a
per
|
Discussion
P
a
per
|
Discussio
n
P
a
per
|
cumulative amount of N than the on-going N1 treatment by 2009. The NH4NO3 salt was spread manually in May once a year. In 2009, manual application of ammonium nitrate was on 12 May but for 1995, no application date was recorded.
Until the middle of the 1950s, the experimental area was covered with old Norway spruce-dominated (Picea abies (L.) Karst.) forest. Trees were felled in 1956 and the
5
site was subjected to burning in the early summer of 1957. Norway spruce seedlings were planted in the spring of 1958.
At a nearby meteorological station of the Swedish Hydrological and Meteorolog-ical Institute (60◦57′N, 16◦26′E), the mean annual precipitation and temperature were 584 mm yr−1 and 4.3◦C for the period 1995 to 2009. The effective temperature
10
sum (accumulated daily mean temperatures in excess of 5◦C) was 1163◦C days in 1995 and 1209◦C days in 2009. The annual precipitation was 729 mm in 1995 and 733 mm in 2009 (data from SMHI, Swedish Hydrological and Meteorological Institute, http://www.smhi.se). Based on data for the period 1961 to 1990, snowmelt was usually complete by mid April. The wet deposition of inorganic N at Str ˚asan was approximately
15
5.1 kg N ha−1yr−1in 1995/96 and 3.2 kg N ha−1yr−1in 2009/10 (data from IVL, Swedish Environmental Institute, http://www.ivl.se).
2.2 Installation of lysimeters and sampling of soil solution
Zero-tension lysimeters (ZTL) were installed below the O horizon at 6 locations per plot to sample the water moving freely under the act of gravity. The ZTL (Bio-Konsult,
20
Skan ¨or, Sweden) consisted of a Plexiglas trough (30 cm×30 cm) with two layers of
polyethylene nets (mesh sizes 2 mm and 0.5 mm) on top. The lysimeters were con-nected by silicone tubing to a borosilicate glass bottle. In addition, Rhizon-type lysime-ters (R) were installed at the bottom of the O horizon, six in each plot, to sample the meso- and micropore soil water through tension: the Rhizon-type lysimeters were only
25
sampled during 1995.
In the lower B horizon (∼50 cm depth), tension lysimeters (TL) were installed at
BGD
9, 12433–12467, 2012
4 decades of annual N addition on DOM in
a boreal forest soil
M. O. Rappe-George et al.
Title Page
Abstract Introduction
Conclusions References
Tables Figures
◭ ◮
◭ ◮
Back Close
Full Screen / Esc
Printer-friendly Version Interactive Discussion
Discussion
P
a
per
|
Dis
cussion
P
a
per
|
Discussion
P
a
per
|
Discussio
n
P
a
per
|
lysimeters (Prenart Equipment Aps, Frederiksberg, Denmark) with a pore size of 4 µm: poly(tetrafluoroethene) cups are chemically inert with respect to DOC (Beier and Hansen, 1992). Solutions were collected in borosilicate glass bottles. Both the TL cups and Rhizon lysimeters were operated at transient vacuum with an initial tension of
−70 kPa. 5
All lysimeters were installed in the outer part of the projection of tree crowns to ob-tain a similar influence of throughfall on the lysimeter solutions. Collecting bottles were placed below ground in PVC tubes (50 cm) vertically installed in the soil. A lid consist-ing of styrofoam ensured that solutions were kept cool and dark durconsist-ing the samplconsist-ing periods. The TL were installed in June 1994 and the ZTL in September/October 1994.
10
The soil solution was sampled during 2 yr: 20 June 1995 to 21 November 1995 and 8 June 2009 to 12 November 2009. For both years, the sampling interval was two weeks. The soil solution was sampled twelve times per year. Two sets of bottles were used for the solutions collected by ZTL; these were used alternatively to enable bottles to be cleaned in the laboratory (rinsing with de-ionized water and burning at 200–250◦C)
15
before each sampling period. The bottles for TL lysimeters were rinsed in the field with de-ionized water on each sampling occasion.
During 1995, samples from each lysimeter were analyzed separately, but for sam-ples taken during 2009 so-called “pooled samsam-ples” were analyzed. Pooled samsam-ples were obtained by pouring the samples gathered by all lysimeters from the
experimen-20
tal plot into a large container from which a composite sample was taken and analyzed. Pooling of samples thus renders volume weighted concentrations per plot. If a lysimeter had a larger volume than 1 dm3, only a 1 dm3sample from that specific lysimeter was added to the bulk sample. Samples from 1995 were calculated as volume weighted concentrations by plot and sampling occasion.
25
2.3 Chemical analyses of soil solution
Samples were filtered through a 0.2 µm filter and analyzed for pH, total organic carbon (TOC), NO−
3 (aq.), NH
+
BGD
9, 12433–12467, 2012
4 decades of annual N addition on DOM in
a boreal forest soil
M. O. Rappe-George et al.
Title Page
Abstract Introduction
Conclusions References
Tables Figures
◭ ◮
◭ ◮
Back Close
Full Screen / Esc
Printer-friendly Version Interactive Discussion
Discussion
P
a
per
|
Dis
cussion
P
a
per
|
Discussion
P
a
per
|
Discussio
n
P
a
per
|
SO4) and total nitrogen (TN). The samples were stored at+2◦C until analysis. DON was calculated by subtracting nitrogen content in inorganic nitrogen species (NO3-N and NH4-N) from the TN concentration. In 1995, DOC was fractionated into hydropho-bic acids (HoA) and neutrals (HoN), and into hydrophilic acids (HiA), neutrals (HiN) and bases (HiB) with an adsorption chromatographic technique according to
Leen-5
heer (1981). In 2009, UV absorbance at 254 and 280 nm was measured. Specific UV absorbance, SUVA, was calculated by dividing UV absorbance (m−1) by DOC concen-tration (mg l−1).
An aliquot for TOC analysis was filtered through 0.2 µm filters (Acrodisc PF, Gelman Sciences, MI) and acidified to pH 3 with HCl. In 1995, TOC measurements were made
10
with a Shimadzu TOC-500 analyzer (Shimadzu Corporation, Kyoto, Japan), a Shi-madzu TOC-VCPH analyzer was used in 2009. Analyses were usually performed within 1 week of sampling.
In 1995, TN samples were treated to persulphate oxidation (10 g K2S2O8 in 1 l of 0.15 M NaOH) by mixing of equal volumes and boiling under pressure (14 kPa) for
15
25 min. Before analysis of NO−
3 by Flow Injected Analysis (FIA), 0.25 ml of 1.44 M H2SO4 was added. Determination of TN was performed with a Shimadzu TNM-1 TN analyzer (Shimadzu Corporation, Kyoto, Japan) in 2009.
Anions (Br, Cl, PO4, SO4, and NO−
3) were analyzed by ion chromatography using a Dionex 2000i/SP column in 1995 and a Metrosep A Supp 5 column in 2009. NH+4
20
was analyzed by a FIAStar 5000 analyzator (FOSS, Hilleroed, Denmark) in 2009. The limit of detection (LOD) for NO−3 and NH+4 were 0.01 mg l−1. Values below detection limit were set to half LOD.
Metals (Al, Fe, Mn, Ca, K, Mg, and Na) were analyzed by a mass spectrometer ELAN 6000 analyzer and an OPTIMA 3000 DV torch (Perkin Elmer, Waltham, USA).
25
BGD
9, 12433–12467, 2012
4 decades of annual N addition on DOM in
a boreal forest soil
M. O. Rappe-George et al.
Title Page
Abstract Introduction
Conclusions References
Tables Figures
◭ ◮
◭ ◮
Back Close
Full Screen / Esc
Printer-friendly Version Interactive Discussion
Discussion
P
a
per
|
Dis
cussion
P
a
per
|
Discussion
P
a
per
|
Discussio
n
P
a
per
|
As a measure of the potentially induced acidity of the experimental N additions, ANC forcing (Evans et al., 2008) was calculated according to Eq. (1):
ANCforcing= ∆NH+4−∆NO−3 (1)
where ∆NH+4 is the difference between treatment and control in mean annual soil solution concentration (µeq l−1) of NH+
4 and∆NO−3 is the difference between treatment
5
and control in mean annual soil solution concentration (µeq l−1) of NO−3.
2.4 Sampling and analyses of soils
Samples from the Oi and Oe+ahorizon were taken in august 2010 with stainless steel cylinders (Ø 49 mm). Six composite samples, each consisting of 25 subsamples, were taken from a grid in the measuring plots (25 m×25 m). Samples were weighed and 10
then passed through a 4 mm sieve to remove coarse fragments and to homogenize the samples. Dry weights were determined after drying at least 24 h at 105◦C. The C and N contents were determined from ground samples with a LECO elemental CNS-2000 analyzer (LECO Instruments, St. Joseph, USA).
For estimating the C and N stock in Oe+ahorizon, the volume occupied by stones and
15
boulders was corrected with the rod penetration method of Viro (1952). The percentage of stones and boulders in the Oe+ahorizon was assumed equivalent to the percentage of penetrations that hit a stone on the surface or within the Oe+a horizon at a depth of less than half the mean depth of the Oe+a horizon. Data on C and N stock estimates made in 1996 were obtained from Andersson et al. (2002).
20
2.5 Estimates of standing stem volume
Trees were calipered in the experimental plots in both 1997 and 2010. The measure-ments were made in inner plots measuring 20 m×20 m centered in the net plots which
BGD
9, 12433–12467, 2012
4 decades of annual N addition on DOM in
a boreal forest soil
M. O. Rappe-George et al.
Title Page
Abstract Introduction
Conclusions References
Tables Figures
◭ ◮
◭ ◮
Back Close
Full Screen / Esc
Printer-friendly Version Interactive Discussion
Discussion
P
a
per
|
Dis
cussion
P
a
per
|
Discussion
P
a
per
|
Discussio
n
P
a
per
|
functions for Norway spruce,Picea abies, (Brandel, 1990): standing dead trees were not included in the estimates. Total stemwood production was estimated by including data for thinned volumes, i.e. the volumes of trees cut down and removed for benefit of the remaining stand. Data on diameter at breast height and height in 1997 were ob-tained from a database hosted by the Unit for Field-based Forest Research (Swedish
5
University of Agricultural Sciences).
2.6 Statistical analyses
Treatment effects on the concentrations of DOC, DON, and properties of the DOM were analyzed as a randomized block experiment on time-series soil solution data. Auto-correlation of any lag in time series data was not significant (p >0.05). Moreover, the
10
data indicated strong cross-correlation between time series of the different treatments. For analysis of soil solution data of DOC and DON during the years 1995 and 2009, a multiple linear model was fitted according to:
yi j kl=µ+αi+bj+di j+tk+ml+ei j kl (2)
where
15
yi j kl=dependent variable
µ=overall mean
αi =treatment effect
bj =random block effect
di j=treatment×year effect
20
tk=effect of date of sampling
ml =effect of year
BGD
9, 12433–12467, 2012
4 decades of annual N addition on DOM in
a boreal forest soil
M. O. Rappe-George et al.
Title Page
Abstract Introduction
Conclusions References
Tables Figures
◭ ◮
◭ ◮
Back Close
Full Screen / Esc
Printer-friendly Version Interactive Discussion
Discussion
P
a
per
|
Dis
cussion
P
a
per
|
Discussion
P
a
per
|
Discussio
n
P
a
per
|
Treatment, block, year, and date of sampling were treated as factors. The data were log-transformed prior to model evaluation in order to improve approximation to normal-ity. Data on Leenheer fractionation (analyzed in 1995) and SUVA (analyzed in 2009) were treated in a similar model, but without year as a factor. The linear model was inter-preted by analysis of variance (ANOVA). If significant treatment effects were indicated,
5
analyses were continued with Tukey honest significant difference (HSD) method. The control plots repeatedly displayed soil solution NO−3 and NH+4 below the detection limit; this was the reason these variables were not treated in the time-series analysis. Instead, seasonal means were used. For data on non-time series (NO−
3, NH
+
4, pH, ionic strength, soil C and N, and standing tree volume), a linear model with treatment,
10
block and year as factors was used. The linear model was interpreted by ANOVA. If significant treatment effects were indicated, post-hoc analyses were made with the Tukey HSD method.
3 Results
3.1 Soil C and N
15
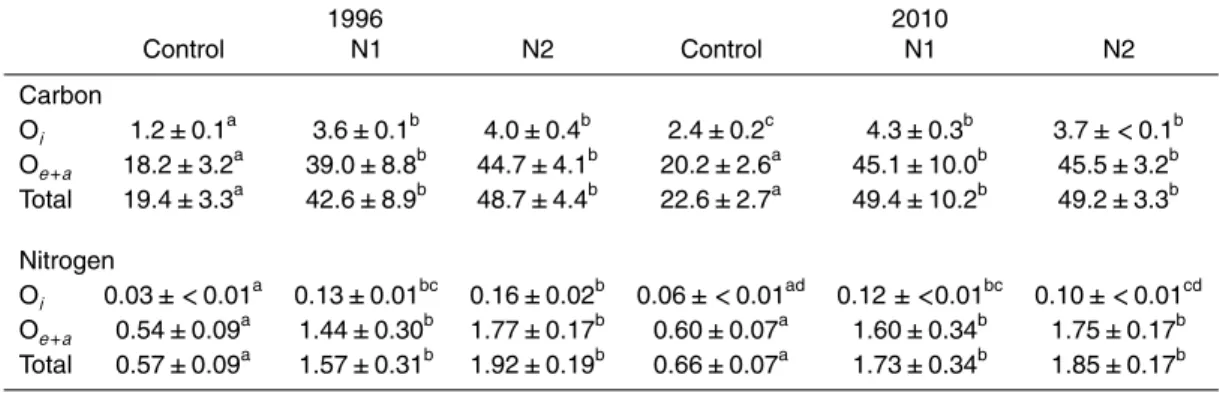
The C and N stocks in the Oi and Oe+ahorizons were larger in the N treated plots than control (Table 2). In 1996, the C stock in Oi+Oe+ain treatment N1 (42.6±8.9 t C ha−1) and N2 (48.7±4.4 t C ha−1) were more than double the C stock found in control
(19.4±3.3 t ha−1). Although N addition was ended in treatment N2 by 1991, the C
stock was not significantly different from that in the on-going N treatment, N1, in 2010.
20
The largest increase in C stock (relative to control) was in the Oi horizon in 1996 and in the Oe+ahorizon in 2010 for both N treatments. Soil carbon in Oi+e+ahorizon increased by 19.3±4.6 and 16.6±0.6 kg C ha−1yr−1 per added kg N ha−1yr−1 in treatments N1 and N2 in 1996: corresponding figures were 16.5±4.6 and 15.1±0.3 kg C ha−1yr−1
per added kg N ha−1yr−1in 2010.
BGD
9, 12433–12467, 2012
4 decades of annual N addition on DOM in
a boreal forest soil
M. O. Rappe-George et al.
Title Page
Abstract Introduction
Conclusions References
Tables Figures
◭ ◮
◭ ◮
Back Close
Full Screen / Esc
Printer-friendly Version Interactive Discussion
Discussion
P
a
per
|
Dis
cussion
P
a
per
|
Discussion
P
a
per
|
Discussio
n
P
a
per
|
The N stock in Oi+Oe+a in 1996 was, similarly to C stock, more than double the control (0.57±0.09 t N ha−1) in both N treatments (1.57
±0.31 and 1.92±0.19 t N ha−1
in N1 and N2 respectively). The Oe+a horizon C and N stocks presented the largest
relative change in the on-going N1 treatment during the period 1996 to 2010, although the difference between years was not significant (p >0.05).
5
The C/N-ratio in the Oe+a horizon was 33 g g−1 for the control and 28 g g−1for N1
in both 1996 and 2010. The C/N-ratio in Oe+a horizon in the N2 treatment increased slightly, from 25 g g−1in 1996 to 27 g g−1in 2010. The C/N-ratio in the O
e+ahorizon was
lower than control in both N treatments. The C/N-ratio was higher in Oi than in Oe+a
regardless of treatment. The lowest C/N-ratio in Oi horizon was found in the on-going
10
N1 treatment in 1996 (N1: 28 g g−1).
3.2 Tree stand development
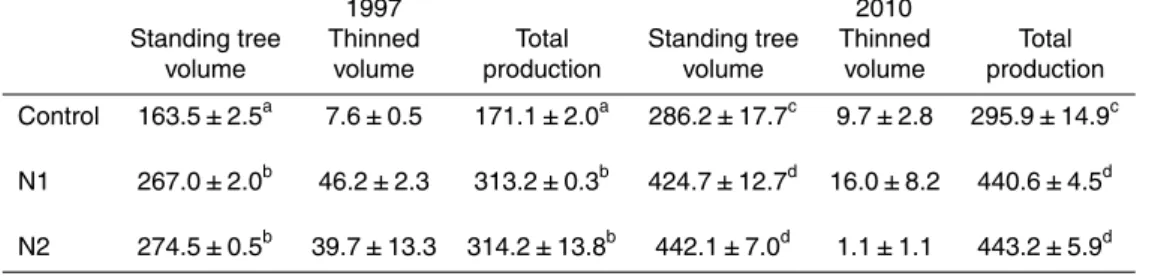
There were large increases in stemwood production in the fertilized plots by 1997 (Table 3). For treatments N1 and N2, stem volume increased by approximately 65 %, compared to control. The difference between the N1 and N2 plots was not significant
15
(p >0.05). In 2010, after an additional 13 yr of N addition in the N1 treatment, the increase in growth was less: 49 % for N1 treatment (corresponding figure for N2 was 55 %). This was partly explained by more thinned volumes in the N1 plots and that the standing tree volume in control plots increased from 163.5 to 286.2 m3on bark ha−1 between 1997 and 2010.
20
BGD
9, 12433–12467, 2012
4 decades of annual N addition on DOM in
a boreal forest soil
M. O. Rappe-George et al.
Title Page
Abstract Introduction
Conclusions References
Tables Figures
◭ ◮
◭ ◮
Back Close
Full Screen / Esc
Printer-friendly Version Interactive Discussion
Discussion
P
a
per
|
Dis
cussion
P
a
per
|
Discussion
P
a
per
|
Discussio
n
P
a
per
|
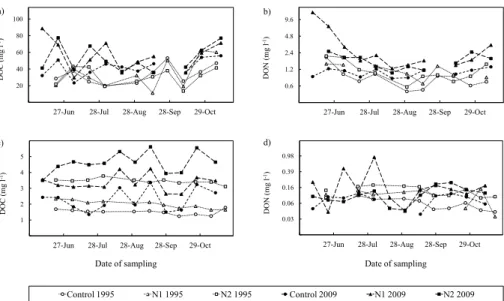
3.3 Soil solution chemistry
3.3.1 Dissolved organic carbon and nitrogen
Soil solution DOC concentrations were highly variable in O horizon leachates through-out the growing season, ranging 10 to 90 mg l−1 (Fig. 1): however, no clear seasonal pattern could be distinguished in either year in data from ZTL-, nor R-, type
lysime-5
ters. The addition of N did not affect DOC in O horizon leachates in ZTL or R-type lysimeters (Table 4). DOC annual mean concentration in both the N1 and N2 plots was slightly higher than in control plots in 2009, but the effect was not significant. Regard-less of treatment, DOC in ZTL lysimeter leachates was higher in 2009 than in 1995 (p <0.05).
10
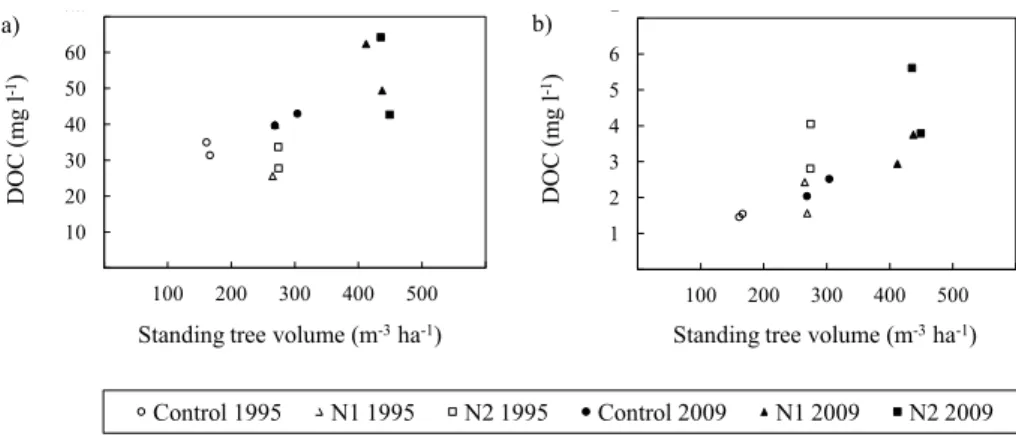
In contrast, there were treatment effects in B horizon leachates for both years: dur-ing both 1995 and 2009, DOC in the low-intensity ongodur-ing N1 treatment was higher than in the control, and the DOC concentrations in the N2 treatment was higher than in N1. In comparison to O horizon leachates, mineral B horizon leachates were less variable. Moreover, DOC concentrations below the B horizon were generally an order
15
of magnitude smaller than below the O-horizon, indicating the large capacity for sorp-tion/precipitation of DOM in the mineral soil. DOC in TL leachates was higher during 2009 than 1995 (p <0.05) in all treatments. The annual means of DOC in both O hori-zon ZTL and B horihori-zon TL leachates were correlated to the standing tree volume of individual plots (Fig. 3).
20
In 1995, DON concentrations in O horizon R-type lysimeter leachates were elevated in the N1 treatment, compared to both the control and N2. By 2009, O horizon ZTL leachate DON was higher in both N1 and N2 than in control plots (p <0.05). Both N1 plots displayed elevated DON concentrations (>6 mg DON l−1) during early summer 2009 and DON in mineral B horizon leachates were elevated approximately one month
25
later.
BGD
9, 12433–12467, 2012
4 decades of annual N addition on DOM in
a boreal forest soil
M. O. Rappe-George et al.
Title Page
Abstract Introduction
Conclusions References
Tables Figures
◭ ◮
◭ ◮
Back Close
Full Screen / Esc
Printer-friendly Version Interactive Discussion
Discussion
P
a
per
|
Dis
cussion
P
a
per
|
Discussion
P
a
per
|
Discussio
n
P
a
per
|
control plots only in 1995. The difference in DON in B horizon leachates between 2009 and 1995 was not significant (p >0.05).
DOC and DON concentrations in O horizon leachates were positively correlated with sampled water volume across sample collection dates (p <0.05 for both) but with low explained variance (DOCR2=0.07 and DONR2=0.01). In B horizon lysimeters,
5
DOC concentrations were positively correlated with sampled water volume (p <0.05;
R2=0.36), but DON concentrations were not (p=0.29). ZTL- and R-type lysimeter leachates did not correlate with respect to either DOC (p=0.19) or DON (p=0.11) on time series data, indicating that the two lysimeter types sampled different kind of soil waters.
10
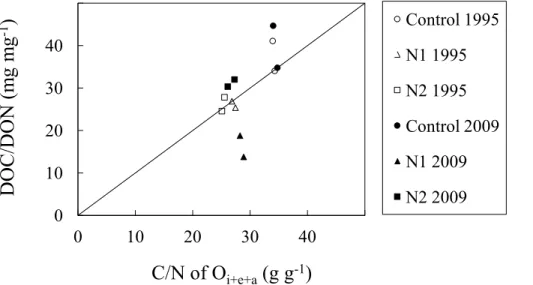
As O horizon leachate DOC concentration was unchanged but DON concentration increased in the N1 treatment, the ratio decreased. In 1995 the DOC/DON-ratio on annual mean concentDOC/DON-rations in O horizon leachates was 70 % of control in both N treatments (Fig. 2). In 2009, the DOC/DON-ratio in the N1 treatment was 41 % of con-trol: corresponding figure for the N2 treatment was 78 %. The annual mean DOC/DON
15
in ZTL leachates did not show a 1 : 1 relationship with C/N in the O horizon (Fig. 2). Especially N1 plots DOC/DON were low in 2009, because DON was elevated. The response of SOM and DOM to long-term N addition thus differed, at least in time lag.
3.3.2 Hydrophobicity, acid-base and UV absorbance of leachate DOM
No effect of treatment on the hydrophobicity or acidity of DOM was observed in O
20
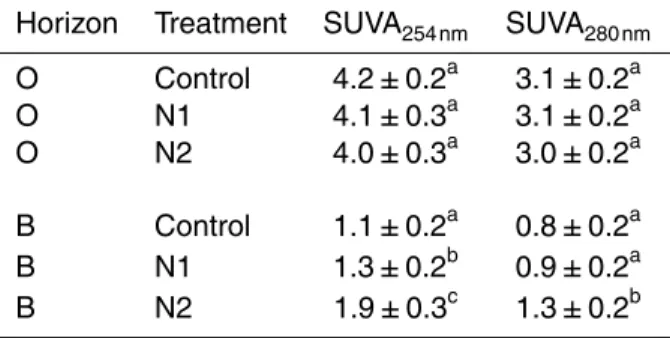
horizon leachates, estimated by Lenheer fractionation (Table 5). Hydrophobic and hy-drophilic acids were the dominating fractions of the DOM (>90 % by mass) in leachates from both R-type lysimeters and ZTL. Thus, neutrals and bases constituted low propor-tions of the DOM (<10 %).
SUVA254 nm and SUVA280 nm did not reveal any treatment effects in O horizon
25
BGD
9, 12433–12467, 2012
4 decades of annual N addition on DOM in
a boreal forest soil
M. O. Rappe-George et al.
Title Page
Abstract Introduction
Conclusions References
Tables Figures
◭ ◮
◭ ◮
Back Close
Full Screen / Esc
Printer-friendly Version Interactive Discussion
Discussion
P
a
per
|
Dis
cussion
P
a
per
|
Discussion
P
a
per
|
Discussio
n
P
a
per
|
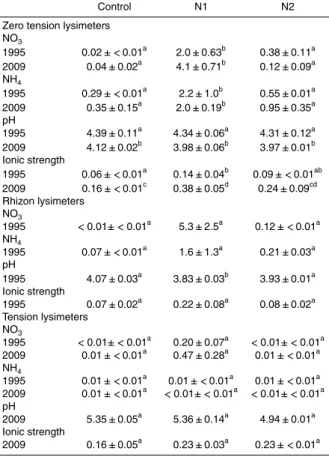
3.3.3 Ionic strength and acidity
Ionic strength in the O-horizon soil solution recovered in ZTL leachates was higher in N1 than in the control in both 1995 and 2009 (Table 7): N2 plots did not display higher ionic strength than control plots in ZTL leachates. In mineral B horizon, the ionic strength of sampled soil solution was not higher than the control in both the N1 and N2
5
plots (p >0.05).
The concentration of NO−
3 and NH+4 recovered in ZTL leachates was higher in the N1 plots than control and N2 in 1995 and 2009 (Table 7). This resulted in ANC forcing in the range−250–50 µeq l−1in O horizon and−54–3 µeq l−1in B horizon leachates for
N1 and N2. However, ANC forcing showed no linear correlation with relative change of
10
DOC (%) in N treated plots in O or B horizon leachates (p=0.24 andp=0.35 respec-tively). Significant treatment effects on pH were only present in R lysimeter leachates (lower pH in N1 plots). Accordingly, there was no support for acidity as a driver of DOC at Str ˚asan (Fig. 4).
4 Discussion
15
To the contrary of our initial hypothesis, the concentration and the quality of DOC sam-pled in O horizon leachates did not change in response to long-term addition of min-eral N at the Str ˚asan experimental forest. This finding was in accordance with some lysimeter studies (Currie et al., 1996; Raastad and Mulder, 1999) but stood in con-trast to others (Guggenberger, 1994; Pregitzer et al., 2004). The variability in response
20
of DOC to N addition has not been uniformly explained. Acid/base effect of N fertil-izer (Evans et al., 2008) and ecosystem-specific response of the microbial community (Waldrop and Zak, 2006) have been proposed to explain between-site differences of DOC response to N addition.
Fr ¨oberg et al. (2006) identified a positive correlation between O horizon leachate
25
BGD
9, 12433–12467, 2012
4 decades of annual N addition on DOM in
a boreal forest soil
M. O. Rappe-George et al.
Title Page
Abstract Introduction
Conclusions References
Tables Figures
◭ ◮
◭ ◮
Back Close
Full Screen / Esc
Printer-friendly Version Interactive Discussion
Discussion
P
a
per
|
Dis
cussion
P
a
per
|
Discussion
P
a
per
|
Discussio
n
P
a
per
|
climate and primary productivity in Sweden. We observed a similar relationship in our study (Fig. 3), although we are aware of temporal pseudoreplication. The standing tree volume is a major determinant of litterfall production in Norway spruce forests stands (Saarsalmi et al., 2007) and litter is a significant source of DOC in O horizon soil so-lution (Fr ¨oberg et al., 2005). An indirect positive effect of N addition on DOC in O
5
horizon, through the production and subsequent decomposition of aboveground litter, thus seemed likely. The fact that year was a significant factor in our ANOVA (p <0.05) complimented this observation (Table 4), as well as the fact that amount of precipita-tion and the effective temperature sums at a nearby weather station were similar in 1995 and 2009 (see Sect. 2.1). As we did not observe treatment effects on DOC in O
10
horizon leachates the direct effect of N addition on DOC in O horizon at Str ˚asan was inhibitory per unit substrate C (soil C and litterfall production). This was corroborated by the fact that standing tree volumes and Oi and Oe+ahorizon C stocks increased in N1 and N2, but O horizon DOC was similar in control and N amended plots in both 1995 and 2009. The same effect was found for ZTL and R lysimeters although they
15
sampled different soil water. Data on soil water content at 0.2 and 0.5 m depth in the control and N1 plots (sampled during April–July, 2012) did not indicate changes to the soil moisture sufficient to cause a concentration effect (M. O. Rappe-George, unpub-lished data). Moreover, there is support that water flux through the soil does not greatly affect DOC concentration, even at high rates (Fr ¨oberg et al., 2006; Kalbitz et al., 2007;
20
Schmidt et al., 2010).
In accordance with our hypothesis regarding DOC concentration in mineral B hori-zon, DOC approximately doubled in both sampling years in response to both N treat-ments, N1 and N2. These findings were in accordance with other reports on the effects of N addition on mineral horizon DOC across a range of ecosystem types
(Guggen-25
BGD
9, 12433–12467, 2012
4 decades of annual N addition on DOM in
a boreal forest soil
M. O. Rappe-George et al.
Title Page
Abstract Introduction
Conclusions References
Tables Figures
◭ ◮
◭ ◮
Back Close
Full Screen / Esc
Printer-friendly Version Interactive Discussion
Discussion
P
a
per
|
Dis
cussion
P
a
per
|
Discussion
P
a
per
|
Discussio
n
P
a
per
|
the N treated plots (Table 7). A decrease in either ANC forcing or ionic strength would have been needed. Ionic strength increased slightly in N1 and N2 plots, but the effect was not significant (p=0.27). The seasonal means of DOC appeared to correlate with the standing tree volume also in B-horizon leachates (Fig. 3). A larger standing tree biomass was likely to have increased root biomass (Cairns et al., 1997) and thus litter
5
input to mineral soil via root litter and/or rhizodeposition. This might be a relatively easily available C source that stimulated decomposition of more recalcitrant SOM found in the mineral soil (Kuzyakov, 2002), resulting in increased DOC. Moreover, the SUVA254 nm increased in mineral B horizon leachates in the fertilized plots, indicating that the DOM contained more aromatic moieties (Dilling and Kaiser, 2002) which are important for
10
long-term sorptive preservation of OM in mineral soil (Kaiser and Guggenberger, 2000). Dissolved organic carbon in boreal forest B horizon is mainly old C, originating from C found in the mineral solid phase (Fr ¨oberg et al., 2006). Taken together, this suggests that a significant source of the increased DOC in N1 and N2 mineral soil leachates was mobilization of old SOM into solution. However, in mineral B horizon leachates,
15
the terminated N treatment, N2, had the highest DOC, not the ongoing N1 treatment, which demonstrated that ongoing N addition did not fuel DOC but that DOC was more related to the accumulated amount of added N. The elevated DOC concentrations in B horizon TL leachates could have consequences for water quality as DOC is known to be a transporter of several metals and radionuclides (Tyler, 1981; Marley et al., 1993).
20
In O horizon, R lysimeter leachate DON was elevated in the N1 plots in 1995. In contrast, elevated DON in the N amended plots was observed in ZTL leachates only in 2009. McDowell et al. (1998) report increased soil water DON flux sampled beneath the forest floor by a factor of two in a N amended Pine forest stand in Massachusetts, US. DON in O horizon soil solution at Str ˚asan increased in response to N addition up
25
BGD
9, 12433–12467, 2012
4 decades of annual N addition on DOM in
a boreal forest soil
M. O. Rappe-George et al.
Title Page
Abstract Introduction
Conclusions References
Tables Figures
◭ ◮
◭ ◮
Back Close
Full Screen / Esc
Printer-friendly Version Interactive Discussion
Discussion
P
a
per
|
Dis
cussion
P
a
per
|
Discussion
P
a
per
|
Discussio
n
P
a
per
|
Seasonality of DON with high concentrations during early summer is reported for a coniferous forest (McDowell et al., 1998) and a grassland altitudinal gradient (Far-rell et al., 2011). Str ˚asan represented a highly N limited ecosystem at the beginning of N treatments in 1967 (Tamm et al., 1974). The internal cycling of N, determined as net-mineralization, at Str ˚asan increased by a factor of ten in N1 plots by 1996 (Andersson
5
et al., 2001) and these conditions appeared to have been exacerbated in the N1 plots by 2010 with NO−3 as a major N species in O horizon leachates (Table 7). This indicates a move towards N saturation in the N1 plots. Although N addition was terminated in the N2 treatment by 1991, DON was not elevated in 1995, but in 2009.
DON in mineral B horizon leachates was elevated in N2 plots in 1995 and in N1 plots
10
in 2009. By 2009, DON in N2 plots in mineral soil leachates was still elevated but did not differ significantly from the control: thus DON in mineral soil leachates appeared to be driven by the continuous supply of mineral N. Both N2 (in 1995) and N1 (in 2009) approximately doubled DON in mineral B horizon. In a study by Pregitzer et al. (2004), DON leaching from mineral soil increased by a factor of six in response to 8 yr of N
15
addition in a North American deciduous forest, although the sites in this study were possibly not N limited (C/N in Oe+a ranging 17–21). Mineral soil DON in the N1 plots were elevated in the middle of summer 2009, approximately one month after DON concentrations peaked in the above-lying O horizon, which suggests that O horizon ZTL is indicative of DON fluxes from O horizon into the mineral soil.
20
The dynamics of C/N stochiometry differed between solid and dissolved organic mat-ter: the DOC/DON in O horizon was more responsive to long-term addition of mineral N and termination of N addition than C/N of O-horizon SOM (Fig. 2). Moreover, the an-nual mean DOC/DON-ratio in the N treatments showed contrasting temporal patterns in O horizon ZTL leachates. The decrease in DOC/DON of N1 plots between 1995 and
25
2009, as well as increased NO−
BGD
9, 12433–12467, 2012
4 decades of annual N addition on DOM in
a boreal forest soil
M. O. Rappe-George et al.
Title Page
Abstract Introduction
Conclusions References
Tables Figures
◭ ◮
◭ ◮
Back Close
Full Screen / Esc
Printer-friendly Version Interactive Discussion
Discussion
P
a
per
|
Dis
cussion
P
a
per
|
Discussion
P
a
per
|
Discussio
n
P
a
per
|
The results we present here also demonstrate that long-term N addition to a boreal forest sequestered C (only stemwood and Oi+e+a horizon C considered) at rates of 37.9±5.4 (N1 in 2010) and 32.3±1.0 kg C ha−1yr−1 per added kg N ha−1yr−1 (N2 in 1997). These estimates, although conservative, are in the interval 20–40 kg C ha−1yr−1 per kg N ha−1yr−1reported by de Vries et al. (2009) across non-N-saturated European
5
forests. Increased soil C in Oi+e+a horizon contributed little less than half of this se-questered C, ranging 37–53 % over both N treatments and years. This was caused by increased production of litter and unchanged, or even decreased per unit substrate, DOC. Moreover, respiration rates from O horizon material were suppressed in the N treated plots at Str ˚asan in an incubation study (Sj ¨oberg et al., 2003). The effect of
10
long-term N addition on mineral soil C balance was unclear: increased DOC originat-ing from old SOM was to an unknown degree countered by altered production of litter belowground and CO2evasion. N deposition in Swedish forests has not declined since mid 1990s, in contrast to S deposition which has declined substantially (Pihl-Karlsson et al., 2011). The N2 treatment had elevated mineral B horizon DOC 19 yr after
termi-15
nation of N addition. This indicates that recovery from heavy N addition may be very slow even at sites originally strongly N limited: a finding with implications for the effect of N deposition on C balance of terrestrial ecosystems. Generally, mycorrhizal abundance decreases in response to N addition (H ¨ogberg et al., 2003; Treseder et al., 2006). Thus, changes to the soil microbial community composition and its function were likely in the
20
N1 and N2 treatments. Detailed studies of the regulating function of soil biology on C and N cycling at Str ˚asan are needed to improve our understanding of these systems in the context of biogeochemical cycles and global change, e.g. terrestrial C balances and anthropogenic N deposition.
5 Conclusions
25
BGD
9, 12433–12467, 2012
4 decades of annual N addition on DOM in
a boreal forest soil
M. O. Rappe-George et al.
Title Page
Abstract Introduction
Conclusions References
Tables Figures
◭ ◮
◭ ◮
Back Close
Full Screen / Esc
Printer-friendly Version Interactive Discussion
Discussion
P
a
per
|
Dis
cussion
P
a
per
|
Discussion
P
a
per
|
Discussio
n
P
a
per
|
production on DOC in O horizon at Str ˚asan. There is no direct positive effect of long term N addition on O horizon DOC: on the contrary, a negative effect per unit substrate C (soil C and litterfall production) is shown. This brings about an enhanced C seques-tration in forest floor O horizon. Elevated O horizon DON and NO−3 in the on-going N treatment, N1, indicates development towards N saturation. DON in O horizon leachate
5
is elevated 19 yr after termination of N addition, although the DOC/DON approaches DOC/DON of control.
Long-term N addition approximately doubles leachate concentration of DOC and DON in mineral B horizon at Str ˚asan. This could have consequences for water quality as DOC is known to be a transporter of several metals and radionuclides. Increased
10
aromaticity of the sampled DOM in both the ongoing and terminated N treatment indi-cates that old SOM in the mineral soil is a source of the increased DOC in B horizon. 19 yr after termination of N addition, DON returns to control levels, but DOC remains elevated. These effects appear not to be driven by acidity but rather by biology. Future work at Str ˚asan should aim to link changes to soil C and N cycling with detailed studies
15
of soil biology, addressing processes in both O and mineral B horizon explicitly.
Acknowledgements. This work was supported by the Swedish University of Agricultural
Sci-ences, SLU, FoMa Acidification Program. SLU small fund contributed to financial support. We gratefully acknowledge the contribution from Mikael Andersson, SLU, to the statistical analysis. Associate Mona N. H ¨ogberg, SLU, assisted in acquisition of estimates of tree stand volumes in 20
2010.
References
Andersson, P., Berggren, D., and Johnsson, L.: 30 years of N fertilisation in a forest ecosystem – the fate of added N and effects on N fluxes, Water Air Soil. Pollut., 130, 637–642, 2001. Andersson, P., Berggren, D., and Nilsson, I.: Indices for nitrogen status and nitrate leaching 25
BGD
9, 12433–12467, 2012
4 decades of annual N addition on DOM in
a boreal forest soil
M. O. Rappe-George et al.
Title Page
Abstract Introduction
Conclusions References
Tables Figures
◭ ◮
◭ ◮
Back Close
Full Screen / Esc
Printer-friendly Version Interactive Discussion
Discussion
P
a
per
|
Dis
cussion
P
a
per
|
Discussion
P
a
per
|
Discussio
n
P
a
per
|
Beier, C. and Hansen, K.: Evaluation of porous cup soil-water samplers under controlled field conditions: comparison of ceramic and PTFE cups, J. Soil Sci., 43, 261–271, 1992.
Berg, B. and Matzner, E.: Effect of N deposition on decomposition of plant litter and soil organic matter in forest systems, Environ. Rev., 5, 1–25, 1997.
Boudot, J. P., Bel, H., Brahim, A., Steiman, R., and Seigle-Murandi, F.: Biodegradation of syn-5
thetic organo-metallic complexes of iron and aluminium with selected metal to carbon ratios, Soil Biol. Biochem., 21, 961–966, 1989.
Brandel, G.: Volume functions for individual trees, Scots pine (Pinus sylvestris), Norway spruce
(Picea abies) and birch (Betula pendula&Betula pubescens), Department of Forest Yield
Research, 72 pp., Garpenberg, 1990. 10
Cairns, M. A., Brown, S., Helmer, E. H., and Baumgardner, G. A.: Root biomass allocation in the world’s upland forests, Oecologia, 111, 1–11, 1997.
Callesen, I., Liski, J., Raulund-Rasmussen, K., Olsson, M. T., Tau-Strand, L., Vesterdal, L., and Westman, C. J.: Soil carbon stores in nordic well-drained forest soils – relationships with climate and texture class, Glob. Change Biol., 9, 358–370, 2003.
15
Currie, W., Aber, J., McDowell, W., Boone, R., and Magill, A.: Vertical transport of dissolved organic C and N under long-term N amendments in pine and hardwood forests, Biogeo-chemistry, 35, 471–505, 1996.
de Vries, W., Solberg, S., Dobbertin, M., Sterba, H., Laubhann, D., van Oijen, M., Evans, C., Gundersen, P., Kros, J., Wamelink, G. W. W., Reinds, G. J., and Sutton, M. A.: The impact 20
of nitrogen deposition on carbon sequestration by European forests and heathlands, Forest Ecol. Manag., 258, 1814–1823, 2009.
Dilling, J. and Kaiser, K.: Estimation of the hydrophobic fraction of dissolved organic matter in water samples using UV photometry, Water Res., 36, 5037–5044, 2002.
Evans, C., Goodale, C., Caporn, S., Dise, N., Emmett, B., Fernandez, I., Field, C., Findlay, S., 25
Lovett, G., Meesenburg, H., Moldan, F., and Sheppard, L.: Does elevated nitrogen deposition or ecosystem recovery from acidification drive increased dissolved organic carbon loss from upland soil? A review of evidence from field nitrogen addition experiments, Biogeochemistry, 91, 13–35, 2008.
Farrell, M., Hill, P. W., Farrar, J., Bardgett, R. D., and Jones, D. L.: Seasonal variation in soluble 30
BGD
9, 12433–12467, 2012
4 decades of annual N addition on DOM in
a boreal forest soil
M. O. Rappe-George et al.
Title Page
Abstract Introduction
Conclusions References
Tables Figures
◭ ◮
◭ ◮
Back Close
Full Screen / Esc
Printer-friendly Version Interactive Discussion
Discussion
P
a
per
|
Dis
cussion
P
a
per
|
Discussion
P
a
per
|
Discussio
n
P
a
per
|
Fog, K.: The effect of added nitrogen on the rate of decomposition of organic matter, Biol. Rev., 63, 433–462, 1988.
Fr ¨oberg, M., Kleja, D. B., Bergkvist, B., Tipping, E., and Mulder, J.: Dissolved organic carbon leaching from a coniferous forest floor: a field manipulation experiment, Biogeochemistry, 75, 271–287, 2005.
5
Fr ¨oberg, M., Berggren, D., Bergkvist, B., Bryant, C., and Mulder, J.: Concentration and fluxes of dissolved organic carbon (DOC) in three Norway spruce stands along a climatic gradient in Sweden, Biogeochemistry, 77, 1–23, 2006.
Galloway, J. N., Dentener, F. J., Capone, D. G., Boyer, E. W., Howarth, R. W., Seitzinger, S. P., Asner, G. P., Cleveland, C. C., Green, P. A., Holland, E. A., Karl, D. M., Michaels, A. F., 10
Porter, J. H., Townsend, A. R., and V ¨orosmarty, C. J.: Nitrogen cycles: past, present, and future, Biogeochemistry, 70, 153–226, 2004.
Guggenberger, G.: Acidification effects on dissolved organic matter mobility in spruce forest ecosystems, Environ. Int., 20, 31–41, 1994.
Guggenberger, G., Zech, W., and Schulten, H.-R.: Formation and mobilization pathways of dis-15
solved organic matter: evidence from chemical structural studies of organic matter fractions in acid forest floor solutions, Org. Geochem., 21, 51–66, 1994.
Gundersen, P., Emmett, B. A., Kjønaas, O. J., Koopmans, C. J., and Tietema, A.: Impact of nitrogen deposition on nitrogen cycling in forests: a synthesis of NITREX data, Forest Ecol. Manag., 101, 37–55, 1998.
20
Kaiser, K. and Guggenberger, G.: The role of DOM sorption to mineral surfaces in the preser-vation of organic matter in soils, Org. Geochem., 31, 711–725, 2000.
Kalbitz, K., Solinger, S., Park, J.-H., Michalzik, B., and Matzner, E.: Controls on the dynamics of dissolved organic matter in soils: a review, Soil Sci., 165, 277–304, 2000.
Kalbitz, K., Meyer, A., Yang, R., and Gerstberger, P.: Response of dissolved organic matter in 25
the forest floor to long-term manipulation of litter and throughfall inputs, Biogeochemistry, 86, 301–318, 2007.
Kleja, D., Svensson, M., Majdi, H., Jansson, P.-E., Langvall, O., Bergkvist, B., Johansson, M.-B., Weslien, P., Truusb, L., Lindroth, A., and ˚Agren, G.: Pools and fluxes of carbon in three Norway spruce ecosystems along a climatic gradient in Sweden, Biogeochemistry, 89, 7–25, 30
2008.
BGD
9, 12433–12467, 2012
4 decades of annual N addition on DOM in
a boreal forest soil
M. O. Rappe-George et al.
Title Page
Abstract Introduction
Conclusions References
Tables Figures
◭ ◮
◭ ◮
Back Close
Full Screen / Esc
Printer-friendly Version Interactive Discussion
Discussion
P
a
per
|
Dis
cussion
P
a
per
|
Discussion
P
a
per
|
Discussio
n
P
a
per
|
Kuzyakov, Y.: Review: factors affecting rhizosphere priming effects, J. Plant Nutr. Soil Sc., 165, 382–396, 2002.
Leenheer, J. A.: Comprehensive approach to preparative isolation and fractionation of dissolved organic carbon from natural waters and wastewaters, Environ. Sci. Technol., 15, 578–587, 1981.
5
Marley, N. A., Gaffney, J. S., Oriandini, K. A., and Cunningham, M. M.: Evidence for radionuclide transport and mobilization in a shallow, sandy aquifer, Environ. Sci. Technol., 27, 2456–2461, 1993.
McDowell, W. H., Currie, W. S., Aber, J. D., and Yano, Y.: Effects of chronic nitrogen amend-ments on production of dissolved organic carbon and nitrogen in forest soils, Water Air Soil. 10
Poll., 105, 175–182, 1998.
Park, J.-H., Kalbitz, K., and Matzner, E.: Resource control on the production of dissolved or-ganic carbon and nitrogen in a deciduous forest floor, Soil Biol. Biochem., 34, 813–822, 2002.
Pregitzer, K., Zak, D., Burton, A., Ashby, J., and MacDonald, N.: Chronic nitrate additions dra-15
matically increase the export of carbon and nitrogen from northern hardwood ecosystems, Biogeochemistry, 68, 179–197, 2004.
Raastad, I. A. and Mulder, J.: Dissoved organic matter (DOM) in acid forest soils at Gardsjon (Sweden): natural variabilities and effects of increased input of nitrogen and of reversal of acidification, Water Air Soil Pollut., 114, 199–219, 1999.
20
Saarsalmi, A., Starr, M., Hokkanen, T., Ukonmaanaho, L., Kukkola, M., N ¨ojd, P., and Siev ¨anen, R.: Predicting annual canopy litterfall production for Norway spruce (Picea abies (L.) Karst.) stands, Forest Ecol. Manag., 242, 578–586, 2007.
Sinsabaugh, R. L., Zak, D. R., Gallo, M., Lauber, C., and Amonette, R.: Nitrogen deposition and dissolved organic carbon production in northern temperate forests, Soil Biol. Biochem., 36, 25
1509–1515, 2004.
Schmidt, B. H. M., Wang, C.-P., Chang, S.-C., and Matzner, E.: High precipitation causes large fluxes of dissolved organic carbon and nitrogen in a subtropical montane Chamaecyparis forest in Taiwan, Biogeochemistry, 101, 243–256, 2010.
Sj ¨oberg, G., Bergkvist, B., Berggren, D., and Nilsson, S. I.: Long-term N addition effects on the 30
BGD
9, 12433–12467, 2012
4 decades of annual N addition on DOM in
a boreal forest soil
M. O. Rappe-George et al.
Title Page
Abstract Introduction
Conclusions References
Tables Figures
◭ ◮
◭ ◮
Back Close
Full Screen / Esc
Printer-friendly Version Interactive Discussion
Discussion
P
a
per
|
Dis
cussion
P
a
per
|
Discussion
P
a
per
|
Discussio
n
P
a
per
|
Tamm, C.-O., Aronsson, A., and Burgtorf, H.: The optimum nutrition experiment Str ˚asan, a brief description of an experiment in a young stand of Norway spruce (Picea abies Karst.), De-partment of Forest Ecology and Forest Soils, Stockholm, 1974.
Tyler, G.: Leaching of metals from the A-horizon of a spruce forest soil, Water Air Soil. Poll., 15, 353–369, 1981.
5
Viro, P. J.: On the determination of stoniness, Communicationes Instituti Forestalis Fenniae, 49, Helsinki, 1952.
Waldrop, M. and Zak, D.: Response of oxidative enzyme activities to nitrogen deposition affects soil concentrations of dissolved organic carbon, Ecosystems, 9, 921–933, 2006.
Zech, W. and Guggenberger, G.: Organic matter dynamics in forest soils of temperate and 10
BGD
9, 12433–12467, 2012
4 decades of annual N addition on DOM in
a boreal forest soil
M. O. Rappe-George et al.
Title Page
Abstract Introduction
Conclusions References
Tables Figures
◭ ◮
◭ ◮
Back Close
Full Screen / Esc
Printer-friendly Version Interactive Discussion
Discussion
P
a
per
|
Dis
cussion
P
a
per
|
Discussion
P
a
per
|
Discussio
n
P
a
per
|
Table 1. Nitrogen addition rates (kg N ha−1
yr−1
) and total amount of N added 1967–2009 (kg N ha−1
) at Str ˚asan.
Year Duration Control N1 N2
1967–1969 3 yr 0 60 120
1970–1976 7 yr 0 40 80
1977–1990 14 yr 0 40 60
1991–2009 19 yr 0 30 0
BGD
9, 12433–12467, 2012
4 decades of annual N addition on DOM in
a boreal forest soil
M. O. Rappe-George et al.
Title Page
Abstract Introduction
Conclusions References
Tables Figures
◭ ◮
◭ ◮
Back Close
Full Screen / Esc
Printer-friendly Version Interactive Discussion
Discussion
P
a
per
|
Dis
cussion
P
a
per
|
Discussion
P
a
per
|
Discussio
n
P
a
per
|
Table 2.Soil carbon and nitrogen pools in 1996 and 2010 (tons C and N ha−1
, respectively). Values are mean±range (n=2). Superscripts denote significant differences atp=0.05 (Tukey HSD test). Within rows, values followed by the same letter were not significantly different. Data from 1996 are from Andersson et al. (2001).
1996 2010
Control N1 N2 Control N1 N2
Carbon
Oi 1.2±0.1a 3.6±0.1b 4.0±0.4b 2.4±0.2c 4.3±0.3b 3.7±<0.1b Oe+a 18.2±3.2
a
39.0±8.8b 44.7±4.1b 20.2±2.6a 45.1±10.0b 45.5±3.2b Total 19.4±3.3a 42.6±8.9b 48.7±4.4b 22.6±2.7a 49.4±10.2b 49.2±3.3b
Nitrogen
Oi 0.03±<0.01 a
0.13±0.01bc 0.16±0.02b 0.06±<0.01ad 0.12±<0.01bc 0.10±<0.01cd Oe+a 0.54±0.09a 1.44±0.30b 1.77±0.17b 0.60±0.07a 1.60±0.34b 1.75±0.17b
BGD
9, 12433–12467, 2012
4 decades of annual N addition on DOM in
a boreal forest soil
M. O. Rappe-George et al.
Title Page
Abstract Introduction
Conclusions References
Tables Figures
◭ ◮
◭ ◮
Back Close
Full Screen / Esc
Printer-friendly Version Interactive Discussion
Discussion
P
a
per
|
Dis
cussion
P
a
per
|
Discussion
P
a
per
|
Discussio
n
P
a
per
|
Table 3. Standing tree volume, thinned and total production of stemwood (m3on bark ha−1)
at Str ˚asan. Values are mean±range (n=2). Superscripts denote significant differences atp=
0.05 (Tukey HSD test). Within columns, values followed by the same letter were not significantly different. Data on diameter at breast height and height in 1997 were obtained from the Unit for Field-based Forest Research database (Swedish University of Agricultural Sciences).
1997 2010
Standing tree Thinned Total Standing tree Thinned Total
volume volume production volume volume production
Control 163.5±2.5a 7.6±0.5 171.1±2.0a 286.2±17.7c 9.7±2.8 295.9±14.9c
N1 267.0±2.0b 46.2±2.3 313.2±0.3b 424.7±12.7d 16.0±8.2 440.6±4.5d
BGD
9, 12433–12467, 2012
4 decades of annual N addition on DOM in
a boreal forest soil
M. O. Rappe-George et al.
Title Page
Abstract Introduction
Conclusions References
Tables Figures
◭ ◮
◭ ◮
Back Close
Full Screen / Esc
Printer-friendly Version Interactive Discussion
Discussion
P
a
per
|
Dis
cussion
P
a
per
|
Discussion
P
a
per
|
Discussio
n
P
a
per
|
Table 4. Means (95 % confidence intervals) of concentrations of dissolved organic carbon
(DOC) and dissolved organic nitrogen (DON) in O and B horizon leachates in 1995 and 2009 at Str ˚asan (n=24). Both DOC and DON are in mg l−1
. Superscripts denote significant differences atp=0.05 (Tukey HSD). Within lysimeter type and variable, values followed by the same letter were not significantly different. Significant interaction treatment×year found for DON in ZTL and TL.
Horizon Control N1 N2
O Zero tension lysimeters DOC
1995 28.7 (19.1–43.2)a 29.2 (19.4–44.1)a 27.4 (18.2–41.3)a 2009 41.3 (33.5–50.9)b 55.5 (45.1–68.3)b 53.0 (43.0–65.4)b
DON
1995 0.9 (0.6–1.2)a 1.1 (0.8–1.6)ab 0.9 (0.6–1.3)a 2009 1.0 (0.7–1.4)a 3.4 (2.4–4.9)c 1.9 (1.3–2.7)b
O Rhizon lysimeters
DOC
1995 51.3 (44.2–59.5)a 46.5 (40.1–53.9)a 51.6 (44.5–59.8)a
DON
1995 1.1 (0.8–1.4)a 3.1 (2.3–4.2)b 1.3 (1.0–1.7)a
B Tension lysimeters
DOC
1995 1.5 (1.2–2.0)a 2.1 (1.6–2.7)b 3.4 (2.7–4.5)c 2009 2.3 (1.7–3.1)b 3.3 (2.5–4.5)c 4.7 (3.5–6.3)d
DON
BGD
9, 12433–12467, 2012
4 decades of annual N addition on DOM in
a boreal forest soil
M. O. Rappe-George et al.
Title Page
Abstract Introduction
Conclusions References
Tables Figures
◭ ◮
◭ ◮
Back Close
Full Screen / Esc
Printer-friendly Version Interactive Discussion
Discussion
P
a
per
|
Dis
cussion
P
a
per
|
Discussion
P
a
per
|
Discussio
n
P
a
per
|
Table 5.Lenheer fractionation of O horizon leachates at Str ˚asan experimental forest measured
in 1995. Data from Zero tension lysimeters (ZTL) and rhizon lysimeters (R) are shown. Values are mean±95 % confidence interval (n=4). Superscripts denote significant differences atp= 0.05 (Tukey HSD). Within column and lysimeter type, values followed by the same letter were not significantly different.
Hydrophobic Hydrophilic
Lysimeter Treatment Acids Neutrals Acids Neutrals Bases
ZTL Control 48.4±8.8a 5.9±2.2a 37.0±4.4a 4.4±2.6a 4.3±1.9a ZTL N1 48.9±8.7a 8.1±2.2a 34.9±4.4a 3.9±2.7a 4.3±2.0a ZTL N2 45.6±9.3a 9.5±2.5a 49.6±4.9a 1.7±2.8a 4.4±2.1a
BGD
9, 12433–12467, 2012
4 decades of annual N addition on DOM in
a boreal forest soil
M. O. Rappe-George et al.
Title Page
Abstract Introduction
Conclusions References
Tables Figures
◭ ◮
◭ ◮
Back Close
Full Screen / Esc
Printer-friendly Version Interactive Discussion
Discussion
P
a
per
|
Dis
cussion
P
a
per
|
Discussion
P
a
per
|
Discussio
n
P
a
per
|
Table 6. Specific UV absorbance at 254 (SUVA254 nm) and 280 nm (SUVA280 nm) at Str ˚asan
experimental forest in O horizon and B horizon leachates. Both SUVA254 nm and SUVA280 nm
are in l mg−1
m−1
. Values are mean±95 % confidence intervals (n=24). Superscripts denote significant differences at p=0.05 (Tukey HSD test). Within column and soil horizon, values followed by the same letter were not significantly different.
Horizon Treatment SUVA254 nm SUVA280 nm
O Control 4.2±0.2a 3.1±0.2a
O N1 4.1±0.3a 3.1±0.2a
O N2 4.0±0.3a 3.0±0.2a
B Control 1.1±0.2a 0.8±0.2a
B N1 1.3±0.2b 0.9±0.2a