BGD
8, 3051–3079, 2011Estimations of carbon budget using
a model and field measurements
M. Adachi et al.
Title Page
Abstract Introduction
Conclusions References
Tables Figures
◭ ◮
◭ ◮
Back Close
Full Screen / Esc
Printer-friendly Version Interactive Discussion
Discussion
P
a
per
|
Dis
cussion
P
a
per
|
Discussion
P
a
per
|
Discussio
n
P
a
per
|
Biogeosciences Discuss., 8, 3051–3079, 2011 www.biogeosciences-discuss.net/8/3051/2011/ doi:10.5194/bgd-8-3051-2011
© Author(s) 2011. CC Attribution 3.0 License.
Biogeosciences Discussions
This discussion paper is/has been under review for the journal Biogeosciences (BG). Please refer to the corresponding final paper in BG if available.
Carbon budget of tropical forests in
Southeast Asia and the e
ff
ects of
deforestation: an approach using a
process-based model and field
measurements
M. Adachi1, A. Ito1, A. Ishida2, W. R. Kadir3, P. Ladpala4, and Y. Yamagata1 1
Centre for Global Environmental Research, National Institute for Environmental Studies, 16-2 Onogawa Tsukuba, Ibaraki, 305-8506, Japan
2
Centre for Ecological Research, Kyoto Univ., 509-3-2 Hirano Otsu, Shiga, 520-2113, Japan
3
Forest Research Institute Malaysia, 52109 Kepong, Selangor Darul Ehsan, Malaysia
4
Department of National Park, Wildlife and Plant Conservation, Chatuchak, Bangkok 10900, Thailand
Received: 26 November 2010 – Accepted: 18 February 2011 – Published: 21 March 2011
Correspondence to: M. Adachi (adachi.minaco@nies.go.jp)
BGD
8, 3051–3079, 2011Estimations of carbon budget using
a model and field measurements
M. Adachi et al.
Title Page
Abstract Introduction
Conclusions References
Tables Figures
◭ ◮
◭ ◮
Back Close
Full Screen / Esc
Printer-friendly Version Interactive Discussion
Discussion
P
a
per
|
Dis
cussion
P
a
per
|
Discussion
P
a
per
|
Discussio
n
P
a
per
|
Abstract
More reliable estimates of carbon (C) stock within forest ecosystems and C emission induced by deforestation are urgently needed to mitigate the effects of emissions on cli-mate change. A process-based terrestrial biogeochemical model (VISIT) was applied to tropical primary forests of two types (a seasonal dry forest in Thailand and a rain-5
forest in Malaysia) and one agro-forest (an oil palm plantation in Malaysia) to estimate the C budget of tropical ecosystems, including the impacts of land-use conversion, in Southeast Asia. Observations and VISIT model simulations indicated that the primary forests had high photosynthetic uptake: gross primary production was estimated at 31.5–35.5 t C ha−1yr−1. In the VISIT model simulation, the rainforest had a higher total 10
C stock (plant biomass and soil organic matter, 301.5 t C ha−1
) than that in the sea-sonal dry forest (266.5 t C ha−1) in 2008. The VISIT model appropriately captured the impacts of disturbances such as deforestation and land-use conversions on the C bud-get. Results of sensitivity analysis implied that the ratio of remaining residual debris was a key parameter determining the soil C budget after deforestation events. The C 15
stock of the oil palm plantation was about 46% of the rainforest’s C at 30 yr following initiation of the plantation, when the ratio of remaining residual debris was assumed to be about 33%. These results show that adequate forest management is important for reducing C emission from soil and C budget of each ecosystem must be evaluated over a long term using both the model simulations and observations.
20
1 Introduction
More detailed estimations of carbon (C) stocks within forest ecosystems and C emis-sions induced by deforestation are important environmental research goals. According to various estimates, C emission from land-use change accounts for about 12% (van der Werf et al., 2009) or 20% (IPCC, 2007) of the total anthropogenic emissions world-25
BGD
8, 3051–3079, 2011Estimations of carbon budget using
a model and field measurements
M. Adachi et al.
Title Page
Abstract Introduction
Conclusions References
Tables Figures
◭ ◮
◭ ◮
Back Close
Full Screen / Esc
Printer-friendly Version Interactive Discussion
Discussion
P
a
per
|
Dis
cussion
P
a
per
|
Discussion
P
a
per
|
Discussio
n
P
a
per
|
around the world using various models (Cramer et al., 2004; Huang et al., 2008; Kato et al., 2009; McGuire et al., 2001; Ramankutty et al., 2007; Shevliakova et al., 2009). To evaluate the annual C emission from land-use change caused by anthropogenic deforestation, several models considered the different decay rates of harvested for-est products, based on the method by Houghton et al. (1983). Cramer et al. (2004) 5
reported that C emission due to land-use change had a great uncertainty in South-east Asia: 1.08 Gt yr−1according to Houghton (1999) and 0.30–0.49 Gt yr−1according to Cramer et al. (2004). Model simulations suggested that, despite uncertainties in the deforestation area, a large amount of C would be released through deforestation in the future (Cramer et al., 2004). Kato et al. (2009) estimated that 44.4 Gt C had 10
been emitted globally over the prior 100 yr, and the global C emission induced by land-use change was estimated as 0.5 Gt C yr−1 in the 1980s. At the regional scale, many model simulations of the impacts of deforestation have specifically examined Amazo-nian forests (e.g., Malhi et al., 2008), whereas fewer studies have investigated the impacts of land-use change on the C stocks of ecosystems in Southeast Asia.
15
According to the global forest resource assessment conducted in 2010 (FAO 2010), tropical forests excluding rubber plantations, accounted for 19.3 million ha. Since 1990, the area of tropical forests in Malaysia had decreased by 1.2 million ha. Those defor-ested areas have been converted mostly into farmlands or agro-forests. The area of oil palm plantations in Malaysia increased especially rapidly, from 2.0 million ha in 1990 20
to 4.2 million ha in 2007 (FAO, 2010). Consequently, Malaysia has become one of the major palm oil producing countries, producing more than 40% of the world’s supply (Fitzherbert et al., 2008).
A more detailed understanding of the impacts of deforestation on the net C budget of ecosystems in Southeast Asia is needed for C management and mitigation of climate 25
BGD
8, 3051–3079, 2011Estimations of carbon budget using
a model and field measurements
M. Adachi et al.
Title Page
Abstract Introduction
Conclusions References
Tables Figures
◭ ◮
◭ ◮
Back Close
Full Screen / Esc
Printer-friendly Version Interactive Discussion
Discussion
P
a
per
|
Dis
cussion
P
a
per
|
Discussion
P
a
per
|
Discussio
n
P
a
per
|
decomposition of slow pools, such as coarse woody debris. The change in vegetation structure (e.g., biomass and canopy leaf amount), plant ecophysiological properties (e.g., photosynthetic capacity and respiration) and soil biogeochemical properties (e.g., soil texture) are important factors to consider for a more detailed assessment in model simulation. Furthermore, in the case of cropland, we must consider C exports through 5
crop harvests when evaluating the net ecosystem C budget (e.g., Chapin et al., 2006; Poulter et al., 2010) is properly evaluated. The objectives of the present study were to: (1) clarify the similarities and differences between a wet and dry forest to evaluate the potential applicability of the VISIT model, (2) compare the model simulations of tropical ecosystems with field data and modify the VISIT model accordingly, and (3) evaluate 10
the C budget before and after land-use conversion in Malaysia using the VISIT model. Based on our findings, we discuss the potential applicability of the VISIT model and some problems related to its application in Southeast Asia.
2 Materials and methods
2.1 Site description
15
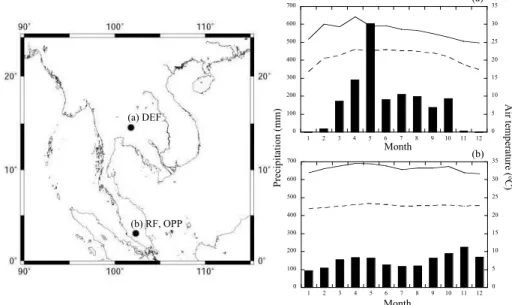
The present study was conducted in two primary forests, a rainforest (RF) in Malaysia and a dry evergreen forest (DEF) in Thailand, and an oil palm plantation (OPP) in Malaysia (Fig. 1). The RF was in the Pasoh Forest Reserve (2◦5′N, 102◦18′E) and the OPP was adjacent to the reserve. The annual mean air temperature in the Pa-soh area was 27.1◦C (1992–1994; Bekku et al., 2003) and the monthly mean max-20
imum and minimum air temperatures were 32.5◦C and 22.5◦C in the Pasoh area, respectively (1991–1997; Manokaran et al., 2004). The annual precipitation ranged from 1450 to 2341 mm (1995–2000; Malaysian Meteorological Services). The RF is a tropical evergreen forest dominated by Dipterocarpaceae, with total aboveground biomass of 403 t dry matter ha−1in 1998 (Hoshizaki et al., 2004). At the OPP, oil palms
25
BGD
8, 3051–3079, 2011Estimations of carbon budget using
a model and field measurements
M. Adachi et al.
Title Page
Abstract Introduction
Conclusions References
Tables Figures
◭ ◮
◭ ◮
Back Close
Full Screen / Esc
Printer-friendly Version Interactive Discussion
Discussion
P
a
per
|
Dis
cussion
P
a
per
|
Discussion
P
a
per
|
Discussio
n
P
a
per
|
seedlings were replanted in 2002 for the second rotation. Based on the Malaysian and FAO soil classification systems, the soil texture at 5-cm depth was heavy clay in the RF and sandy clay loam in the OPP (Adachi et al., 2005), respectively. Soil C contents at 5 cm depth in RF and OPP were 2.92% and 1.55%, respectively (Adachi et al., 2006).
The DEF was located at the Sakaerat Environmental Research Station (14◦30′N,
5
101◦55′E). The annual mean temperature was 24.1◦C and the monthly mean max-imum and minmax-imum air temperatures in DEF were 28.1◦C and 21.0◦C, respectively (2001–2003; from the AsiaFlux Database). The annual precipitation was 1733 mm in 2003 (Ishida et al., 2006). Trees of the Dipterocarpaceae, Moraceae and Meli-aceae are dominant (Yamashita et al., 2010). The total aboveground biomass was 10
452.6 t dry matter ha−1in 1993 (Kanzaki et al., 2008). The soil in the DEF was
classi-fied as a Typic Paleudult, and the soil C content was 2.48% at 5 cm depth (Yamashita et al., 2010).
2.2 Model overview
A process-based terrestrial biogeochemical model (VISIT) was developed based on 15
a simple C cycle model (Sim-CYCLE; Ito and Oikawa 2002; Kato et al., 2009), in which the atmosphere-ecosystem exchange and internal dynamics of C are simulated at a daily time step. The model enables us to evaluate atmosphere-ecosystem ex-change of greenhouse gases (CO2, CH4 and N2O) and to simulate long-term
dynam-ics, including the impacts of disturbance (Ito et al., 2005). 20
We conducted a spin-up calculation for 2000 yr to create an appropriate initial state of ecosystem C pools and budgets using the climate data for 1948–2008, repeatedly at each site. In this model, the ecosystem structure of the C stock is represented by four sectors: tall canopy trees, understory plants, dead biomass and mineral soil. The ecosystem budget of CO2, that is, the net ecosystem production (NEP), is obtained
25
BGD
8, 3051–3079, 2011Estimations of carbon budget using
a model and field measurements
M. Adachi et al.
Title Page
Abstract Introduction
Conclusions References
Tables Figures
◭ ◮
◭ ◮
Back Close
Full Screen / Esc
Printer-friendly Version Interactive Discussion
Discussion
P
a
per
|
Dis
cussion
P
a
per
|
Discussion
P
a
per
|
Discussio
n
P
a
per
|
heterotrophic respiration. These biogeochemical C flows are calculated, based on models of the ecophysiological responses of the vegetation to environmental parame-ters.
Moisture conditions such as soil water content, which determine the effect of water stress on plant production and soil decomposition, are simulated in a hydrological sub-5
scheme. In the submodel, soil moisture content is calculated from the water-budget equation using data of precipitation data (input), and estimated evapotranspiration and runoffdischarge are estimated in another submodel (Ito and Oikawa, 2002). The VISIT model was originally developed for a cool-temperate deciduous broad-leaved forest (Inatomi et al., 2010).
10
In the present study, we also modified the VISIT model by adding land-use conver-sion processes. To evaluate the effect of land-use conversion from a primary forest to an oil palm plantation, we incorporated three processes in the model: (1) removal of the existing aboveground forest biomass; (2) production of woody and root debris; and (3) planting of oil palm seedlings. When a clear-cut occurs at a certain stand age in 15
the simulation, it was assumed that all canopy trees are cut and exported, except for a part of the stems, leaves, and roots that are left behind as residual woody debris. VISIT model is able to individually define the ratio of remaining stems, leaves and roots as residual debris. McGuire et al. (2001) reported various conversion ratios for the amount of C stored in the products obtained from tropical ecosystems that is released 20
to atmosphere: 33% of total biomass C remained in the soil as residual woody debris, 40% and 27% of total biomass C was returned to the atmosphere within the 1st and 10th year, respectively. In the present study, residual debris was added to soil C and the decomposition ratio of this debris was assumed to be the same as the litter de-composition rate. C export from crop harvest was changed according to the ratio of 25
BGD
8, 3051–3079, 2011Estimations of carbon budget using
a model and field measurements
M. Adachi et al.
Title Page
Abstract Introduction
Conclusions References
Tables Figures
◭ ◮
◭ ◮
Back Close
Full Screen / Esc
Printer-friendly Version Interactive Discussion
Discussion
P
a
per
|
Dis
cussion
P
a
per
|
Discussion
P
a
per
|
Discussio
n
P
a
per
|
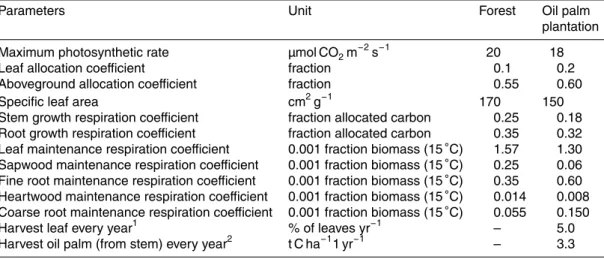
parameters of the primary forests (DEF and RF) and the OPP are presented in Table 1. Although the VISIT model does not simulate the stem density explicitly, the difference between the forest and oil palm canopies might be captured reasonably well as the differences in photosynthetic capacities and allocation coefficients. After planting, oil palm seedlings are managed as they grow. When the trees are 5 yr old, 5% of the 5
leaves are pruned every year, and they are harvested from 10 yr of age, accounting for a carbon loss of 3.3 t C ha−1yr−1.
2.3 Soil parameters used in the model
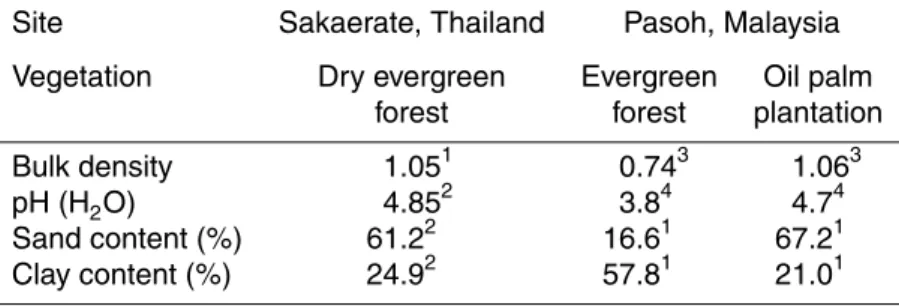
The soil characteristics of DEF, RF and OPP were represented by four soil parameters (bulk density, pH, and sand and clay contents) obtained from previous reports and 10
filed measurements made in this study (Table 2). These parameters are important for characterising hydrological and biogeochemical properties to evaluate the C stock of soil and C sequestration following the land-use change using the VISIT model. Soil solid volumes within 100 mL soil care samples were measured using a three-phase metre (DIK-1121; Daiki Rika Kogyo Co. Ltd., Japan). The fresh weight of each soil 15
sample was measured and the material was dried at 105◦C for 48 h. The dry weight was measured to calculate the volumes of the water and gas phases within the core samples (Hillel, 1998).
2.4 Input and validation data for the VISIT model
The model simulations were conducted at a daily time step, using daily average me-20
teorological forcing data (Table 3). For this study, daily data were derived from a re-analysis global climate dataset produced by the US National Centres for Environmen-tal Prediction and the US National Centre for Atmospheric Research (NCEP/NCAR; Kistler et al., 2001) for the period from 1 January 1948 to 31 December 2008. These data have a coarse spatial resolution, but they provide a representative long-term time 25
BGD
8, 3051–3079, 2011Estimations of carbon budget using
a model and field measurements
M. Adachi et al.
Title Page
Abstract Introduction
Conclusions References
Tables Figures
◭ ◮
◭ ◮
Back Close
Full Screen / Esc
Printer-friendly Version Interactive Discussion
Discussion
P
a
per
|
Dis
cussion
P
a
per
|
Discussion
P
a
per
|
Discussio
n
P
a
per
|
The diurnal patterns of GPP from 2003 to 2005 were compared with GPP data gath-ered by two satellites at a 1 km resolution. Data subsets for the RF and DEF were obtained from the Moderate Resolution Imaging Spectrometer (MODIS), Collection 5, onboard the Terra and Aqua satellites. The data were provided by the US Oak Ridge National Laboratory (http://daac.ornl.gov/MODIS/). Terra and Aqua pass the equator 5
same day at 10:30 and 13:30 LT, respectively. Data that passed the quality assurance were used for the comparison.
3 Results
3.1 C budget in the primary forests
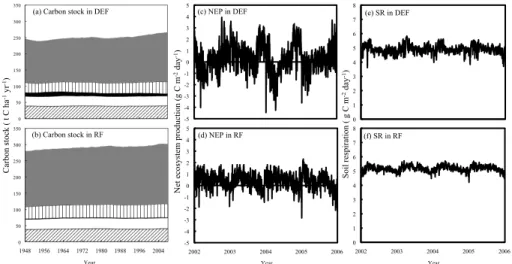
The C stock and C fluxes between RF and DEF were simulated using the VISIT model 10
(Fig. 3). Because the ecophysiological parameters of these forests were set at the same values in the model simulations (Table 1), the difference in their C budgets oc-curred mainly because of the differences in air temperatures, precipitation and soil parameters (Fig. 3; Table 4). The more humid RF had a higher total C stock (plant biomass and soil organic matter, 301.5 t C ha−1) than the drier in DEF (266.5 t C ha−1)
15
in 2008 (Fig. 3a,b). Similarly, the soil C stocks in RF in 2008 was estimated as 73.7 t C ha−1, which was higher than that in DEF (70.0 t C ha−1). Based on the field data, soil carbon content at soil surface in RF (2.92%) was also higher than that in DEF (2.48%). The seasonal variations in NEP and SR were clearer in DEF than in RF, probably because of the large seasonality of precipitation at DEF (Fig. 3c,f). 20
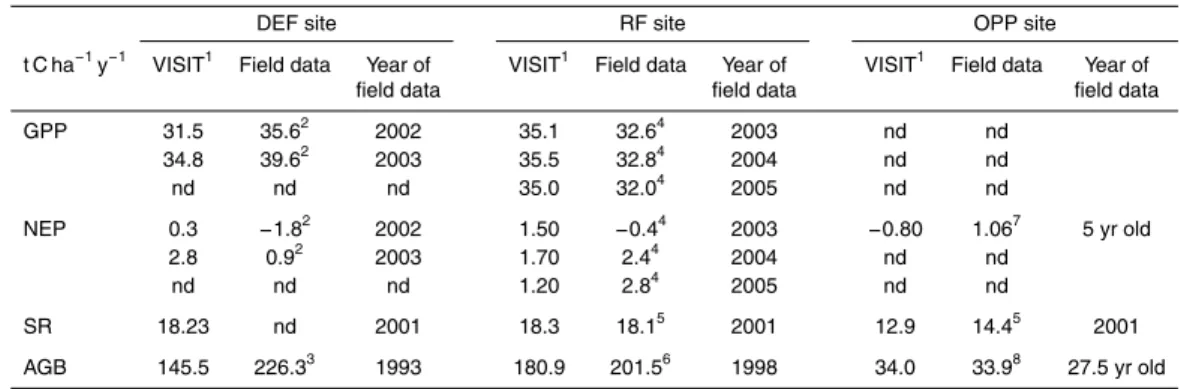
The standard variation (SD) of NEP in 2002–2006 was 1.27 g C m−2day−1in DEF and 0.66 g C m−2day−1 in RF. The SDs of SR were 0.29 and 0.20 g C m−2day−1 in DEF and RF, respectively. Table 4 presents the forest C budgets based on field measure-ments versus model estimates for DEF and RF. As compared to tropical ecosystems in general, relatively high photosynthetic uptakes (GPP) of 31.5–35.5 t C ha−1
yr−1
, were 25
BGD
8, 3051–3079, 2011Estimations of carbon budget using
a model and field measurements
M. Adachi et al.
Title Page
Abstract Introduction
Conclusions References
Tables Figures
◭ ◮
◭ ◮
Back Close
Full Screen / Esc
Printer-friendly Version Interactive Discussion
Discussion
P
a
per
|
Dis
cussion
P
a
per
|
Discussion
P
a
per
|
Discussio
n
P
a
per
|
for DEF. In this case, the model slightly underestimated the plant aboveground biomass at each site.
3.2 Effect of plantation formation on C stock
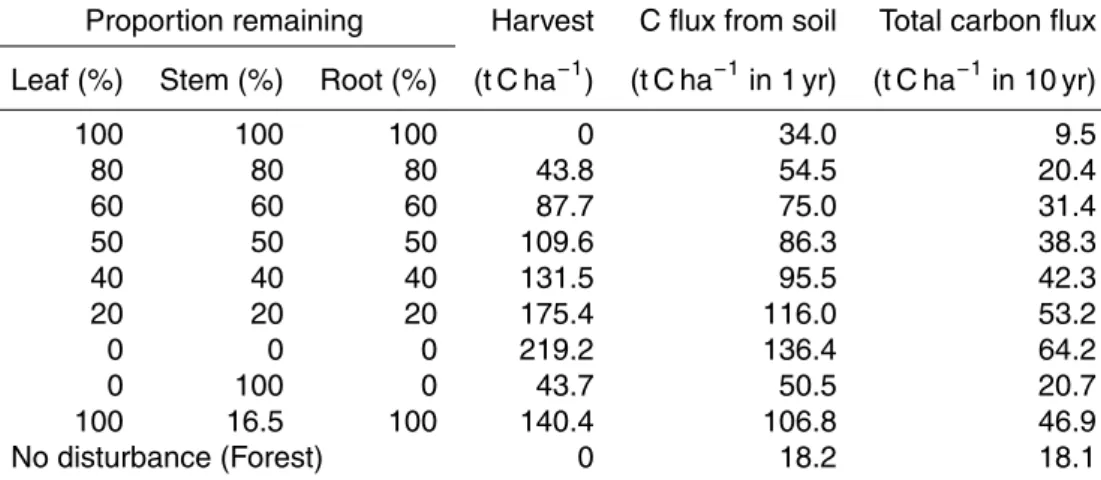
The VISIT model was able to capture appropriately the impacts of disturbances, namely the effect of land-use conversion, on the C budget. Table 5 shows results of a sensitiv-5
ity analysis of the VISIT model for the RF in terms of changes in the ratios of remaining residual debris for stem, leaf and root when a plantation is formed. Here, the propor-tions of the stem, leaf, and root C pools were individually changed from 0% to 100%. This finding indicates that the proportion of remaining residual debris of stems was more important than those of leaves and roots because most of the standing biomass 10
in the primary forest was dominated by woody stems. The estimation of total C flux 10 yr after land-use conversion was lower than in the undisturbed forest ecosystems, irrespective of the proportions, because the supply of litter and its decomposition rate were decreased in OPP.
The estimated values of soil C emission after disturbance are expected to be un-15
derestimated, however, because the calculation does not account for decomposition acceleration at the soil surface due to the change in the radiation budget. In general, the soil surface becomes warmer and dryer after a clear-cut because it receives more direct solar radiation (Ritter et al., 2005). We evaluated the total C emission caused by deforestation and land-use change, using a conventional method for model estimation 20
(McGuire et al., 2001) that assumes that 33% of the total biomass remains as residue. Correspondingly, soil C emission in the 1 yr after the disturbance was estimated as 106.8 t C ha−1when the proportion of total biomass as residue was about 33%. In that case, the 100% of leaves, 16.5% of stems and 100% of roots remained (Table 5). In addition, 40% of harvested C was released to the atmosphere within 10 yr in a tropical 25
BGD
8, 3051–3079, 2011Estimations of carbon budget using
a model and field measurements
M. Adachi et al.
Title Page
Abstract Introduction
Conclusions References
Tables Figures
◭ ◮
◭ ◮
Back Close
Full Screen / Esc
Printer-friendly Version Interactive Discussion
Discussion
P
a
per
|
Dis
cussion
P
a
per
|
Discussion
P
a
per
|
Discussio
n
P
a
per
|
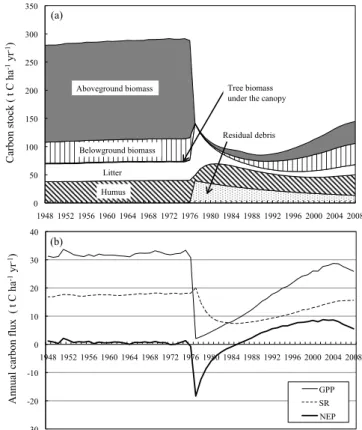
Figure 4 shows the temporal variations (from 1948 to 2008) in the C stock and C efflux for land-use conversion from a primary forest (RF) to an oil-palm plantation (OPP) in 1976, simulated by the VISIT model. Note, however, that there were few field data from the plantation (Table 4). The values of aboveground biomass C in OPP was similar for filed measurements and model estimates of 27.5 yr-old oil palms in 2003 and half 5
year. Our findings indicated that the total C stock (total biomass and soil C) in OPP (139.8 t C ha−1) at 30 yr following the initiation of the plantation was about 46% that of the RF (302.4 t C ha−1) in 2006.
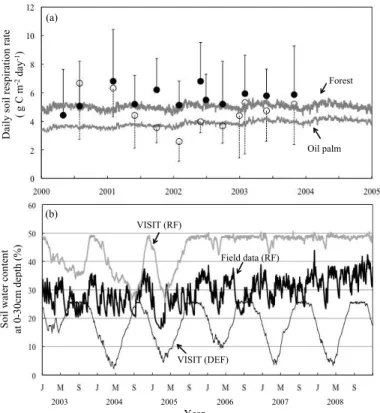
Figure 5a shows the seasonal variation in SR estimated using the VISIT model and field data from RF and OPP. According to the field data, the spatial variation in SR 10
was greater than the seasonal variation. Adachi et al. (2005) reported that the spatial variation in SR in RF and OPP was higher than in the temperate forest. Moreover, the seasonal variation of SR in the model simulation is less than that observed in the field. The estimated annual SR according to the model was similar to that of filed observations (Table 4), but the spatial variation in SR was not considered in the VISIT 15
model. The soil water content in RF estimated by the VISIT model was higher than that measured in the field (Fig. 5b), mainly because precipitation data tended to be high (Fig. 2).
A comparison of the VISIT model estimates with MODIS data showed that the sea-sonal variation range of GPP in DEF was more similar to the data gathered by the Terra 20
BGD
8, 3051–3079, 2011Estimations of carbon budget using
a model and field measurements
M. Adachi et al.
Title Page
Abstract Introduction
Conclusions References
Tables Figures
◭ ◮
◭ ◮
Back Close
Full Screen / Esc
Printer-friendly Version Interactive Discussion
Discussion
P
a
per
|
Dis
cussion
P
a
per
|
Discussion
P
a
per
|
Discussio
n
P
a
per
|
4 Discussion
4.1 Comparison of two primary forests
The model simulation results were consistent with field data from the rainforest and dry evergreen forest, indicating that the VISIT model is applicable to various forest types in the tropics of Southeast Asia. The model parameters of the forests (Table 1) are 5
based on Ito and Oikawa (2002), and they do not differ according to plant ecophysio-logical properties in DEF and RF. For instance, mean downward shortwave radiation of NCEP/NCAR in RF was 234 W m−2 from 1948 to 2008, and this rate was higher than that in DEF (222 W m−2). However, actual plant properties (e.g., the maximum
photosynthetic rate) differed from the model estimates and showed seasonal variation. 10
Some reports noted that the maximum photosynthetic rate differs according to tree species, leaf maturity, and the wet/dry season (Ishida et al., 2006; Kosugi et al., 2009). Despite these differences, the VISIT model accurately simulated the C budgets both of a tropical seasonal forest and a rainforest. One of the reasons, coefficient of plant growth and/or maintenance respiration in the VISIT model could be higher than these 15
of real rate.
The annual patterns revealed by VISIT model simulations would be more useful than the seasonal patterns. For instance, the seasonal variation in the SR rate based on field data was greater than that estimated by the model (Fig. 5), whereas the above-ground C stocks of the two primary forests were similar between field data and model 20
estimates (Table 4). According to the VISIT model, total biomass C (aboveground and belowground) in RF was estimated as 227 t C ha−1 in 2008, a rate that is simi-lar to that estimated using another model simulations (e.g., 250 t C ha−1; Ramankutty et al., 2007). These results indicate that tropical rainforests of Southeast Asia are among the most C-abundant ecosystems in the world, surpassing Amazonian rainfor-25
BGD
8, 3051–3079, 2011Estimations of carbon budget using
a model and field measurements
M. Adachi et al.
Title Page
Abstract Introduction
Conclusions References
Tables Figures
◭ ◮
◭ ◮
Back Close
Full Screen / Esc
Printer-friendly Version Interactive Discussion
Discussion
P
a
per
|
Dis
cussion
P
a
per
|
Discussion
P
a
per
|
Discussio
n
P
a
per
|
Terra versus Aqua data due to the formation of cumulus clouds before the Aqua over-pass (Miettinen and Liew, 2008). In the temperate forest, Ito (2010) compared VISIT model estimates with MODIS data of LAI, and both of them could estimate the seasonal variation in LAI. These results were supported by data based on the eddy covariance method (Table 4). However, Ohtsuka et al. (2009) reported that the difference of NEP 5
between the biometric method and the eddy-covariance method was±2 t C ha−1y−1in
a cool-temperate deciduous broad-leaved forest. Saleska et al. (2003) reported that, in the Amazonian rainforest, the observed seasonal pattern of NEE was opposite to the simulated pattern, although the proper precipitation pattern was used in the mod-els. In the present study, SR in DEF was estimated to have litter seasonal variation 10
(Fig. 3e). The SR rate in the wet season was almost twice that in the dry season in another dry evergreen forest in Thailand (Adachi et al., 2009). Estimates of soil water content showed a large variation for DEF (Fig. 5b), meaning that seasonal variation in soil water content would not significantly affect the SR rates in the VISIT model.
More validation data gathered in tropical regions using various methods are needed 15
to improve the VISIT model simulations. Data obtained by the biometric method, eddy covariance method and remote-sensing have different spatiotemporal scales. For in-stance, field measurements of SR rates are expected not only to vary temporally due to meteorological conditions, but also to show spatial variation among the limited number of SR chambers.
20
4.2 Effect of land-use change to an oil palm plantation on the ecosystem C budget
Although the oil palm plantations are structurally simpler than the primary forest ecosystems, agricultural tasks performed by people are expected to engender com-plexity and make model simulations of this system more difficult. The estimated and ob-25
BGD
8, 3051–3079, 2011Estimations of carbon budget using
a model and field measurements
M. Adachi et al.
Title Page
Abstract Introduction
Conclusions References
Tables Figures
◭ ◮
◭ ◮
Back Close
Full Screen / Esc
Printer-friendly Version Interactive Discussion
Discussion
P
a
per
|
Dis
cussion
P
a
per
|
Discussion
P
a
per
|
Discussio
n
P
a
per
|
of SR data were conducted at a location with no pruned fronds. We added the event of leaf harvest and removal to compare the simulated and observed SR rates. In planta-tions, however, the pruned fronds are piled up and left between the oil palms (Melling et al., 2008). Thus, the C stock in OPP might have been underestimated in the VISIT model.
5
Several studies have shown that the soil organic matter data are sensitive to land-use change in tropical ecosystems (Chaplot et al., 2005; Fujii et al., 2009; Marin-Spiotta et al., 2009). Sheng et al. (2010) reported that the temperature sensitivity of SR rates (i.e.,Q10 value) was higher in sloping tilled land than in a subtropical natural
forest in China. Solomon et al. (2007) found that soil organic C loss occurred during 10
the first 4 yr after land-use change in the tropical region and the forest soil was more sensitive to environmental conditions than that of native grasslands. However, Tanaka et al. (2009) reported finding no significant difference in total C contents among the secondary forests and some types of plantations, including trees of different ages in Malaysia.
15
Our field measurements indicated that soil physical parameters change when pri-mary forest is converted to an oil palm plantation. Using the VISIT model and the de-forestation rate reported by FAO (2010), we estimated the total C emissions induced by land-use change in Malaysia were estimated as 1.47 Mt C (M=106) between 1995 and
2004. This finding would provide useful information for activities related to the Reduce 20
Emissions from Deforestation and Forest Degradation (REDD). Detecting the effects of land-use change on soil biochemical and physical characteristics requires long-term measurements, however, because it is necessary to examine when and how these soil characteristics change. For instance, the oil palm trees were clear-cut and seedlings were replanted at 25 to 30 yr rotations in Southeast Asia (Corley and Tinker, 2003). 25
BGD
8, 3051–3079, 2011Estimations of carbon budget using
a model and field measurements
M. Adachi et al.
Title Page
Abstract Introduction
Conclusions References
Tables Figures
◭ ◮
◭ ◮
Back Close
Full Screen / Esc
Printer-friendly Version Interactive Discussion
Discussion
P
a
per
|
Dis
cussion
P
a
per
|
Discussion
P
a
per
|
Discussio
n
P
a
per
|
Acknowledgements. This research was supported by the Ministry of the Environment, Japan (grant no. A-0801). We thank T. Maeda of the National Institute of Advanced Industrial Science and Technology and the AsiaFlux Database (http://asiaflux.yonsei.kr/index.html) for providing the climate data in Sakaerat, Thailand. We also thank T. Nakano of Yamanashi Environment Studies and Yoshimura of Forestry and Forest Products Research Institute for their help in
5
conducting experiments at Sakaerat.
References
Adachi, M. and Koizumi, H.: Soil organic carbon dynamics of different land use in Southeast
Asia, in: Forest Canopies: Forest Production, Ecosystem Health and Climate Conditions, edited by: Creighton, J. D. and Roney, P. J., Nova Science Publishers Inc., New York, NY,
10
USA, 85–101, 2009.
Adachi, M., Bekku, S. Y., Konuma, A., Kadir, W. R., Okuda, T., and Koizumi, H.: Required sample size for estimating soil respiration rates in large areas of two tropical forests and of two types of plantation in Malaysia, Forest Ecol. Manag., 210, 455–459, 2005.
Adachi, M., Bekku, Y. S., Kadir, W. R., Okuda, T., and Koizumi, H.: Differences in soil respiration
15
between different tropical ecosystems, Appl. Soil. Ecol., 34, 258–265, 2006.
Adachi, M., Ishida, A., Bunyavejchewin, S., Okuda, T., and Koizumi, H.: Spatial and temporal variation in soil respiration in a seasonally dry tropical forest, Thailand, J. Trop. Ecol., 25, 532–539, 2009.
Bekku, S. Y., Nakatsubo, T., Kume, A., Adachi, M., and Koizumi, H.: Effect of warming on the
20
temperature dependence of soil respiration rate in arctic, temperate and tropical soils, Appl. Soil. Ecol., 22, 205–210, 2003.
Chapin, F. S. III, Woodwell, G. M., Randerson, J. T., Rastetter, E. B., Lovett, G. M., Baldoc-chi, D. D., Clark, D. A., Harmon, M. E., Schimel, D. S., Valentini, R., Wirth, C., Aber, J. D., Cole, J. J., Goulden, M. L., Harden, J. W., Heimann, M., Howarth, R. W., Matson, P. A.,
25
McGuire, A. D., Melillo, J. M., Mooney, H. A., Neff, J. C., Houghton, R. A., Pace, M. L.,
Ryan, M. G., Running, S. W., Sala, O. E., Schelesinger, W. H., and Schulze, E. D.: Reconcil-ing carbon-cycle concepts, terminology, and methods, Ecosystems, 9, 1041–1050, 2006. Chaplot, V. A. M., Rumpel, C., and Valentin, C.: Water erosion impact on soil and carbon
redistributions within uplands of Mekong River, Global Biogeochem. Cy., 19, GB4004,
30
BGD
8, 3051–3079, 2011Estimations of carbon budget using
a model and field measurements
M. Adachi et al.
Title Page
Abstract Introduction
Conclusions References
Tables Figures
◭ ◮
◭ ◮
Back Close
Full Screen / Esc
Printer-friendly Version Interactive Discussion
Discussion
P
a
per
|
Dis
cussion
P
a
per
|
Discussion
P
a
per
|
Discussio
n
P
a
per
|
Corley, R. H. V. and Tinker, P. B. (Eds.): The Oil Palm, Blackwell Science, Oxford, UK, 2003.
Cramer, W., Bondeau, A., Schaphoff, S., Lucht, W., Smith, B., and Sitch, S.: Tropical forests
and the global carbon cycle: impacts of atmospheric carbon dioxide, climate change and rate of deforestation, Philos. T. R. Soc. Lon. B, 359, 331–343, 2004.
Dufrene, E. and Saugier, B.: Gas exchange of oil palm in relation to light, vapour pressure
5
deficit, temperature and leaf age, Funct. Ecol., 7, 97–104, 1993.
Fitzherbert, E. B., Struebig, M. J., Morel, A., Danielsen, F., Br ¨uhl, C. A., Donald, P. F., and
Phalan, B.: How will oil palm expansion affect biodiversity?, Trends Ecol. Evol., 23, 538–545,
2008.
Food and Agriculture Organization (FAO): Global Forest Resources Assessment 2010, Country
10
report, Food and Agriculture Organization of the United Nations, Rome, Italy, 2010.
Fujii, K., Funakawa, S., Hayakawa, C., Sukartiningsih, and Kosaki, T.: Quantification of proton budgets in soil of cropland and adjacent forest in Thailand and Indonesia, Plant Soil, 316, 241–255, 2009.
Hillel, D. (Ed.): Environmental Soil Physics, Elsevier, New York, NY, USA, 1998.
15
Hirata, R., Saigusa, N., Yamamoto, S., Ohtani, Y., Ide, R., Asanuma, J., Gamo, M., Hirano, T., Kondo, H., Kosugi, Y., Li, S. G., Nakai, Y., Takagi, K., Tani, M., and Wang, H.: Spatial distri-bution of carbon balance in forest ecosystems across East Asia, Agr. Forest Meteorol., 148, 761–775, 2008.
Hoshizaki, H., Niiyama, K., Kimura, K., Yamashita, T., Bekku, Y., Okuda, T., Quah, E. S., and
20
Nur Supardi, M. N.: Recent biomass change in relation to stand dynamics in a lowland tropical rain forest, Pasoh Forest Reserve, Malaysia, Ecol. Res., 19, 357–363, 2004.
Houghton, R. A.: The annual net flux of carbon to the atmosphere from changes in land use 1850–1990, Tellus, B51, 298–313, 1999.
Houghton, R. A., Hobbie, J. E., Melillo, J. M., Moore, B., Peterson, B. J., Shaver, G. R., and
25
Woodwell, G. M.: Changes in the carbon content of terrestrial biota and soils between 1860
and 1980: a net release of CO2to the atmosphere, Ecol. Monogr., 53(3), 235–262, 1983.
Huang, M., Asner, G. P., Keller, M., and Berry, J. A.: An ecosystem model for
tropical forest disturbance and selective logging, J. Geophys. Res., 113, G01002, doi:10.1029/2007JG000438, 2008.
30
BGD
8, 3051–3079, 2011Estimations of carbon budget using
a model and field measurements
M. Adachi et al.
Title Page
Abstract Introduction
Conclusions References
Tables Figures
◭ ◮
◭ ◮
Back Close
Full Screen / Esc
Printer-friendly Version Interactive Discussion
Discussion
P
a
per
|
Dis
cussion
P
a
per
|
Discussion
P
a
per
|
Discussio
n
P
a
per
|
Intergovernmental Panel on Climate Change (IPCC): Climate Change 2007: The Physical Science Basis, edited by: Solomon, S., Qin, D., Manning, M., Chen, Z., Marquis, M., Av-eryt, K. B., Tignor, M., and Miller, H. L., Cambridge University Press, Cambridge, UK, 2007. Ishida, A., Diloksumpun, S., Ladpala, P., Staporn, D., Panuthai, S., Gamo, M., Yazaki, K.,
Ishizuka, M., and Puangchit, L.: Contrasting seasonal leaf habits of canopy trees between
5
tropical dry-deciduous and evergreen forests in Thailand, Tree Physiol., 26, 643–656, 2006. Ito, A.: Evaluation of the impacts of defoliation by tropical cyclones on a Japanese forest’s
carbon budget using flux data and a process-based model, J. Geophys. Res-Biogeo., 115, G04013, doi:10.1029/2010JG001314, 2010.
Ito, A. and Oikawa, T.: A simulation model of the carbon cycle in land ecosystems
(Sim-10
CYCLE): a description based on dry matter production theory and plot-scale validation, Ecol. Model., 151, 143–176, 2002.
Ito, A., Saigusa, N., Murayama, S., and Yamamoto, S.: Modeling of gross and net carbon dioxide exchange over a cool-temperate deciduous broad-leaved forest in Japan: analysis of seasonal and interannual change, Agr. Forest Meteorol., 134, 122–134, 2005.
15
Kanzaki, M., Kawaguchi, H., Kiyohara, S., Kajiwara, T., Kaneko, T., Ohta, S., Sangpalee, W. and Wachrinrat, C.: Long- term study on the carbon storage and dynamics in a tropical seasonal evergreen forest of Thailand, in: Tropical Forestry Change in a Changing World, FORTROP II International Conference, 17–20 November 2008, edited by: Pirangchit, L. and Diloksumpun, S., Royal Forest Department and Kasetart University, Bangkok, Thailand, 37–51, 2009.
20
Kato, T., Ito, A., and Kawamiya, M.: Multiple temporal scale variability during the twentieth century in global carbon dynamics simulated by a coupled climate-terrestrial carbon cycle model, Clim. Dynam., 32, 901–923, 2009.
Kistler, R., Kalnay, E., Collins, W., Saha, S., White, G., Woollen, J., Chelliah, M., Ebisuzaki, W., Kanamitsu, M., Kousky, V., van den Dool, H., Jenne, R., and Fiorino, M.: The NCEP-NCAR
25
50-year reanalysis: monthly means CD-ROM and documentation, B. Am. Meteorol. Soc., 82, 247–267, 2001.
Kosugi, Y., Takanashi, S., Ohkubo, S., Matsuo, N., Tani, M., Mitani, T., Tsutsumi, D., and
Nik, A. R.: CO2exchange of a tropical rainforest at Pasoh in Peninsular Malaysia, Agr. Forest
Meteorol., 148, 439–452, 2008.
30
Kosugi, Y., Takanashi, S., Matsuo, N., and Nik, A. R.: Middy depression of leaf CO2exchange
within the crown ofDipterocarpus sublamellatusin a lowland dipterocarp forest in Peninsular
BGD
8, 3051–3079, 2011Estimations of carbon budget using
a model and field measurements
M. Adachi et al.
Title Page
Abstract Introduction
Conclusions References
Tables Figures
◭ ◮
◭ ◮
Back Close
Full Screen / Esc
Printer-friendly Version Interactive Discussion
Discussion
P
a
per
|
Dis
cussion
P
a
per
|
Discussion
P
a
per
|
Discussio
n
P
a
per
|
Malhi, Y., Wood, D., Baker, T. R., Wright, J., Phillips, O. L., Cochrane, T., Meir, P., Chave, J., Almeida, S., Arroyo, L., Higuchi, N., Killeen, T. J., Laurance, S. G., Laurance, W. F., Lewis, S. L., Monteagudo, A., Neill, D. A., Vargas, P. N., Pitman, N. C. A., Quesada, C. A., Salomao, R., Silva, J. N. M., Lezama, A. T., Terborgh, J., Martinez, R. V., and Vinceti, B.: The regional variation of aboveground live biomass in old-growth Amazonian forests, Glob.
5
Change Biol., 12, 1107–1138, 2006.
Malhi, Y., Roberts, J. T., Betts, R. A., Killeen, T. J., Li, W., and Nobre, C. A.: Climate change, deforestation, and the fate of the Amazon, Science, 319, 169–172, 2008.
Manokaran, N., Quah, E. S., Ashton, P. S., LaFrankie, J. V., Nur Supardi, M. N., Ah-mad, W. M. S. W., and Okuda, T.: Pasoh forest dynamics plot, Peninsular Malaysia, in:
10
Tropical Forest Diversity and Dynamism, edited by: Losos, E. C. and Leigh, J. E. G., The University of Chicago Press, Chicago, USA, 585–598, 2004.
Marin-Spiotta, E., Silver, W., Swanston, C., and Ostertag, R.: Soil organic matter dynamics during 80 years of reforestation of tropical pastures, Glob. Change Biol., 15, 1584–1597, 2009.
15
McGuire, A. D., Sitch, S., Clein, J. S., Dargaville, R., Esser, G., Foley, J., Heimann, M., Joos, F., Kaplan, J., Kicklighter, D. W., Meier, R. A., Melillo, J. M., Moore III, B., Prentice, I. C., Ra-mankutty, N., Reichenau, T., Schloss, A., Tian, H., Williams, L. J., and Wittenberg, U.:
Car-bon balance of the terrestrial biosphere in the twentieth century: analyses of CO2, climate
and land use effects with four process-based ecosystem models, Glob. Change Biol., 15,
20
183–206, 2001.
Melling, L., Goh, K. J., Constance, B., and Hatano, R.: Carbon flow and budget in a young mature oil palm agroecosystem on deep tropical peat, Planter, 84, 21–25, 2008.
Miettinen, J. and Liew, S. C.: Comparison of multitemporal compositing methods for burnt area detection in Southeast Asian conditions, Int. J. Remote Sens., 29, 1075–1092, 2008.
25
Ohtsuka, T., Saigusa, N., and Koizumi, H.: On linking multiyear biometric measurements of tree growth with eddy covariance-based net ecosystem production, Glob. Change Biol., 15, 1015–1024, 2009.
Poulter, B., Aragao, L., Heyder, U., Gumpenberger, M., Heinke, J., Langerwisch, F., Rammig, A., Thonicke, K., and Cramer, W.: Net biome production of the Amazon Basin in the 21st century,
30
Glob. Change Biol., 16, 2062–2075, 2010.
BGD
8, 3051–3079, 2011Estimations of carbon budget using
a model and field measurements
M. Adachi et al.
Title Page
Abstract Introduction
Conclusions References
Tables Figures
◭ ◮
◭ ◮
Back Close
Full Screen / Esc
Printer-friendly Version Interactive Discussion
Discussion
P
a
per
|
Dis
cussion
P
a
per
|
Discussion
P
a
per
|
Discussio
n
P
a
per
|
51–66, 2007.
Ritter, E., Dalsgaard, L., and Einhorn, K. S.: Light, temperature and soil moisture regimes following gap formation in a semi-natural beech-dominated forest in Denmark, Forest Ecol. Manag., 206, 15–33, 2005.
Saleska, S. R., Miller, S. D., Matross, D. M., Goulden, M. L., Wofsy, S. C., da Rocha, H. R.,
5
de Camargo, P. B., Crill, P., Daube, B. C., de Freitas, H. C., Hutyra, L., Keller, M.,
Kirch-hoff, V., Menton, M., Munger, J. W., Pyle, E. H., Rice, A. H., and Silva, H.: Carbon in Amazon
forests: unexpected seasonal fluxes and disturbance-induced losses, Science, 302, 1554– 1557, 2003.
Shevliakova, E., Pacala, S. W., Malyshev, S., Hurtt, G. C., Milly, P. C. D., Caspersen, J. P.,
10
Sentman, L. T., Fisk, J. P., Wirth, C., and Crevoisier, C.: Carbon cycling under 300 years of land use change: importance of the secondary vegetation sink, Global Biogeochem. Cy., 23, GB2022 doi:10.1029/2007GB003176, 2009.
Sheng, H., Yang, Y., Yang, Z., Chen, G., Xie, J., Guo, J., and Zou, S.: The dynamic response of soil respiration to land-use changes in subtropical China, Glob. Change Biol., 16, 1107–
15
1121, 2010.
Solomon, D., Lehmann, J., Kinyangi, J., Amelung, W., Lobe, I., Pell, A., Riha, S., Ngoze, S., Verchot, L., Mbugua, D., Skjemstad, J., and Sch ¨afer, T.: Long-term impacts of anthropogenic perturbations on dynamics and speciation of organic carbon in tropical forest and subtropical grassland ecosystems, Glob. Change Biol., 13, 511–530, 2007.
20
Tanaka, S., Tachibe, S., Wasli, M. E. B., Lat, J., Seman, L., Kendawang, J. J., Iwasaki, K., and Sakurai, K.: Soil characteristics under cash crop farming in upland areas of Sarawaku, Malaysia, Agr. Ecosyst. Environ., 129, 293–301, 2009.
van der Werf, G. R., Morton, D. C., DeFries, R. S., Olivier, J. G. J., Kasibhatla, P. S.,
Jack-son, R. B., Collatz, G. J., and RanderJack-son, J. T.: CO2emissions from forest loss, Nat. Geosci.,
25
2, 737–738, 2009.
Yamashita, N., Ohta, S., Sase, H., Luangjame, J., Visaratana, T., Kievuttinon, B., Garivait, H., and Kanzaki, M.: Seasonal and spatial variation of nitrogen dynamics in the litter and surface soil layers on a tropical dry evergreen forest slope, Forest Ecol. Manag., 259, 1502–1512, 2010.
30
BGD
8, 3051–3079, 2011Estimations of carbon budget using
a model and field measurements
M. Adachi et al.
Title Page
Abstract Introduction
Conclusions References
Tables Figures
◭ ◮
◭ ◮
Back Close
Full Screen / Esc
Printer-friendly Version Interactive Discussion
Discussion
P
a
per
|
Dis
cussion
P
a
per
|
Discussion
P
a
per
|
Discussio
n
P
a
per
|
Table 1. Model parameters for the primary forest (dry evergreen forest and rainforest) and oil
palm plantation.
Parameters Unit Forest Oil palm
plantation
Maximum photosynthetic rate µmol CO2m−
2
s−1
20 18
Leaf allocation coefficient fraction 0.1 0.2
Aboveground allocation coefficient fraction 0.55 0.60
Specific leaf area cm2g−1
170 150
Stem growth respiration coefficient fraction allocated carbon 0.25 0.18
Root growth respiration coefficient fraction allocated carbon 0.35 0.32
Leaf maintenance respiration coefficient 0.001 fraction biomass (15◦C) 1.57 1.30
Sapwood maintenance respiration coefficient 0.001 fraction biomass (15◦C) 0.25 0.06
Fine root maintenance respiration coefficient 0.001 fraction biomass (15◦C) 0.35 0.60
Heartwood maintenance respiration coefficient 0.001 fraction biomass (15◦C) 0.014 0.008
Coarse root maintenance respiration coefficient 0.001 fraction biomass (15◦C) 0.055 0.150
Harvest leaf every year1 % of leaves yr−1 – 5.0
Harvest oil palm (from stem) every year2 t C ha−1
1 yr−1
– 3.3
BGD
8, 3051–3079, 2011Estimations of carbon budget using
a model and field measurements
M. Adachi et al.
Title Page
Abstract Introduction
Conclusions References
Tables Figures
◭ ◮
◭ ◮
Back Close
Full Screen / Esc
Printer-friendly Version Interactive Discussion
Discussion
P
a
per
|
Dis
cussion
P
a
per
|
Discussion
P
a
per
|
Discussio
n
P
a
per
|
Table 2.Model soil parameters at the dry evergreen forest (DEF) in Thailand and the rainforest
(RF) and oil palm plantation (OPP) in Malaysia.
Site Sakaerate, Thailand Pasoh, Malaysia
Vegetation Dry evergreen Evergreen Oil palm
forest forest plantation
Bulk density 1.051 0.743 1.063
pH (H2O) 4.852 3.84 4.74
Sand content (%) 61.22 16.61 67.21
Clay content (%) 24.92 57.81 21.01
BGD
8, 3051–3079, 2011Estimations of carbon budget using
a model and field measurements
M. Adachi et al.
Title Page
Abstract Introduction
Conclusions References
Tables Figures
◭ ◮
◭ ◮
Back Close
Full Screen / Esc
Printer-friendly Version Interactive Discussion
Discussion
P
a
per
|
Dis
cussion
P
a
per
|
Discussion
P
a
per
|
Discussio
n
P
a
per
|
Table 3.Input climate parameters from NCEP/NCAR to the VISIT model.
Parameters Unit
Air temperature at 2 m hight K
Maximum air temperature K
Minimum air temperature K
Specific humidity at 2 m kg kg−1
Precipitation kg m−2
s−1
Downward shortwave radiation W m−2
Cloud cover %
Soil surface temperature K
Soil temperature at 0–10 cm depth K
Soil temperature at 10–200 cm depth K
Soil temperature at 300 cm depth K
U wind (component of west-east) m s−1
V wind (component of north-south) m s−1
BGD
8, 3051–3079, 2011Estimations of carbon budget using
a model and field measurements
M. Adachi et al.
Title Page
Abstract Introduction
Conclusions References
Tables Figures
◭ ◮
◭ ◮
Back Close
Full Screen / Esc
Printer-friendly Version Interactive Discussion
Discussion
P
a
per
|
Dis
cussion
P
a
per
|
Discussion
P
a
per
|
Discussio
n
P
a
per
|
Table 4. Comparisons of gross primary production (GPP), net ecosystem production (NEP),
soil respiration rate (SR) and aboveground biomass carbon (AGB) between the VISIT model simulations and field measurements. AGB carbon values were estimated as half of the above-ground biomass.
DEF site RF site OPP site
t C ha−1 y−1
VISIT1 Field data Year of VISIT1 Field data Year of VISIT1 Field data Year of
field data field data field data
GPP 31.5 35.62 2002 35.1 32.64 2003 nd nd
34.8 39.62 2003 35.5 32.84 2004 nd nd
nd nd nd 35.0 32.04 2005 nd nd
NEP 0.3 −1.82 2002 1.50 −0.44 2003 −0.80 1.067 5 yr old
2.8 0.92 2003 1.70 2.44 2004 nd nd
nd nd nd 1.20 2.84 2005 nd nd
SR 18.23 nd 2001 18.3 18.15 2001 12.9 14.45 2001
AGB 145.5 226.33 1993 180.9 201.56 1998 34.0 33.98 27.5 yr old
1Same year or period as field data. 2Hirata et al. (2008).
3Half of above ground biomass, Kanzaki et al. (2009). 4Kosugi et al. (2008).
5Adachi and Koizumi (2009).
6Half of above ground biomass, Hoshizaki et al. (2004). 7Melling et al. (2008).
8half of above ground biomass, Corley and Tinker (2003).
BGD
8, 3051–3079, 2011Estimations of carbon budget using
a model and field measurements
M. Adachi et al.
Title Page
Abstract Introduction
Conclusions References
Tables Figures
◭ ◮
◭ ◮
Back Close
Full Screen / Esc
Printer-friendly Version Interactive Discussion
Discussion
P
a
per
|
Dis
cussion
P
a
per
|
Discussion
P
a
per
|
Discussio
n
P
a
per
|
Table 5. Results of sensitivity analysis of the carbon flux performed in 1 yr (1977) and total
carbon flux in 10 yr after deforestation in the VISIT model. Deforestation occurs in 1976 in this simulation. Shown are the harvest rate changes along with the changes in the proportions of remaining leaves, stems, and roots.
Proportion remaining Harvest C flux from soil Total carbon flux
Leaf (%) Stem (%) Root (%) (t C ha−1
) (t C ha−1
in 1 yr) (t C ha−1
in 10 yr)
100 100 100 0 34.0 9.5
80 80 80 43.8 54.5 20.4
60 60 60 87.7 75.0 31.4
50 50 50 109.6 86.3 38.3
40 40 40 131.5 95.5 42.3
20 20 20 175.4 116.0 53.2
0 0 0 219.2 136.4 64.2
0 100 0 43.7 50.5 20.7
100 16.5 100 140.4 106.8 46.9
No disturbance (Forest) 0 18.2 18.1
BGD
8, 3051–3079, 2011Estimations of carbon budget using
a model and field measurements
M. Adachi et al.
Title Page
Abstract Introduction
Conclusions References
Tables Figures
◭ ◮
◭ ◮
Back Close
Full Screen / Esc
Printer-friendly Version Interactive Discussion
Discussion
P
a
per
|
Dis
cussion
P
a
per
|
Discussion
P
a
per
|
Discussio
n
P
a
per
|
0 100 200 300 400 500 600 700
0 5 10 15 20 25 30 35
1 2 3 4 5 6 7 8 9 10 11 12
0 100 200 300 400 500 600 700
0 5 10 15 20 25 30 35
1 2 3 4 5 6 7 8 9 10 11 12
(a)
(b)
(a) DEF
(b) RF, OPP
P
re
ci
pi
ta
ti
on (m
m
)
A
ir t
em
pe
ra
ture
(
o
C)
Month
Month
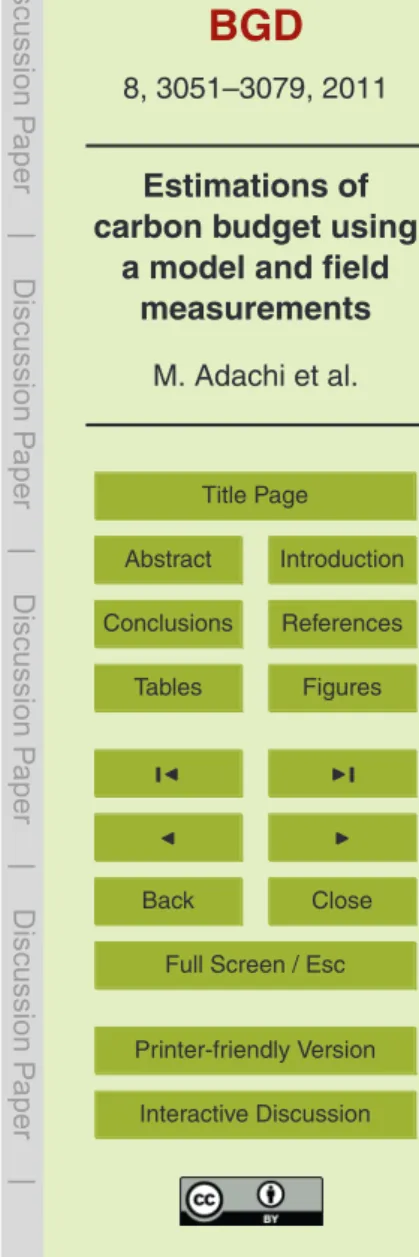
Fig. 1.Locations map of the dry evergreen forest (DEF) in Thailand and the rainforest (RF) and
the oil palm plantation (OPP) in Peninsular Malaysia. Climate data for(a)the DEF (2001–2003;
from the AsiaFlux Database) and(b)the RF (1991–1997; from Manokaran et al. 2004). Solid
BGD
8, 3051–3079, 2011Estimations of carbon budget using
a model and field measurements
M. Adachi et al.
Title Page
Abstract Introduction
Conclusions References
Tables Figures
◭ ◮
◭ ◮
Back Close
Full Screen / Esc
Printer-friendly Version Interactive Discussion
Discussion
P
a
per
|
Dis
cussion
P
a
per
|
Discussion
P
a
per
|
Discussio
n
P
a
per
|
(a)
(b)
T
em
pe
ra
ture
(
oC)
P
re
ci
pi
ta
ti
on (m
m
)
Year
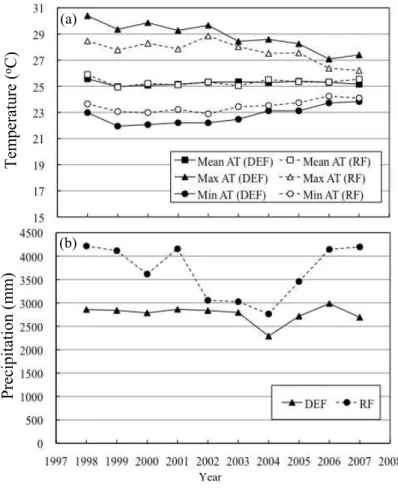
Fig. 2. (a)Annual mean, maximum and minimum air temperatures and(b)annual mean
BGD
8, 3051–3079, 2011Estimations of carbon budget using
a model and field measurements
M. Adachi et al.
Title Page Abstract Introduction Conclusions References Tables Figures ◭ ◮ ◭ ◮ Back Close
Full Screen / Esc
Printer-friendly Version Interactive Discussion Discussion P a per | Dis cussion P a per | Discussion P a per | Discussio n P a per |
(b) Carbon stock in RF (a) Carbon stock in DEF
-5 -4 -3 -2 -1 0 1 2 3 4 5
2002 2003 2004 2005 2006
-5 -4 -3 -2 -1 0 1 2 3 4 5
2002 2003 2004 2005 2006 (c) NEP in DEF
(d) NEP in RF
0 1 2 3 4 5 6 7 8
2002 2003 2004 2005 2006
0 1 2 3 4 5 6 7 8
2002 2003 2004 2005 2006
(e) SR in DEF
(f) SR in RF
Ca
rbon s
toc
k ( t
C ha
-1 yr -1) S oi l re spi ra ti
on ( g C m
-2 da
y -1) N et e cos ys te m produc ti
on (g C m
-2 da
y
-1)
Year Year Year
Fig. 3. Temporal variations in(a, b)carbon stock, (c, d)net ecosystem production (NEP) and
(e, f)soil respiration (SR) in dry evergreen forest (DEF) in Thailand (top) and the rainforest (RF)
BGD
8, 3051–3079, 2011Estimations of carbon budget using
a model and field measurements
M. Adachi et al.
Title Page
Abstract Introduction
Conclusions References
Tables Figures
◭ ◮
◭ ◮
Back Close
Full Screen / Esc
Printer-friendly Version Interactive Discussion
Discussion
P
a
per
|
Dis
cussion
P
a
per
|
Discussion
P
a
per
|
Discussio
n
P
a
per
|
0 50 100 150 200 250 300 350
1948 1952 1956 1960 1964 1968 1972 1976 1980 1984 1988 1992 1996 2000 2004 2008
Ca
rbon s
toc
k ( t
C ha
-1 yr -1)
Aboveground biomass
Belowground biomass
Litter
Humus
Residual debris
Tree biomass
under the canopy
A
nnua
l c
arbon fl
ux ( t
C ha
-1 yr -1)
-30 -20 -10 0 10 20 30 40
1948 1952 1956 1960 1964 1968 1972 1976 1980 1984 1988 1992 1996 2000 2004 2008
GPP
SR
NEP
(a)
(b)
Year
Fig. 4. Temporal variation in C stock(a)and C flux(b)within the rainforest (RF) during 1948–
BGD
8, 3051–3079, 2011Estimations of carbon budget using
a model and field measurements
M. Adachi et al.
Title Page
Abstract Introduction
Conclusions References
Tables Figures
◭ ◮
◭ ◮
Back Close
Full Screen / Esc
Printer-friendly Version Interactive Discussion
Discussion
P
a
per
|
Dis
cussion
P
a
per
|
Discussion
P
a
per
|
Discussio
n
P
a
per
|
Year
Forest
Oil palm
D
ai
ly s
oi
l re
spi
ra
ti
on ra
te
( g C m
-2 da
y
-1)
2003 2004 2005 2006 2007 2008
S
oi
l w
at
er c
ont
ent
at
0-30c
m
de
pt
h (%)
(a)
(b)
VISIT (RF)
VISIT (DEF)
Field data (RF)
Fig. 5. Comparisons of the VISIT model simulation and field measurements of(a)soil
respi-ration rates (SR) in the rainforest (RF) and oil palm plantation (OPP) from 2000 to 2004 and
(b)daily mean soil water content at 0 to 30 cm depth in RF from 2003 to 2008. In(a), model
simulation for RF (bold line), model simulation for OPP (gray line), observed mean SR in RF (filled circles), observed mean SR in OPP (open circles); error bars show the standard
devia-tion (n=16). See Adachi and Koizumi (2009) for field measurements. In(b), field observation
BGD
8, 3051–3079, 2011Estimations of carbon budget using
a model and field measurements
M. Adachi et al.
Title Page
Abstract Introduction
Conclusions References
Tables Figures
◭ ◮
◭ ◮
Back Close
Full Screen / Esc
Printer-friendly Version Interactive Discussion
Discussion
P
a
per
|
Dis
cussion
P
a
per
|
Discussion
P
a
per
|
Discussio
n
P
a
per
|
(a) DEF
(b) RF
G
P
P
(g C ha
-1
da
y
-1)
2003 2004 2005
(c) OPP
Fig. 6. Seasonal variations in gross primary production (GPP) based on satellite observations
(Aqua and Terra MODIS values) and the VISIT model simulation in(a)the dry evergreen forest
(DEF) in Thailand, and(b)the rainforest (RF) in Malaysia, and(c)the oil palm plantation (OPP)