ISSN 0976-2612, Online ISSN 2278–599X, Vol-7, Special Issue4-May, 2016, pp222-228
http://www.bipublication.com
Research Article
The Comparison of Central Obesity among Fars-native, Turkman and
Sisstanish Ethnic Groups in the north of Iran
Gholamreza Veghari1, Mehdi Sedaghat2, Samieh Banihashem2, Pooneh Moharloei2, Abdolhamid Angizeh2,Ebrahim Tazik2
and Abbas Moghaddami2
1Ischemic Disorders Research Center, 2 Deputy of Health ,
Golestan University of Medical Sciences, Gorgan, Iran
ABSTRACT
Background and Objectives: Central obesity is a major health problem in worldwide and whether differences of it in three great ethnic groups among adults in the north of Iran are the main aim of this study. Material and Methods: We established a cross-sectional and analytical study with a sample of 2993 cases with equal age and sex and with three ethnic proportion (Fars-native=1627, Turkamn=974 and Sisstani=392) of urban and rural area population aged 15-65 years living in 11 districts in Golestan province in northern Iran. We conducted a multistage cluster sampling techniques by 150 clusters with equal size of 20 subjects. Central obesity was defined after WHO classification by waist circumference (WC) ≥102 cm and ≥88 cm in men and women, respectively. SPSS 18.0 software was used for the statistical analysis and P-value under 0.05 estimated significations. Results: The mean of WC in Fars-native, Turkman and Sisstani was 88.88±15.83 cm, 89.11±14.12 cm and 84.41±13.74 cm, respectively. Central obesity was common in 35.1% of subjects and significantly was more in women (54.5%) than men (15.7%). (P=0.001).Also, it was prevalent 36.9%, 34.9% and 27.6% in Fars-native, Turkman and Sisstani, respectively. Statistical differences was significant among three ethnic groups (P=0.002). The logistic regresion analysis showed that the risk of central obesity in Fars-native was 1.450 [1.208-1.965] and in Turkman was 1.410 [1.090-1.825] compared to Sisstanish ethnic group. (95% CI). Conclusion: At least one-third of adults in the north of Iran suffer from central obesity and alarming rate was shown in women. Among three ethnic groups, the highest and the lowest rates were seen in Fars-native and Sisstanish ethnic groups, respectively. Variation of central obesity among three ethnic groups should be considered in future studies.
Keywords: Central obesity, Adults, Ethnic group, Iran
INTRODUCTION
According to the World Health Organization report, the obesity is rising in the world1 and it is well known as a health problem in Iran.2,3Central obesity was common 9.7%-12.9% and 54.5%- 63.7% in Iranian men and women, respectively4,5 and it is a major health problem in northern Iran.6 Waist circumference (WC) using for central obesity classification7 known as a risk factor for cardiovascular disease, stroke and type 2 diabetes.8
socio-demographic factors and central obesity was shown in some regions.14 The role of educational level as a multifaceted concept well known in some of the social and cognitive skills that learned through formal education processes; reading and numeracy.16
Of 1.7 million people in Golestan province (north of Iran and south east of Caspian sea), 66.39% are 15-65 year old and 43.9% live in urban areas. Many ethnic groups were living in this area including Fars-native, Turkman and Sisstani. The main job in villages is agriculture.17
The aim of this study was to evaluate whether prevalence of central obesity in three major ethnic groups (Fars-native, Turkman and Sisstani) is different in Iranian northern adults in 2010.
MATERIAL AND METHODS:
We established a cross-sectional and analytical study with a sample of 2993 cases with equal age and sex and with three ethnic proportion (Fars-native=1627, Turkamn=974 and Sisstani=392) of urban and rural area population aged 15-65 years living in 11 districts in Golestan province in northern Iran. With resumption of 50% obesity rate;3 a confidence level of 95% and a maximum marginal error about 0.02, the sample size was calculated 2401 subjects. For more efficiency the sample size raised up 2993 subjects. We conducted a multistage cluster sampling techniques by 150 clusters with equal size of 20 subjects. In the first stage, the clusters were chosen randomly using systematic sampling technique based on postal code in urban areas and family health number in Primary Health Centers in rural areas. In the second stage, we randomly selected 20 subjects in each cluster. All family members in blocks (a complex of building) who were in 15-65 years were included in our study. Waist circumference was measured to the nearest 0.5 cm at the superior border of the iliac crest. Central obesity was defined after WHO classification18: waist circumference ≥102 cm and
≥88 cm in men and women, respectively.
Economic status, with regard to Iranian
social-economic, was categorized based on the six facilities item, the same as, separate freezer, separate kitchen, vacuum cleaner, computer, separate bathroom, and washing machine with equal score for each of them. According to this list, the scoring of the economic status in this study was as follows: poor ≤ 2 score; intermediate = 3-4 score; and good ≥ 5 score. Educational level classified in four groups: Uneducated (unable reading or writing a phrase); 0-12 years schooling and College.
Quantitative and qualitative data values are presented as mean± standard deviation and frequently (%), respectively. SPSS 18.0 software was used for the statistical analysis. ANOVA and post-hoc Tukey test were used to compare the means. Multiple logistic regression analysis was applied to estimate the odds ratio (OR) of central obesity in ethnic groups according to the gender.P-value under 0.05 estimated significations. This study approved by Ethical Research Committee and consent was received from all participants. Pregnant women and those who were unwilling to participate in this study were excluded.
RESULTS:
The characteristic of subjects present in table 1. Distribution of location area (urban/rural), economic status, educational level among three ethnic groups are statistically significant.(P=0.001). Poor economic status and uneducated level were shown in Sisstanish ethnic people more than others.
and Sisstani (P=0.001) and in whole (P=0.001). Table2.
Generally, central obesity was common in 35.1% of subjects (15.7% in men and 54.5% in women) and statistically differences was significant between genders (P=0.001). Central obesity was prevalent 36.9%, 34.9% and 27.6% in Fars-native, Turkman and Sisstani, respectively. Statistical differences was significant among three ethnic groups as whole (P=0.002) and based on men (P=0.001), while in women was not significant (P=0.190). In men, between Fars-native (17.8%) and Turkman (16.2%) was not shown a statistical significant differences. Whoever, the odds ratios were not significant when adjusted by location area, economic status, educational level and age groups. Table 3.
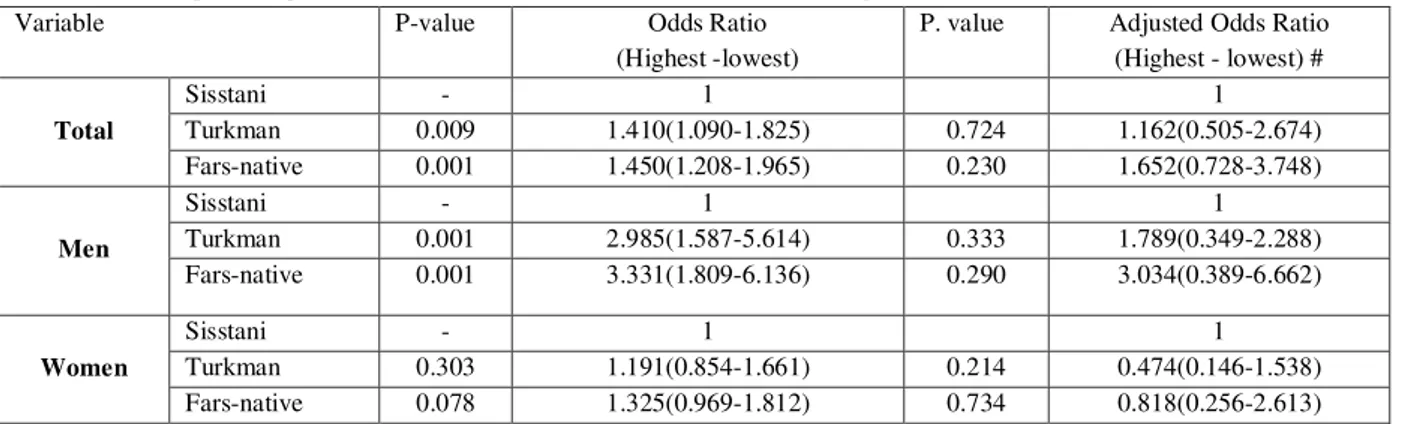
In generally, the results of multiple logistic regresion analysis showed that the risk of central obesity in Fars-native was 1.450 [1.208-1.965] and in Turkman was 1.410 [1.090-1.825] compared to Sisstanish ethnic group. In men the risk of central obesity in Fars-native was 3.331 [1.809-6.136] and in Turkman was 1.410 [1.587-5.614] compared to Sisstanish ethnic group.In women, the risk of central obesity in Fars-native was 1.325 [0.969-1.812] and in Turkman was 0.303 [0.854-1.661] compared to Sisstanish ethnic group. (95% CI for all). Table 4.
DISCUSSION:
In present study the prevalence of central obesity was 35.1% with a more common in women and unequal among three ethnic groups.
Central obesity as a health problem was reported in some studies in Iran. The prevalence of central obesity in Gorgan (northern Iran) was 39.1%,10 in Ahvaz (south of Iran) was 21.2%,19 and in whole of Iran was 9.7%.5 In a comprehensive study in Iran, the prevalence of central obesity was reported 9.7%-12.9% and 54.5%-63.7% in adult men and women, respectively.4 The prevalence of central obesity has been observed 36% in Spanish adults,20 24.1% in Egypt,21 35% in Canadian adult people22 and 31.5% and 64.4% in Omanian male
and female, respectively.23 Compared with above studies, the prevalence of central obesity in northern Iran was high and there is necessary a control program for it. We showed, the central obesity in women more than men as like as other studies.6,24
rates of obesity. Veghari 34 believed that nutritional status in Turkman children is better than Sisstanish ethnic group in northern Iran and the prevalence of central obesity in Sisstanish women was lower than other ethnic groups in this area.10 Sisstanish ethnic group has been immigrated from east to north of Iran during last decades and socio-economic indexes of them are low. Men mainly doing physical work and women mostly are housewife. It seems, the role of behavioral factors more than others influence on central obesity in this group because differences mostly were shown in men. More studies are necessary for considering the reasons of low prevalence of central obesity in Sisstanish ethnic groups.
In our results, the pattern of central obesity among three ethnic groups based on genders was not similar. Despite in women odds ratio was not significant as whole but, in men it was strongly in Sisstani lower than in Fars-native and in Turkman ethnic groups. Food behavior differences in genders have been reported in other studies. In Alabama, the role of culture and tradition in weight management and limited access to fresh fruits and vegetables and low level of physical activity emphasize in Latino immigrant women.14 In US, Latino women more than other affected by obesity27 and non-Hispanic black women are more satisfied with their body size than non- Hispanic white women; persons who are satisfied with their body size are less likely to try to less weight.35 In our study, difference in men, in contrary women and why the gender difference in Sisstani is greater than the others are not clear. Probably, environmental and behavioral factors in each of ethnic groups are different and it should be consider in future studies.
CONCLUSION: Iran is considered to be a country in nutrition transition phase and life style and food behavior have been changed in recent years36 and as like as other developing countries, central obesity is a health problem in Iran. We founded that over one to three of Iranian northern
adults suffer from central obesity and alarming rate was shown in women. Among three ethnic groups, the highest and the lowest rates were seen in Fars-native and Sisstanish ethnic groups, respectively. Unlike women, the central obesity in men’s three ethnic groups was significant and difference in gender in Sisstani is greater than the others.
ACKNOWLEDGMENT: The researchers would like to thank the medical and administrative staff in the Primary Health Care Centers of Golestan University of Medical Sciences for their valuable assistance during the field work. This study created from provincial incommunicable data study and supported by Health Office of Golestan University of Medical Sciences and based on 416183 official documents was justified for publication.
REFERENCES:
1. World Health Organization. Obesity: Preventing and managing the global epidemic. World Health Organization.1998; Geneva. 2. Rashidi A ,Mohammadpour -Ahranjani B,
Vafa MR. and Karandish M. Prevalence of obesity in Iran. Obes Rev 2005; 6(3):191-2. 3. Malekzadeh R, Mohamadnejad M, Merat S,
Pourshams A, Etemadi A.Obesity pandemic: An Iranian Perspective..Archives of Iranian Medicine,2005; 8(1):1–7.
4. Janghorbani M, Amini M, Willett WC, Mehdi Gouya M, Delavari A, Alikhani S, et al. First nationwide survey of prevalence of overweight, underweight, and central obesity in Iranian adults. Obesity (Silver Spring) 2007;15(11):2797-808.
5. Kelishadi R, Alikhani S, Delavari A, Alaedini F, Safaie A, Hojatzadeh E: Obesity and associated lifestyle behaviours in Iran: findings from the First National Non-communicable Disease Risk Factor Surveillance Survey. Public Health Nutr 2008, 11:246-251.
6. Veghari G, Sedaghat M, Joshaghani H, Hoseini A, Niknajad F, Angizeh A, et al. The
7. Licata G, Argano C, Di chiara T,Parrinello G and Scaglione R. Obesity: a main factor of metabolic syndrome? Panminerva Med 2006; 48(2):77-85.
8. Folsom AR, Stevens J, Schreiner PJ,Mc- Govern PG, for the Atherosclerosis Risk in Communities Study Investigators Body mass index, waist/hip ratio, and coronary heart disease incidence in African Americans and Whites. Am J Epidemiol 1998;148: 1187– 1194.
9. Deurenberg P, Yap M, Van Staveren WA.
Body mass index and percent body fat: a meta analysis among different ethnic groups. Int. J.
Obes1998; 22: 1164–71.
10.Veghari G.R., Mansourian AR. Obesity Among Mothers In Rural Golestan-Iran ( southeast of Caspian sea). Iranian J Publ Health 2007;36(3):71-76.
11. Martinez J, Powell J, Agne A, Scarinci I, Cherrington A. A Focus Group Study of Mexican Immigrant Men's Perceptions of Weight and Lifestyle. Public Health Nurs 2012 Nov;29(6):490-8.
12. Centers for Disease Control and Prevention (CDC). Differences in prevalence of obesity among black, white, and Hispanic adults - United States, 2006-2008. MMWR Morb Mortal Wkly Rep 2009 Jul 17;58(27):740-4.
13.Davidson M, Knafl KA. Dimensional analysis of the concept of obesity. J Adv Nurs. 2006;54:342–50.
14. Agne AA, Daubert R, Munoz ML, Scarinci I, Cherrington AL. The Cultural Context of Obesity: Exploring Perceptions of Obesity and Weight Loss Among atinaImmigrants. J Immigr Minor Health. 2011 Dec 1. [Epub ahead of print]
15.McCarthy HD, Jarrett KV, Emmett PM, Rogers I. Central overweight and obesity in British youth aged 11–16 years: cross-sectional surveys of waist circumference. BMJ 2005; 326: 624–626.
16.Baker DW. The meaning and the measure of health literacy. J Gen Intern Med 2006;21:878– 83.
17. Statistical Center of Iran .Population and Housing Census. Available from [http://www.sci.org.ir].
18.World Health Organization. Obesity: Prevention and Managing the Global Epidemic. WHO Obesity Technical Reports Series 894. WHO, Geneva, Switzerland, 2000. 19. Amani R. Comparison between
bioelectrical impedance analysis and body mass index methods in determination of obesity prevalence in Ahvazi women. Eur J Clin Nutr 2007;61(4):478-82.
20. Gutiérrez-Fisac JL, Guallar-Castillón P, León-Muñoz LM, Graciani A, Banegas JR, Rodríguez-Artalejo F. Prevalence of general and abdominal obesity in the adult population of Spain,2008-2010: the ENRICA study. Obes Rev 2012 Apr;13(4):388-92.
21.Al-Riyami AA, Afifi MM. Prevalence and correlates of obesity and central obesity in Omani Adults. Saudi Med J 2003; 24(6): 641– 646.
22. Riediger ND, Clara I. Prevalence of metabolic syndrome in the Canadian adult population. CMAJ 2011 ;183(15):E1127-34. 23. Abolfotouh MA, Soliman LA,
Mansour E, Farghaly M, El-Dawaiaty AA.Central obesity among adults in Egypt: prevalence and associated morbidity. East Mediterr Health J 2008;14(1):57-68.
24.Gholamreza Veghari, Mehdi Sedaghat, Samieh Banihashem, Pooneh Moharloei, Abdolhamid Angizeh, Ebrahim Tazik, Abbas Moghaddami. Trends in Waist Circumference and Central Obesity in Adults, Northern Iran. Oman Medical Journal 2012; 27(1): 50-53.
25. Ganz ML. Family health effects: complements or substitutes. Health Econ 2001;10(8):699-714.
26. Freedman DS, Khan LK, Serdula MK, Ogden CL, Dietz WH. Racial and ethnic differences in secular trends for childhood BMI, weight, and height. Obesity (Silver Spring) 2006;14(2):301-8.
27. Flegal KM, Carroll MD, Ogden CL, Curtin LR. Prevalence and trends in obesity among US adults, 1999-2008. JAMA 2010 Jan 20;303(3):235-41.
29. Rush EC, Puniani K, Valencia ME, Davies PS, Plank LD. Estimation of body fatness from body mass index and bioelectrical impedance: comparison of New Zealand European, Maori and Pacific Island children. Eur J Clin Nutr 2003;57(11):1394-401. 30. Fredriks AM, van Buuren S, Jeurissen
SE, Dekker FW, Verloove-Vanhorick SP, Wit JM. Height, weight, body mass index and pubertal development references for children of Moroccan origin in The Netherlands. Acta Paediatr 2004;93(6):817-24.
31.Adler NE, Stewart J. Reducing obesity: motivating action while not blaming the victim. Milbank Q 2009;87:49--70.
32.Maddock J. The relationship between obesity and the prevalence of fast food restaurants:
state-level analysis. Am J Health Promot 2004;19:137–43.
33.Perez-Escamilla R. Acculturation, nutrition, and health disparities in Latinos. Am J Clin Nutr. 2011:1163S–7S.
34.Veghari G.,Golalipour M. The Comparison of Nutritional Status Between Turkman and Non-Tutkman Ethnic Groups in North of IRAN. Journal of Applied Sciences 2007; 7(18):2635-2640.
35.Millstein RA, Carlson SA, Fulton JE, et al. Relationships between body satisfaction and weight control practices among US adults. Medscape J Med 2008;10:119.
36. Ghassemi H, Harrison G, Mohammad K. An accelerated nutrition transition in Iran. Public Health Nutr 2002;5(1A):149-55. Table 1: Demographics distribution of subjects .
Variable
Fars-native(1627) N(%)
TUrkman(974) N(%)
Sisstani(392) N(%)
Total (2993)
N(%) P. Value
Location area
Urban 830(51.0) 310(31.8) 43(11.0) 1182(39.5)
0.001
Rural 797(49.0) 664(68.2) 349(89.0) 1811(60.5)
Age group (year)
15-40 815(50.1) 490(50.2) 207(52.8) 1512(50.5)
0.619
40-65 812(49.9) 484(49.7) 185(47.2) 1481(49.5)
Economic status
Poor 257(15.9) 151(15.5) 201(51.3) 673(22.5)
0.001#
Moderate 639(39.3) 505(51.8) 160(40.8) 1329(44.4)
Good 731(44.8) 318(32.7) 31(7.9) 991(33.1)
Educational level
Uneducated 376(23.1) 310(31.8) 150(38.2) 790(26.4)
0.001## 0-12 year
schooling 730(44.9) 508(52.2) 196(50.0) 1419(47.4)
College 521(31.9) 156(16) 46(11.8) 784(26.2)
Sex Men 816(50.2) 487(50) 197(50.3) 1500(50.1) 0.995
Women 811(49.8) 487(50) 195(49.7) 1493(49.9)
# Poor status compared among three ethnic groups.
## Uneducated status has been compared among three ethnic groups.
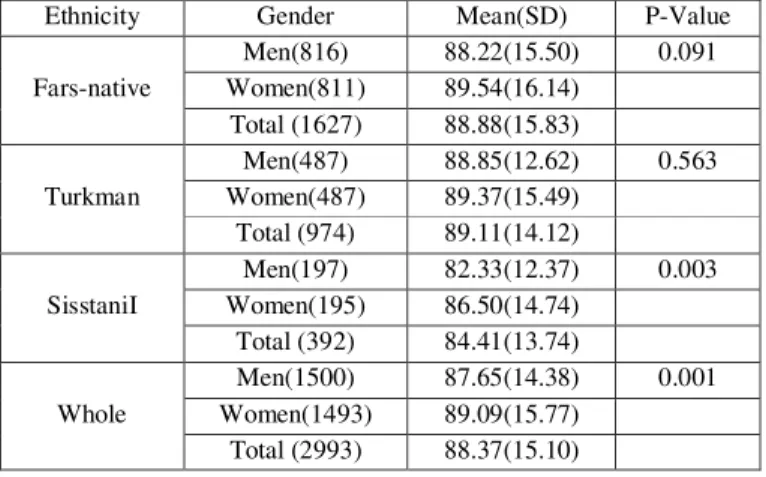
Table 2. The mean and SD of waist circumference among three ethnic groups based on gender
Ethnicity Gender Mean(SD) P-Value
Fars-native
Men(816) 88.22(15.50) 0.091 Women(811) 89.54(16.14)
Total (1627) 88.88(15.83)
Turkman
Men(487) 88.85(12.62) 0.563 Women(487) 89.37(15.49)
Total (974) 89.11(14.12)
SisstaniI
Men(197) 82.33(12.37) 0.003 Women(195) 86.50(14.74)
Total (392) 84.41(13.74)
Whole
Men(1500) 87.65(14.38) 0.001 Women(1493) 89.09(15.77)
T.test between Fars-native and Turkman in men (P=0.450), women (P=0.848) and in whole (P=0.711) is not significant.
T.test between Fars-native and Sisstani in men (P=0.001), women (P=0.016) and in whole (P=0.001) is significant.
T.test between Turkman and Sisstani in men (P=0.001), women (P=0.027) and in whole (P=0.001) is significant.
ANOVA among three ethnic groups in men (0.001), in women (0.048 ) and in whole (0.001) is significant.
Table 3: The comparison of central obesity among three ethnic groups based on gender
Ethnicity Gender Central Obesity P.
Value
No Yes
Fars-native
Men(816) 671(82.2) 145(17.8)
0.001 Women(811) 355(43.8) 456(56.2)
Total (1627) 1026(63.1) 601(36.9)
Turkman
Men(487) 408(83.8) 79(16.2)
0.001 Women(487) 226(46.4) 261(53.6)
Total (974) 634(65.1) 340(34.9)
Sisstani
Men(197) 185(93.9) 12(6.1)
0.001
Women(195) 99(50.8) 96(49.2)
Total (392) 284(72.4) 108(27.6)
Whole
Men(1500) 1264(84.3) 236(15.7)
0.001 Women(1493) 680(45.5) 813(54.5)
Total (2993) 1944(64.9) 1049(35.1)
Chi-2 between Fars-native and Turkman in men (P=0.473), women (P=0.356) and in whole (P=0.158) is not significant.
Chi-2 between Fars-native and Sisstani in men (P=0.001) and in whole (P=0.001) is significant but in women is not significant (P=0.078).
Chi-2 between Turkman and Sisstani in men (P=0.001) and in whole (P=0.005) is significant but in women is not significant (P=0.303).
ANOVA among three ethnic groups in men (P=0.001) and in whole (P=0.002) is significant but in women is not (P=0.190).
Table 4: Logistic regression estimate the odds Ratio of Central obesity in the north of Iran (95% CI)
Adjusted Odds Ratio (Highest - lowest) # P. value
Odds Ratio (Highest -lowest) P-value
Variable
1 1
- Sisstani
Total Turkman 0.009 1.410(1.090-1.825) 0.724 1.162(0.505-2.674)
1.652(0.728-3.748) 0.230
1.450(1.208-1.965) 0.001
Fars-native
1 1
- Sisstani
Men Turkman 0.001 2.985(1.587-5.614) 0.333 1.789(0.349-2.288)
3.034(0.389-6.662) 0.290
3.331(1.809-6.136) 0.001
Fars-native
1 1
- Sisstani
Women Turkman 0.303 1.191(0.854-1.661) 0.214 0.474(0.146-1.538)
0.818(0.256-2.613) 0.734
1.325(0.969-1.812) 0.078
Fars-native