Biochemical, anthropometric and body composition indicators as
predictors of hepatic steatosis in obese adolescents
Indicadores bioquímicos, antropométricos e de composição corporal como preditores da esteatose hepática em adolescentes obesos
Indicadores bioquímicos, antropométricos y de composición corporal como predictores de la esteatosis hepática en adolescentes obesos
Amanda Oliva Gobato1, Ana Carolina J. Vasques1, Roberto Massao Yamada1, Mariana Porto Zambon1,
Antonio de Azevedo Barros-Filho1, Gabriel Hessel1
Instituição: Departamento de Pediatria da Faculdade de Ciências Médicas da Universidade Estadual de Campinas (Unicamp), Campinas, SP, Brasil
1Faculdade de Ciências Médicas da Unicamp, Campinas, SP, Brasil
ABSTRACT
Objective: To describe the prevalence of hepatic steatosis and to assess the performance of biochemical, anthropomet-ric and body composition indicators for hepatic steatosis in obese teenagers.
Methods: Cross-sectional study including 79 adolecents aged from ten to 18 years old. Hepatic steatosis was diagnosed by abdominal ultrasound in case of moderate or intense hepa-torenal contrast and/or a difference in the histogram ≥7 on the right kidney cortex. The insulin resistance was determined by the Homeostasis Model Assessment–Insulin Resistance (HOMA-IR) index for values >3.16. Anthropometric and body composition indicators consisted of body mass index, body fat percentage, abdominal circumference and subcu-taneous fat. Fasting glycemia and insulin, lipid profile and hepatic enzymes, such as aspartate aminotransferase, alanine aminotransferase, gamma-glutamyltransferase and alkaline phosphatase, were also evaluated. In order to assess the perfor-mance of these indicators in the diagnosis of hepatic steatosis in teenagers, a ROC curve analysis was applied.
Results: Hepatic steatosis was found in 20% of the patients and insulin resistance, in 29%. Gamma-glutamyltrans-ferase and HOMA-IR were good indicators for predicting hepatic steatosis, with a cutoff of 1.06 times above the
refer-ence value for gamma-glutamyltransferase and 3.28 times for the HOMA-IR. The anthropometric indicators, the body fat percentage, the lipid profile, the glycemia and the aspartate aminotransferase did not present significant associations.
Conclusions: Patients with high gamma-glutamyl-transferase level and/or HOMA-IR should be submitted to abdominal ultrasound examination due to the increased chance of having hepatic steatosis.
Key-words: fatty liver; obesity; adolescent; enzymes.
RESUMO
Objetivo: Descrever a prevalência da esteatose hepática e avaliar o desempenho de indicadores bioquímicos, antropo-métricos e de composição corporal para identificar a doença em adolescentes obesos.
Métodos: Estudo transversal com 79 adolescentes de dez a 18 anos. Diagnosticou-se a esteatose hepática por ultrassom abdominal em caso de contraste hepatorrenal moderado ou in-tenso e/ou diferença no histograma ≥7 em relação ao córtex do rim direito. Determinou-se a resistência à insulina pelo índice
Homeostasis Model Assessment–Insulin Resistance (HOMA-IR) para valores >3,16. Os indicadores antropométricos e de composição corporal foram: índice de massa corpórea, porcentagem de
gor-Endereço para correspondência: Amanda Oliva Gobato
Estrada do Jequitibá, 1.750, casa 117, Condomínio Moinho de Vento – Veneza
CEP 13274-610 – Valinhos/SP
E-mail: [email protected]
Fonte financiadora: Fundo de Apoio ao Ensino, à Pesquisa e à Extensão (Faepex) – processos nº 146365-11, 57256-11 e 57257-11
Conflito de interesse: nada a declarar
dura corporal, circunferência abdominal e gordura subcutânea. Dosaram-se glicemia e insulina de jejum, perfil lipídico e enzimas hepáticas aspartato aminotransferase, alanina aminotransferase, gama-glutamiltransferase e fosfatase alcalina. Aplicou-se a curva ROC para avaliar o desempenho dos indicadores para identificar adolescentes com esteatose hepática.
Resultados: A esteatose hepática esteve presente em 20% dos pacientes e a resistência à insulina, em 29%. A gama-glutamiltransferase e o HOMA-IR mostraram-se bons indicadores para predizer a esteatose hepática, com ponto de corte de 1,06 vezes acima do valor de referência para a gama-glutamiltransferase e de 3,28 para o HOMA-IR. Os indicadores antropométricos, a porcentagem de gordura corporal, o perfil lipídico, a glicemia e a aspartato amino-transferase não apresentaram diferenças significantes.
Conclusões: Pacientes com elevação de gama-glutamil-transferase e/ou HOMA-IR devem ser submetidos ao exame de ultrassom abdominal, havendo grande probabilidade de se obter como resultado a esteatose hepática.
Palavras-chave: fígado gorduroso; obesidade; adolescente; enzimas.
RESUMEN
Objetivo: Describir la prevalencia de la esteatosis he-pática y evaluar el desempeño de indicadores bioquímicos, antropométricos y de composición corporal para identificar la enfermedad en adolescentes obesos.
Métodos: Estudio transversal con 79 adolescentes de 10 a 18 años. Se diagnosticó la esteatosis hepática por ultrasonido abdo-minal en caso de contraste hepatorrenal moderado o intenso y/o diferencia en el histograma ≥7 con relación al córtex del riñón derecho. Se determinó la resistencia a la insulina por el índice
Homeostasis Model Assessment-Insulin Resistence (HOMA-IR) para valores >3,16. Los indicadores antropométricos y de composi-ción corporal fueron índice de masa corporal, porcentaje de grasa corporal, circunferencia abdominal y grasa subcutánea. Se dosifi-caron glucemia e insulina en ayuno, perfil lipídico y las encimas hepáticas aspartato aminotransferasa, alanina aminotransferasa, gama-glutamiltransferasa y fosfatasa alcalina. Se analizaron curvas ROC para evaluar el desempeño de los indicadores en identificar adolescentes con esteatosis hepática.
Resultados: La esteatosis hepática estuvo presente en el 20% de los pacientes y la resistencia a la insulina, en el 29%. La gama-glutamiltransferasa y el HOMA-IR se mostraron buenos indicadores para predecir la esteatosis hepática, con punto de corte de 1,06 veces por encima del valor de
referencia para la gama-glutamiltransferasa y de 3,28 para el HOMA-IR. Los indicadores antropométricos, el porcentaje de grasa corporal, el perfil lipídico, la glucemia y la aspartato aminotransferasa no presentaron diferencias significantes.
Conclusiones: Pacientes con elevación de gama-glutamil-transferasa y/o HOMA-IR deben ser sometidos al examen de ultrasonido abdominal con gran probabilidad de obtenerse como resultado la esteatosis hepática.
Palabras clave: hígado grasoso; obesidad; adolescente; encimas.
Introduction
The non-alcoholic fatty liver disease (NAFLD) is a clini-copathological condition characterized by lipid accumulation inside the hepatocytes, whose spectrum of presentation rang-es from a simple fatty iniltration of liver (steatosis), through the establishment of an inlammation (steatohepatisis), to ibrosis and hepatic cirrhosis. The pathologic condition is similar to that of the alcohol-induced lesion, but it occurs in individuals without signiicant alcohol consumption(1).
NAFLD occurs mainly in obese individuals and it is an increas-ing problem in children and adolescents, given the increasincreas-ing prevalence of childhood obesity. The hepatic steatosis (HS) with onset in childhood and adolescence deserves special attention be-cause most patients are asymptomatic and the evolution is silent(2).
The gold standard for the diagnosis of NAFLD is liver bi-opsy; however, due to the dificulty of implementation and the risk of complications, indirect methods such as imaging and laboratory exams associated to the history and clinical exami-nation, have been widely used in children and adolescents(3).
The dificulty to diagnose coupled with the small number of studies available makes the prevalence of HS still poorly known in the pediatric age group. HS seems to be primarily associated with obesity and insulin resistance (IR). With the signiicant increase in the prevalence of obesity in children and adolescents and the direct relationship of this nutritional disorder with the develop-ment of HS, the present study aimed to describe the prevalence of HS diagnosed by abdominal ultrasonography and to evaluate the performance of biochemical, anthropometric, and body composition indicators in identifying HS in obese adolescents.
Method
treated from April 2011 to May 2012 who presented body mass index (BMI) ≥P97 for age and sex, according to the charts of the Word Health Organization (WHO(4), were invited to
participate in the research. We analyzed the clinical, laboratory, and ultrasonography characteristics of 79 patients of both sexes, from 10 to 18 years old, who were diagnosed with obesity and whose parents signed an informed consent form (ICF).
Anthropometric techniques for measuring weight and height were those recommended by Lohman et al(5). We calculated BMI
by the Quetelet index (BMI=weight/height2). Waist
circum-ference (WC) was measured in centimeters with tape measure (Sanny®), at the midpoint between the last rib and the superior
border of the iliac crest. The percentage of body fat (%BF) was measured by dual energy X-ray absorptiometry (DXA), with Hologic® appliance, Discovery QDR Series n. 1005-75.
Insulin resistance was diagnosed by Homeostasis Model Assessment-Insulin Resistance (HOMA-IR), which is the product of fasting insulin (mUI/mL) and fasting plasma glucose (mmol/L) divided by 22.5. Insulin Resistance was deined when the values were above 3.16(6).
We carried out the ultrasonography by a Toshiba device, Power Vision 6000, through sector transducers of 3.75MHz and 5MHz. All exams were performed by the same examiner, with the patient in supine position after fasting for 12 hours. The diagnosis of HS was considered in case of moderate or intense hepatorenal contrast and/or difference ≥7 on the histo-gram of the relationship right lobe/cortex of the right kidney(7).
Subcutaneous fat (SF) was measured by ultrasonography, with a 7.5MHz linear transducer. The transducer was positioned in the middle at 1cm above the navel line, without exerting any pressure on the abdomen, in order not to underestimate the measurement. SF was measured as the distance (cm) between the skin and the outer face of the fascia of the rectus abdominis muscles(8).
For laboratorial analysis of the biochemical exams, blood samples by venipuncture were collected in the morning after fast-ing for 12 hours. We analyzed fastfast-ing plasma glucose and lipid proile by enzymatic colorimetric; the measurement of aspartate aminotransferase (AST) and alanine aminotransferase (ALT) was performed by kinetic method ultraviolet (U.V.). For alkaline phosphatase (ALP) and gama-glutamil transferase (GGT), we used the colorimetric kinetic method, all with the Roche Di-agnostics® Laboratory Reagent Kit. For determination of basal
insulin, we used the reagents kit from the Siemens Healthcare Diagnostics® Laboratory by the method of chemiluminescence.
Furthermore, we calculated the fatty liver index (FLI), a simple predictor, which assesses the presence of HS in the general population, proposed by Bedogni et al(9) and validated
for the adult population.
FLI=(e0,953*log(TG)+0,139*IMC+0,718*log(GGT)+0,053*WC-15,745)/(1+e0,953*l og(TG)+0,139*IMC+0,718*log(GGT)+0,053*WC-15,745)*100, being WC: waist
circumference; GGT: gama-glutamil transferase; TG: tri-glycerides; log: logarithm; e: Euler. According to this index, it is considered HS when the value is ≥60.
We analyzed the data using the IBM Statistical Package for the Social Sciences (SPSS) version 20.0. The descriptive analysis of continuous variables included the calculation of means and their respective standard deviations; for cat-egorical variables, their percentage values were calculated. We used the Kolmogorov-Smirnov to assess the normal-ity of the distribution of studied variables. We used the Mann-Whitney test to compare two independent groups. The hypothesis of dependence between categorical variables was assessed using the chi-square or Fischer’s exact test, according to the expected frequencies. We calculated the values for Odds Ratio (OR) and their respective conidence intervals of 95% (95%CI) to assess the strength of depen-dence between categorical variables.
The analysis of ROC curves (Receiver Operating Character-istic Curve) was used to assess the performance of the anthro-pometric and biochemical indicators in identifying adolescents with HS. Given the difference of values of the hepatic enzymes according to age and sex in the analyzed adolescents, the values of these enzymes were transformed in number of times the up-per limit of normality (no x). That is, the result of the serum
concentration of the hepatic enzyme was divided by the number of the reference value according to age and sex. We considered the reference value for each sex and age range and divided the value found by the reference value. We used as reference the values preconized by Roche Diagnostics(10). The areas under
the ROC curves were calculated as proposed by Hanley and McNeil. We used a conidence interval of 95%. The sensibil-ity and speciicsensibil-ity values were calculated for all variables in the analysis of the ROC curves with signiicant results. The cutoff point with the highest sum of sensitivity and speciicity was chosen to optimize the relationship between these two param-eters, relecting greater accuracy in diagnosis.
TheKappa (k) test was used as a measure of agreement be-tween the ultrasound (US) and the FLI. The k value relects the degree of concordance between the methods. Values of k equal to 1 indicate perfect agreement between both methods and values equal to zero indicate no correlation between the tested methods.
The level of signiicance established as a basis for decision was lower than 5% (p<0.05) for all tests.
Results
We evaluated 79 patients, being 39 (49.4%) female and 40 (50.6%) male, aged between 10 and 18 years (mean 12.8), who attended the Child and Adolescent Obesity Outpatient Clinic of Hospital de Clínicas da Unicamp.
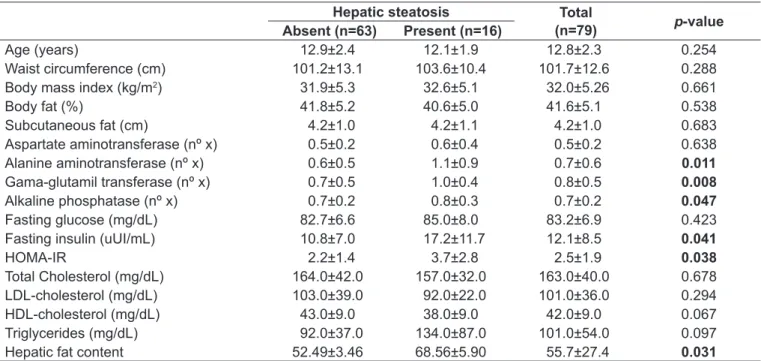
The HS diagnosed by abdominal ultrasonography was present in 16 patients (20.3%). The mean ALT, GGT, and ALP were signiicantly higher in patients with HS, as well
as the HOMA-IR index. Indicators of body composition and lipid proile showed no signiicantly different among the groups with and without HS (Table 1).
Among the patients assessed, 23 (29.1%) presented IR, being 13 (56.5%) females and 10 (43.5%) males. Of the pa-tients with diagnosis of IR, eight (34.8%) also had HS. The means for WC, BMI, SF and %BF were higher in patients who presented IR. Mean HDL-cholesterol was signiicantly lower in patients with IR (Table 2).
Hepatic steatosis Total
(n=79) p-value Absent (n=63) Present (n=16)
Age (years) 12.9±2.4 12.1±1.9 12.8±2.3 0.254
Waist circumference (cm) 101.2±13.1 103.6±10.4 101.7±12.6 0.288
Body mass index (kg/m2) 31.9±5.3 32.6±5.1 32.0±5.26 0.661
Body fat (%) 41.8±5.2 40.6±5.0 41.6±5.1 0.538
Subcutaneous fat (cm) 4.2±1.0 4.2±1.1 4.2±1.0 0.683
Aspartate aminotransferase (nº x) 0.5±0.2 0.6±0.4 0.5±0.2 0.638
Alanine aminotransferase (nº x) 0.6±0.5 1.1±0.9 0.7±0.6 0.011
Gama-glutamil transferase (nº x) 0.7±0.5 1.0±0.4 0.8±0.5 0.008
Alkaline phosphatase (nº x) 0.7±0.2 0.8±0.3 0.7±0.2 0.047
Fasting glucose (mg/dL) 82.7±6.6 85.0±8.0 83.2±6.9 0.423
Fasting insulin (uUI/mL) 10.8±7.0 17.2±11.7 12.1±8.5 0.041
HOMA-IR 2.2±1.4 3.7±2.8 2.5±1.9 0.038
Total Cholesterol (mg/dL) 164.0±42.0 157.0±32.0 163.0±40.0 0.678
LDL-cholesterol (mg/dL) 103.0±39.0 92.0±22.0 101.0±36.0 0.294
HDL-cholesterol (mg/dL) 43.0±9.0 38.0±9.0 42.0±9.0 0.067
Triglycerides (mg/dL) 92.0±37.0 134.0±87.0 101.0±54.0 0.097
Hepatic fat content 52.49±3.46 68.56±5.90 55.7±27.4 0.031
Table 1 - Clinical and laboratory characteristics of obese patients with and without hepatic steatosis. Values presented as means and standard deviation
Mann-Whitney test for all variables; no x: number of times the upper limit of normality according to age and sex; HOMA-IR: Homeostasis Model Assessment–Insulin Resistance
Insulin resistance
p-value Absent (n=56) Present (n=23)
Age (years) 12.81±2.46 12.84±2.14 0.750
Waist circumference (cm) 98.7±11.2 109.0±13.1 0.002
Body mass index (kg/m2) 30.67±4.61 35.39±5.33 0.001
Body fat (%) 40.3±5.1 44.7±3.6 0.001
Subcutaneous fat (cm) 4.03±0.97 4.84±1.15 0.003
Aspartate aminotransferase (nº x) 0.57±0.23 0.61±0.34 0.775
Alanine aminotransferase (nº x) 0.70±0.56 0.98±0.83 0.065
Gama-glutamyl transferase (nº x) 0.75±0.45 1.06±0.69 0.043
Alkaline Phosphatase (nº x) 0.74±0.28 0.70±0.27 0.514
Total cholesterol (mg/dL) 165.0±45.0 158.0±25.0 0.456
LDL-cholesterol (mg/dL) 102.0±41.0 98.0±20.0 0.706
HDL-cholesterol (mg/dL) 44.0±9.0 38.0±8.0 0.006
Triglycerides (mg/dL) 95.0±56.0 114.0±47.0 0.051
Table 2 - Characteristics of individuals evaluated according to insulin resistance
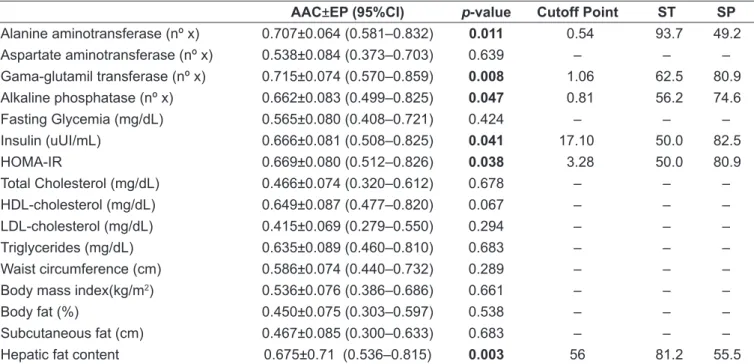
AUC: area under the curve; SE: standard error; ST: sensitivity; SP: speciicity; 95%CI: conidence interval of 95%; no x: number of times the upper limit of normal according to age and sex; HOMA-IR: Homeostasis Model Assessment–Insulin Resistance
AAC±EP (95%CI) p-value Cutoff Point ST SP
Alanine aminotransferase (nº x) 0.707±0.064 (0.581–0.832) 0.011 0.54 93.7 49.2
Aspartate aminotransferase (nº x) 0.538±0.084 (0.373–0.703) 0.639 – – –
Gama-glutamil transferase (nº x) 0.715±0.074 (0.570–0.859) 0.008 1.06 62.5 80.9
Alkaline phosphatase (nº x) 0.662±0.083 (0.499–0.825) 0.047 0.81 56.2 74.6
Fasting Glycemia (mg/dL) 0.565±0.080 (0.408–0.721) 0.424 – – –
Insulin (uUI/mL) 0.666±0.081 (0.508–0.825) 0.041 17.10 50.0 82.5
HOMA-IR 0.669±0.080 (0.512–0.826) 0.038 3.28 50.0 80.9
Total Cholesterol (mg/dL) 0.466±0.074 (0.320–0.612) 0.678 – – –
HDL-cholesterol (mg/dL) 0.649±0.087 (0.477–0.820) 0.067 – – –
LDL-cholesterol (mg/dL) 0.415±0.069 (0.279–0.550) 0.294 – – –
Triglycerides (mg/dL) 0.635±0.089 (0.460–0.810) 0.683 – – –
Waist circumference (cm) 0.586±0.074 (0.440–0.732) 0.289 – – –
Body mass index(kg/m2) 0.536±0.076 (0.386–0.686) 0.661 – – –
Body fat (%) 0.450±0.075 (0.303–0.597) 0.538 – – –
Subcutaneous fat (cm) 0.467±0.085 (0.300–0.633) 0.683 – – –
Hepatic fat content 0.675±0.71 (0.536–0.815) 0.003 56 81.2 55.5
Table 3 - Effectiveness of biochemical, anthropometric, and body composition indicators and of the liver fat index in identifying hepatic steatosis
In the analysis of the ROC curve, liver enzymes (ALT, GG,T and ALP), HOMA -IR index, and FLI showed areas under the curve (AUC) signiicant (p<0.05) for the predic-tion of HS (Table 3). On the other hand, anthropometric and body composition indicators, plasma lipid proile, fasting glucose, and AST showed no signiicant results. The most accurate cutoff points for variables with signiicant results are shown in Table 3.
The concordance analysis between the diagnoses of HS by US and by FLI demonstrated a kappa index of 0.23, indicating little agreement between the methods. The chi-square test showed a correlation between both methods for the diagnosis of HS (6.924; p<0.009). Ado-lescents with a diagnosis of HS by FLI were five times more likely to show the HS by US. (OR 5.42; 95%CI 1.404–20.898).
Discussion
The present study found a prevalence of HS of 20.3% in the studied population. The prevalence of HS is poorly understood and it may be related to the method used for diagnosis. The studies used elevated ALT levels as
a criterion or the comparison of the echogenicity of the hepatic parenchyma with the renal cortex, the latter being more hyperechogenic in relation to the adjacent kidney. Studies show prevalence in obese children and adolescents from 15 to 42%(11,12). The prevalence of NAFLD more than
doubled in the past 20 years, rising from 3.9% in 1988 to 10.7% in 2010 in U.S. adolescents(13). Based on autopsy
studies, Schwimmer et al(14) reported that the prevalence
of HS in children and adolescents was of 9.6% and this prevalence rose to 38% in obese individuals. The dif-ference in prevalence may be related to the degree of obesity, because in some studies with higher prevalence, mean BMI values are higher compared to studies with lower prevalence.
Abdominal ultrasonography is considered a good method for the diagnosis and monitoring of the degree of fatty iniltration in the liver, although it does not correlate with the degree of ibrosis. We adopted this method of image due to the good sensitivity (89%) and speciicity (94%) for detection of HS compared to liver biopsy, considered as the gold standard(15), besides having
The prevalence of IR assessed by the HOMA-IR index, found in this study was 29.1%. Published data reported prevalence rates higher in obese adolescents(16,17). This
varia-tion in the prevalence of IR in the studies may be explained by the lack of an established cutoff point as a reference to classify patient outcomes(6-18).
HS seems to relate directly to IR. The mean for the HOMA-IR index in this study was signiicantly higher in patients with HS. The HOMA-IR was shown to be a good indicator in predicting HS, with a cutoff of 3.28, close to that used for diagnosing IR (HOMA-IR >3.16). There is increas-ing evidence that obesity and IR are risk factors for NAFLD also in children and adolescents. Seixas(19) demonstrated that
obese children and adolescents with SH are 2.6-fold more likely to present IR when compared with children without HS. El-Koofy et al(20) observed that the prevalence of IR was
signiicantly higher in patients with HS compared with patients without HS (73 versus 28%).
Insulin resistance and oxidative stress appear to be the two events involved in the pathogenesis of NAFLD. The pathophysiology involves two steps: irst, IR causes steatosis; in the second, oxidative stress produces lipid peroxidation and active inlammatory cytokines, resulting in steatohepatitis(21). The state of insulin resistance, often
associated with obesity, leads to increased circulating free fatty acids that are seized and deposited within hepato-cytes. This deposit activates the inlammatory cascade modulated by a variety of cytokines, and results in the exacerbation of oxidative stress, critical to the progression of NAFLD(3). This hypothesis was conirmed in the study by
Ruiz-Extremera et al(22), in which it was observed in obese
adolescents, that oxidative stress and IR are signiicant factors for the development of HS. Mager et al(23) suggest
that in all children and adolescents with overweight and obesity and that present IR, HS should be investigated.
In the comparison of means between groups with an without HS, the results of liver enzymes ALT, ALP, and GGT, presented as the number of times the upper limit of normal values, showed signiicant values. In the analysis of the ROC curve, the GGT showed greater speci-icity in the prediction of the HS, with a cutoff point 1.06 times higher than the reference value. ALT showed greater sensitivity, with a cutoff of 0.54 times — value below the reference value. As the cutoff is deined as the highest sum of sensitivity and speciicity, when the cutoff of ALT rises to 1, the sensitivity decreases to 31.2%, indicating not
being a good predictor of HS. The study by Ramos(24)
cor-roborates the indings in the present study. In his research, the mean values of GGT were also associated to HS, but no enzyme presented a good cutoff point to predict the HS. The author also highlights the importance of performing ultrasonography in children and adolescents as a criterion to evaluate HS.
Some studies have shown that changes in ALT and GGT can relate to some degree of liver inlammation, character-izing a more advanced stage of NAFLD(25,26). Therefore, it is
recommended that even in the absence of changes in serum levels of liver enzymes, the ultrasound integrate the overall assessment of the obese patient to identify mild cases of hepatic fatty iniltration.
The means of anthropometric indicators and body com-position, and lipid proile showed no signiicant difference between groups, and neither did the ROC curve analysis. This can be explained by the fact that patients in this study were from a clinic that treats severer cases of obesity, all of which with BMI, WC, and %BF above the recommended, regardless of HS. El-Koofy et al(20) observed a signiicant
difference in the means of groups with and without HS for BMI, WC, and lipid proile. However, it is noteworthy that liver biopsy was the method used for the diagnosis of NAFLD and that, as inclusion criteria, all patients had to present hepatomegaly and/or abnormalities on ALT, indicating a more advanced stage of liver disease. The authors diagnosed 44% of patients with NAFLD, a much higher prevalence than that found in the present study. In contrast, the results of Duarte and Silva(12) and Lin et al(27) agree with the present
study, with no signiicant difference in lipid proile between groups with and without HS.
The FLI showed little relation to the diagnosis of HS by US. This index uses three variables for the calculation (GGT, TG and WC), and two of these variables (TG and WC) showed no statistical difference between the groups with and without HS, which could be the explanation for the poor agreement between the methods. This is the irst study that made reference to FLI in obese adolescents and due to the low concordance with the US, it was considered of little use in the studied population.
References
1. Angulo P. Nonalcoholic fatty liver disease. N Engl J Med 2002;346:1221-31. 2. Roberts EA. Non-alcoholic steatohepatitis in children. Clin Liver Dis
2007;11:155-72.
3. Sathya P, Martin S, Alvarez F. Nonalcoholic fatty liver disease (NAFLD) in children. Curr Opin Pediatr 2002;14:593-600.
4. World Health Organization [homepage on the Internet]. Geneva: Growth reference 5-19 years [cited 2013 Jan 10]. Available from: http://www.who.int/ growthref/en/
5. Lohman GT, Roche AF, Martorell R. Anthropometric standardization reference manual. Champaign: Human Kinetics; 1988.
6. Keskin M, Kurtoglu S, Kendirci M, Atabek ME, Yazici C. Homeostasis model assessment is more reliable than the fasting glucose/insulin ratio and quantitative insulin sensitivity check index for assessing insulin resistance among obese children and adolescents. Pediatrics 2005;115:500-3.
7. Osawa H, Mori Y. Sonographic diagnosis off fatty liver using a histogram techinique that compares liver and renal cortical echo amplitudes. J Clin Ultrasound 1996;24:25-9.
8. Diniz AL, Tomé RA, Debs CL, Carraro R, Roever LB, Pinto RM. Reproducibility of ultrasonography as a method to measure abdominal and visceral fat. Radiol Bras 2009;42:353-7.
9. Bedogni G, Bellentani S, Miglioli L, Masutti F, Passalacqua M, Castiglione A
et al. The fatty liver index: a simple and accurate predictor of hepatic steatosis in the general population. BMC Gastroenterology 2006;33:1-7.
10. Roche Diagnostics [homepage on the Internet]. Reference ranges for adults and children [cited 2013 Jan 10]. Available from: https://www.rochediagnostics. fr/Htdocs/media/pdf/actualites/2a_Reference_Ranges_2008.pdf
11. Grupta R, Bhangoo A, Matthews NA, Anhalt H, Matta Y, Lamichhane B et al. The prevalence of non-alcoholic fatty liver disease and metabolic syndrome in obese children. J Pediatr Endocrinol Metab 2011;24:907-11.
12. Duarte MA, Silva GA. Hepatic steatosis in obese children and adolescents. J Pediatr (Rio J) 2011;87:150-6.
13. Welsh JA, Karpen S, Vos MB. Increasing prevalence of nonalcoholic fatty liver disease among United States adolescents, 1988-1994 to 2007-2010. J Pediatr 2013;162:496-500.
14. Schwimmer JB, Deutsch R, Kahen T, Lavine JE, Stanley C, Behling C. Prevalence of fatty liver in children and adolescents. Pediatrics 2006;118:1388-93.
15. Saverymuttu SH, Joseph AE, Maxwell JD. Ultrasound scanning in the detection of hepatic ibrosis and steatosis. Br Med J (Clin Res Ed) 1986;292:13-5. 16. Caceres M, Teran CG, Rodriguez S, Medina M. Prevalence of insulin resistance
and its association with metabolic syndrome criteria among Bolivian children and adolescents with obesity. BMC Pediatr 2008;8:31.
17. Medeiros CC, Ramos AT, Cardoso MA, França IS, Cardoso AS, Gonzaga NC et al. Insulin resistance and its association with metabolic syndrome components. Arq Bras Cardiol 2011;97:380-9.
18. Madeira IR, Carvalho CN, Gazolla FM, de Matos HJ, Borges MA, Bordallo MA. Cut-off point for homeostatic model assessment for insulin resistance (HOMA-IR) index established from receiver operating characteristic (ROC) curve in the detection of metabolic syndrome in overweight pre-pubertal children. Arq Bras Endocrinol Metab 2008;52:1466-73.
19. Seixas RB. Avaliação da esteatose hepática em crianças e adolescentes obesos e com sobrepeso e sua associação com a resistência à insulina [tese de mestrado]. Brasília (DF): UnB; 2010.
20. Koofy NM, Anwar GM, Raziky MS, Hennawy AM, Mougy FM, El-Karaksy HM et al. The association of metabolic syndrome, insulin resistance and non-alcoholic fatty liver disease in overweight/obese children. Saudi J Gastroenterol 2012;18:44-9.
21. McCullough AJ. Update on nonalcoholic fatty liver disease. J Clin Gastroenterol 2002;34:255-62.
22. Ruiz-Extremera Á, Carazo Á, Salmerón Á, León J, Casado J, Goicoechea A et al. Factors associated with hepatic steatosis in obese children and adolescents. J Pediatr Gastroenterol Nutr 2011;53:196-201.
23. Mager DR, Ling S, Roberts EA. Anthropometric and metabolic characteristics in children with clinically diagnosed nonalcoholic fatty liver disease. Paediatr Child Health 2008;13:111-7.
24. Ramos AL. Esteatose hepática em crianças e adolescentes com excesso de peso: relação com os componentes da síndrome metabólica [tese de mestrado]. Campina Grande (PB): UEPB; 2011.
25. Fishbein MH, Miner M, Mogren C, Chalekson J. The spectrum of fatty liver in obese children and the relationship of serum aminotransferases to severity of steatosis. J Pediatr Gastroenterol Nutr 2003;36:54-61.
26. Roberts EA. Pediatric nonalcoholic fatty liver disease (NAFLD): a “growing” problem. J Hepatol 2007;46:1133-42.