Submitted26 January 2016
Accepted 1 March 2016
Published21 March 2016
Corresponding author
Tyler D. Eddy, [email protected]
Academic editor
Rita Castilho
Additional Information and Declarations can be found on page 16
DOI10.7717/peerj.1832
Copyright
2016 Baker et al.
Distributed under
Creative Commons CC-BY 4.0
OPEN ACCESS
Comparative analysis of different survey
methods for monitoring fish assemblages
in coastal habitats
Duncan G.L. Baker1, Tyler D. Eddy1, Reba McIver1, Allison L. Schmidt1, Marie-Hélène Thériault2, Monica Boudreau2, Simon C. Courtenay2,3and Heike K. Lotze1
1Department of Biology, Dalhousie University, Halifax, Nova Scotia, Canada 2Fisheries and Oceans, Gulf Fisheries Centre, Moncton, New Brunswick, Canada 3University of Waterloo, Canadian Rivers Institute, Waterloo, Ontario, Canada
ABSTRACT
Coastal ecosystems are among the most productive yet increasingly threatened marine ecosystems worldwide. Particularly vegetated habitats, such as eelgrass (Zostera marina) beds, play important roles in providing key spawning, nursery and foraging habitats for a wide range of fauna. To properly assess changes in coastal ecosystems and manage these critical habitats, it is essential to develop sound monitoring programs for foundation species and associated assemblages. Several survey methods exist, thus understanding how different methods perform is important for survey selection. We compared two common methods for surveying macrofaunal assemblages: beach seine netting and underwater visual census (UVC). We also tested whether assemblages in shallow nearshore habitats commonly sampled by beach seines are similar to those of nearby eelgrass beds often sampled by UVC. Among five estuaries along the Southern Gulf of St. Lawrence, Canada, our results suggest that the two survey methods yield comparable results for species richness, diversity and evenness, yet beach seines yield significantly higher abundance and different species composition. However, sampling nearshore assemblages does not represent those in eelgrass beds despite considerable overlap and close proximity. These results have important implications for how and where macrofaunal assemblages are monitored in coastal ecosystems. Ideally, multiple survey methods and locations should be combined to complement each other in assessing the entire assemblage and full range of changes in coastal ecosystems, thereby better informing coastal zone management.
SubjectsAquaculture, Fisheries and Fish Science, Biodiversity, Ecology, Environmental Sciences, Marine Biology
Keywords Fish assemblage, Environmental monitoring, Beach seine, Coastal zone management, Underwater visual census (UVC), Survey selection
INTRODUCTION
Field surveys are a common first step for many fundamental and applied ecological studies, and provide an essential foundation for environmental management (Connolly, 1994;
Thus, the ability to complete accurate, rapid and cost-effective species surveys has become an important conservation and management tool (Hughes, 1996;Schmitt, Sluka & Sullivan-Sealey, 2002;Langlois et al., 2010;Murphy & Jenkins, 2010).
For most natural communities, a variety of different survey methods exist; yet resulting estimates of species abundance and diversity can vary with the survey method selected, influencing both the precision and accuracy of the data (Connolly, 1994;Mapstone & Ayling, 1998;Côté & Perrow, 2006). Thus, data collected using different methods may not be directly comparable due to survey biases. Given that survey results may be used for conservation and management decisions, it is therefore important to evaluate how different survey methods perform, and whether they can replace or complement each other (Murphy & Jenkins, 2010;Ward-Paige, Flemming & Lotze, 2010).
In estuarine and coastal ecosystems, monitoring mobile macrofaunal assemblages, particularly fish assemblages, requires underwater survey techniques. Commonly used methods monitoring mobile macrofaunal assemblages in estuarine and coastal ecosystems include beach seine netting, underwater visual census (UVC), baited remote underwater video (BRUV), diver-operated stereo video, as well as more destructive methods such as dredging/trawling, poisoning, and suction sampling (Harmelin-Vivien & Francour, 1992;
Côté & Perrow, 2006;Murphy & Jenkins, 2010;Holmes et al., 2013). Both BRUV and stereo video have the advantage of reduced diver error of size and abundance estimation, yet BRUV has been criticized for preferentially surveying greater numbers of large predatory fish species, without seeing comparable changes in smaller herbivorous species (Watson et al., 2005;Langlois et al., 2010). Additionally, both BRUV and stereo video have the downside of increased survey equipment costs and data analysis time due to large amount of footage (Willis, Millar & Babcock, 2000;Langlois et al., 2010).
and species behaviour may affect the results as some species are attracted to, while others may swim away from the diver (Brock, 1982;Chapman & Atkinson, 1986;Dickens et al., 2011). Visual surveys also often miss cryptic species; however, interference visual census (IVC) is a technique which dismantles habitat to survey cryptic species, and can sample these species better than nets. However, this requires sampling twice the amount of transects and has a greater impact on the habitat (Beldade & Gonçalves, 2007). Finally, since UVC requires instantaneous identification of individuals in an open environment, it may result in species misidentification. Despite the widespread use of both beach seines and UVC for monitoring coastal ecosystems around the world, there are few studies that have evaluated the comparability of these survey methods in different regions (Franco et al., 2012).
Another important question in the design of monitoring programs is where to perform surveys. Most coastal ecosystems consist of a diverse set of habitats with various bottom types, foundation species, depths, abiotic conditions and anthropogenic impacts, and associated macrofaunal assemblages likely differ among different habitat types and human impacts (Heck, Hays & Orth, 2003;Schmidt et al., 2011;Schein et al., 2012;Holmes et al., 2013). Thus, depending on the goal of the monitoring program, it is important to decide which survey methods to use, and where to perform them in order to gain the most meaningful results. Broader assessments of fish assemblages in different habitats within and among estuaries have been performed in Europe, albeit using more destructive trawl surveys (França, Costa & Cabral, 2009;França, Costa & Cabral, 2011;Selleslagh et al., 2009).
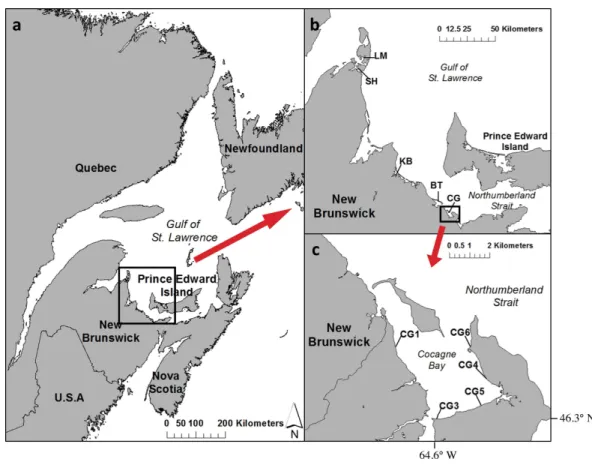
Figure 1 Map of (A) Atlantic Canada with the southern Gulf of St. Lawrence and Northumberland Strait region of New Brunswick, (B) a close-up of the five estuaries sampled: LM, Laméque; SH, Shippa-gan; KB, Kouchibouguac; BT, Bouctouche; CG, Cocagne, and (C) map of Cocagne Bay with long-term CAMP study sites CG1 to CG6 (ESRI, 2011;Government of Canada GeoGratis, 2013).
The results have important implications for how and where to best sample coastal fish assemblages to assess changes in the structure and functioning of coastal ecosystems. Our results can be used for the design of NorSt–EMP as well as other national or international monitoring programs already using or adopting these common monitoring methods.
MATERIALS AND METHODS
Study sitesdiversity in mobile macroinvertebrates, although spring and fall are important seasons for fish spawning and recruitment (Schmidt & Scheibling, 2007). All study sites were located in sheltered areas and shallow waters (<2 m deep) with large (>50 m wide) continuous eelgrass beds close to shore. Water temperatures ranged from 19.6 to 22.4◦
C, salinities from 22.6 to 27.2 PSU, and dissolved oxygen content from 5.2 to 13.8 mg/L (Table S1).
All procedures performed in this study involving animals were in accordance with the ethical standards of the institutions at which the studies were conducted. The Dalhousie University Committee on Laboratory Animals approval number is: #11–103. This field research was conducted under the scientific licence to the Department of Fisheries and Oceans, # SG-RHQ-13-089.
Sampling design
Our sampling aims were twofold: (i) to compare beach seine and visual census (UVC) surveys in nearshore habitats within one estuary (Cocagne Bay) and among five estuaries; (ii) to compare nearshore and eelgrass habitats among five estuaries (Table S1). All sampling was completed between 9:00 and 16:00, and followed the design of existing survey protocols by CAMP and Dalhousie (Weldon et al., 2004;Schmidt et al., 2011;Schmidt, 2012).
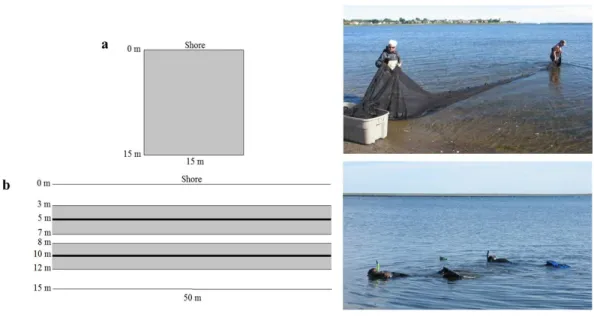
For the survey method comparison, at each of the nine study sites (Figs. 1Band1C), two 50 m transects were placed parallel to shore (at 5 m and 10 m distance from shore) and left undisturbed for a minimum of 20 min prior to UVC nearshore sampling in order to allow for any disturbance caused by placing the transects to subside. UVC nearshore sampling was undertaken at high tide due to the shallow depths surveyed (0.75–1.5 m in depth) and to survey mobile species that use the intertidal zone during the high tide (Fig. 2B). During high tide, two divers swam parallel, each on a separate transect. All mobile macrofauna (fish and crustaceans such as crabs) within 2 m of either side of the transect line were counted, sized and identified to species level if possible. Hence, the total area sampled per transect was 200 m2(Fig. 2B). Diver estimates of fish length were compared to species length at maturity to determine life stages and separate juveniles from adults (Table S2). UVC surveys were undertaken with a minimum of two metres of visibility to ensure that results were not being driven by ability to observe species. We recognize that the use of stereo video would aid in species identification and size estimation, however we did not have access to this equipment at the time of the surveys, and previous surveys had not employed it.
Figure 2 Sampling layout and photograph of (A) beach seine and (B) underwater visual census (UVC) surveys in nearshore shallow water with marked distances from shore and survey lengths.Shaded areas represent those sampled by the given method; a total of 225 m2in the beach seine and 200 m2in each
visual survey. UVC transect lines at 5 m and 10 m from shore are bolded (Photo credit: Heike Lotze).
volume of individuals collected rendered counting time harmful to the captured organisms, rare individuals were counted first, while common species abundances were estimated by subsamples of one dip net. The number typically caught in one dip net was multiplied by the number of dip nets necessary to empty the whole holding tank.
For the habitat comparison between nearshore shallow waters and eelgrass beds among five estuaries, UVC was performed using the same methods as above, but in the centre of an eelgrass bed in close proximity (50–100 m) to, but slightly deeper (0.75–1.50 m deep) than the nearshore (0–0.75 m deep) survey (Fig. 1B,Table S1). Water depths at the eelgrass sites necessitated the use of SCUBA equipment when sampling, whereas the nearshore shallow site sampling was completed using snorkelling gear. In both cases it was possible to observe species found on the benthos as well as in the water column.
Data analysis
To examine differences in the species composition, we used non-metric multidimen-sional scaling (MDS) and multivariate PERMANOVA, based on a zero-adjusted Bray-Curtis similarity matrix of log transformed species abundance data (Clarke & Gorley, 2008a). Log (x+1) transformation allows both rare and dominant species to more evenly influence the
sample similarity metric, while not completely disregarding species abundances (Clarke & Gorley, 2008b). Additionally, we tested for homogeneity in dispersion (PERMDISP) of data that might be explaining observed variation (Anderson, Gorley & Clark, 2008). Similarity percentage (SIMPER) and principle coordinates (PCO) analyses were used to identify which species contributed the most to the differences in species composition (there was very high agreement between the tests, so only SIMPER results are presented), and separate univariate PERMANOVA was used to test for significant differences in the abundance of these species between survey methods and habitats (Clarke & Gorley, 2008a;Anderson, Gorley & Clark, 2008).
To investigate differences between survey methods (beach seine vs. UVC), the two shal-low water visual transects (200 m2each) were pooled, creating one sample to be compared with the beach seine survey (totalling 225 m2). Data were analyzed among the five estuaries to test for differences among estuaries (n=5), and within one estuary only (Cocagne Bay)
to assess within-estuary variability (n=5). For the habitat comparison among the five
estuaries, we kept the two transects per habitat as separate samples. We assessed differences in univariate summary measures including total abundance (per m2), species richness, diversity (Shannon index) and evenness (Pielou index). Univariate PERMANOVA on the zero-adjusted Bray-Curtis similarity matrix for total abundance and a Euclidean distance matrix for richness, diversity and evenness was used to test if these summary measures were different between survey methods and habitats (Clarke & Gorley, 2008a).
RESULTS
Comparison of survey methods
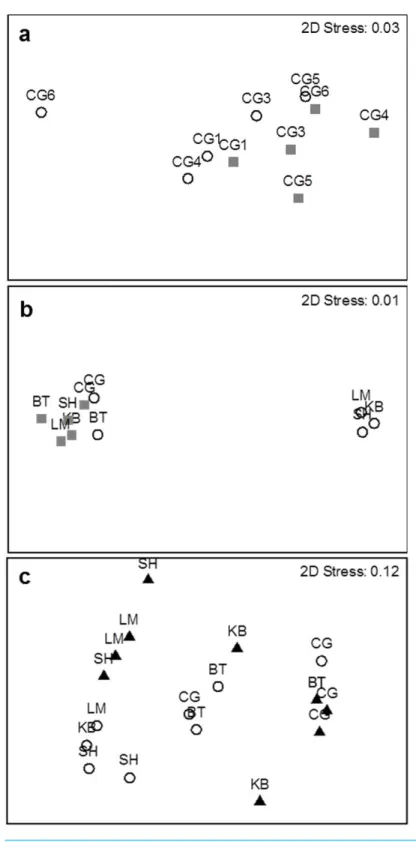
MDS plots show a clear distinction in species composition between the two survey methods within Cocagne Bay and among the five estuaries (Fig. 3Aand3B), while PERMANOVA identified significant differences in species composition among all sites and among estuaries, but not within Cocagne Bay (Table 1). Interestingly, two separate groupings for UVC appear among estuaries (Fig. 3B), where Cocagne and Bouctouche had been sampled before and the other three estuaries after a strong rainfall, which reduced visibility and resulted in lower abundance and species richness counts in Kouchibouguac, Shippagan and Lamèque (Fig. S1).
Figure 4 Mean (+SE) (A) abundance, (B) species richness, (C) diversity and (D) evenness sampled by visual surveys (light grey) and beach seines (dark grey) within one estuary, Cocagne Bay (n=5), across estuaries (n=5).
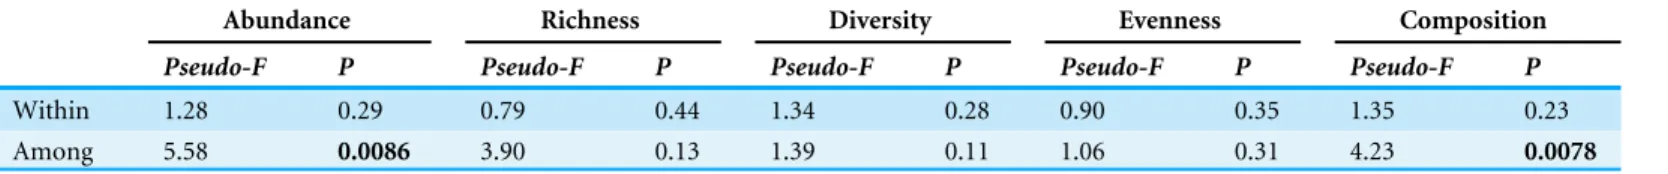
Table 1 PERMANOVA results for differences in assemblage structure between survey methods (beach seine vs. visual census) within an estu-ary (n=5), among estuaries (n=5), and among all sites (n=9). All results are from univariate PERMANOVA, except for species composition, which is from a multivariate analysis. Significantp-values (<0.05) are indicated in bold.
Abundance Richness Diversity Evenness Composition
Pseudo-F P Pseudo-F P Pseudo-F P Pseudo-F P Pseudo-F P
Within 1.28 0.29 0.79 0.44 1.34 0.28 0.90 0.35 1.35 0.23
Among 5.58 0.0086 3.90 0.13 1.39 0.11 1.06 0.31 4.23 0.0078
(Figs. S1B–S1D) but did not differ among areas in any of the study designs (Fig. 4and
Table 1).
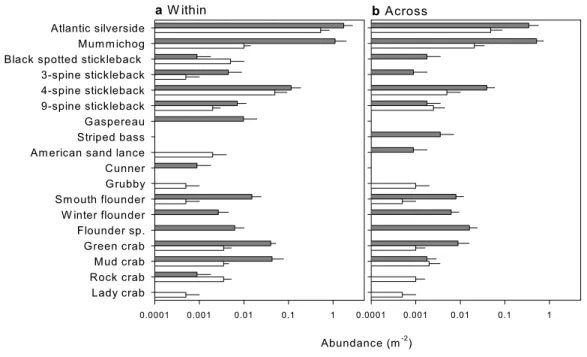
In total, 18 species of mobile macrofauna were encountered in the two survey methods among all study sites (Fig. 5andTable S3), with 13 species observed in the UVC and 16 species with the beach seine. Species that were only observed in the UVC included the grubby and lady crab, while black-spotted and 9-spine stickleback and rock and mud crabs were observed in higher abundance in the visual census (Fig. 5). In turn, species only observed with the beach seine included gaspereau, striped bass, cunner, winter flounder and other flounder, while Atlantic silverside, mummichog, three-spine stickleback, four-spine stickleback, smooth flounder and green crab were observed in higher abundance with the beach seine (Table S3).
Figure 5 Mean abundance (+SE) of species identified by beach seines (dark grey) and visual surveys (white) in nearshore habitats (A) within one estuary, Cocagne Bay (n=5) and (B) across estuaries (n= 5).
Table 2 Results of SIMPER analysis identifying the contribution of individual species to differences in species composition between survey methods (beach seine vs. visual census) within one estuary and Among all five estuaries, as well as univariate PERMANOVA results for differences in each species’ abundance between methods, except for juvenile flounder sp. which was only detected in the beach seine.The total contribution explained by the species listed is 92.67% for within and 91.93% for among estuaries. Significantp-values (<0.05) are indicated in bold.
SIMPER species Contribution (%) Pseudo-F P
Within estuary
Atlantic silverside 47.9 0.64 0.63
Mummichog 30.4 4.12 0.01
4-spine stickleback 10.0 0.45 0.97
Green crab 4.4 23.14 0.03
Among estuaries
Mummichog 50.6 8.52 0.02
Atlantic silverside 30.8 0.63 0.63
4-spine stickleback 7.3 0.27 1.00
Flounder species 3.3 NA NA
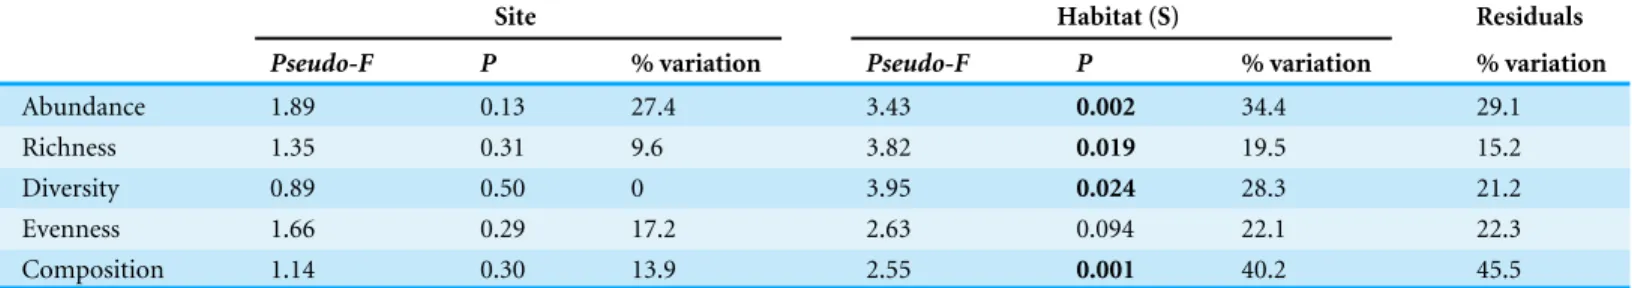
Table 3 PERMANOVA results and percent variation explained for differences in assemblage structure with site and habitat (nearshore vs. eel-grass) nested in site (S).All are univariate PERMANOVA analyses, except species composition, which is a multivariate analysis. Significantp-values (<0.05) are indicated in bold.
Site Habitat (S) Residuals
Pseudo-F P % variation Pseudo-F P % variation % variation
Abundance 1.89 0.13 27.4 3.43 0.002 34.4 29.1
Richness 1.35 0.31 9.6 3.82 0.019 19.5 15.2
Diversity 0.89 0.50 0 3.95 0.024 28.3 21.2
Evenness 1.66 0.29 17.2 2.63 0.094 22.1 22.3
Composition 1.14 0.30 13.9 2.55 0.001 40.2 45.5
was significantly more abundant with the beach seine within Cocagne Bay, and juvenile flounder sp. was only sampled with the beach seine among estuaries (Table 2).
Comparison of habitat differences
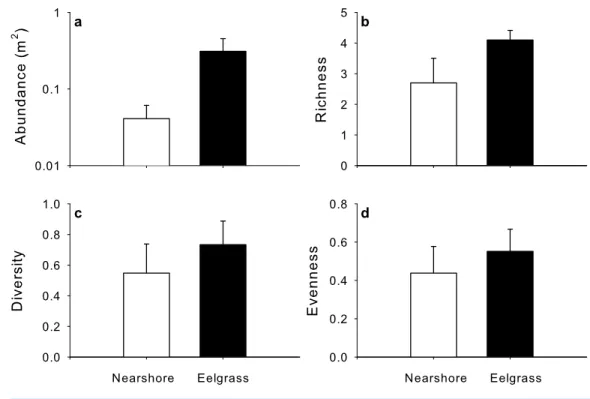
Total abundance, richness, diversity and evenness of mobile macrofauna varied among estuaries, yet were on average higher in eelgrass than nearshore habitats (Fig. 6,Fig. S2). The factor habitat was statistically significant for all except for evenness, and generally explained a larger proportion of the variation in the model than the residuals (Table 3), while site alone explained less variation and was not significant.
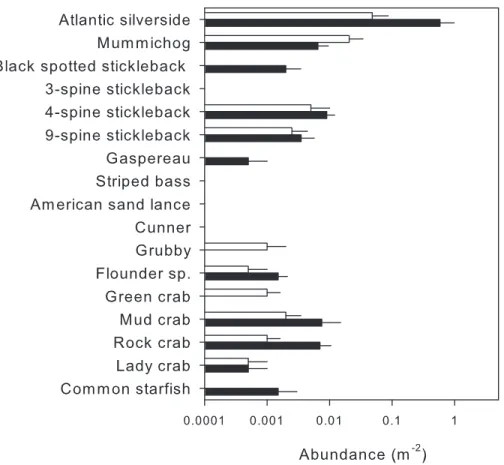
In total, 14 mobile macrofaunal species were encountered in the two habitats (Fig. 7,
Table S4), of which 10 were detected in nearshore and 12 in eelgrass surveys. Two species, green crab and grubby, were only detected nearshore, and mummichog was more abundant nearshore. In turn, four species were only found in eelgrass, including gaspereau, black-spotted stickleback and common starfish; however, both gaspereau and black-black-spotted stickleback had previously been observed in the nearshore during the methods comparison (Fig. 5).
Despite some overlap, the MDS plot (Fig. 3C) and multivariate PERMANOVA (Table 3) confirmed that species composition differed significantly between the two habitats, and habitat explained 40.2% of the variation. SIMPER analysis indicated that Atlantic silverside explained 57.8% of the variation in species composition, while mummichog (12.1%), rock Crab (11.5%), 4-spine stickleback (7.19%) and black spotted stickleback explained much less (3.25%). All these species had higher abundance in eelgrass, except for mummichog (Fig. 7); however, these differences were only statistically significant for Atlantic silverside, where habitat explained 47.0% of the variation in abundance (Table 4). For the other species, most of the variance was unexplained.
DISCUSSION
Figure 6 Mean (+SE) (A) abundance, (B) species richness, (C) diversity and (D) evenness sampled by UVC surveys in nearshore shallow (light grey) and nearby UVC surveys in eelgrass beds (dark grey) among five estuaries (n=5).
Table 4 Results of SIMPER analysis identifying the contribution of individual species to differences in species composition between habitats (nearshore vs. eelgrass), and univariate PERMANOVA results for each species’ abundance for the factors site and habitat with percent of varia-tion explained.The total contribution explained by the species listed is 91.79%. Significantp-values (<0.05) are indicated in bold; NA indicates that no tests could be performed because of zero occurrences.
SIMPER species Contribution (%) Site Habitat (S) Residuals
Pseudo-F P % variation Pseudo-F P % variation % variation
Atlantic silverside 57.78 0.57 0.80 0 4.12 0.04 47.0 37.6
Mummichog 12.07 0.87 0.56 0 1.38 0.31 19.4 39.2
Rock crab 11.51 0.54 0.82 0 NA NA NA 50.7
4-Spine stickleback 7.19 7.03 0.14 29.1 0.21 0.85 0 39.4
Black spotted stickleback 3.25 0.90 0.90 0 NA NA NA 52.7
Figure 7 Mean abundance (+SE,n=5) of species identified by visual surveys in shallow nearshore (white) and nearby eelgrass (black) habitats.
monitoring programs for coastal macrofaunal assemblages based on species of interest that can inform management of critical habitats at regional, national or international levels.
Survey method selection
census (IVC) of cyptic fishes could address this shortcoming (Beldade & Gonçalves, 2007). Three other species not observed in the UVC were quite rare mobile fishes (gaspereau, striped bass, cunner), that may have avoided divers (Chapman & Atkinson, 1986). Finally, in turbid waters with low visibility, UVC may result in reduced observations and consequently underestimation of faunal abundance and richness, which we encountered at several study sites after heavy rainfall.
Biases discussed for the beach seine are dominated by escapees due to net snagging or rolling, fish swimming away when the net is cast, or individuals finding refuge in depressions in the seabed (Piercer, Rasmussen & Leggett, 1990; Connolly, 1994; Weldon et al., 2004;
Franco et al., 2012). In our study, the beach seine surveys failed to detect two species, grubby and lady crab, which were observed in the UVC, and yielded lower abundances for rock crab, mud crab, black-spotted and 9-spine sticklebacks within or among estuary comparisons. The grubby is a mobile fish that may have avoided the seine net or left the area by the time the seine occurred. The lady crab is less mobile compared to the grubby but may have taken refuge in a depression or under a rock, escaping capture by the seine. These observations of the beach seine not detecting as many mobile species as UVC has also been found in another study byFranco et al. (2012). Overall, the beach seine found higher abundances for many species and more effectively detected rare or cryptic species (see above), similar to another study that compared survey methods (Franco et al., 2012). Although species missed by one survey method will have influenced species composition, none were identified by SIMPER analysis as important in driving differences in assemblage composition, except for juvenile flounder, which explained 3.3% of the difference in the within-estuary comparison. In contrast, the four SIMPER species explaining >90% of the differences in the species composition (Atlantic silverside, mummichog, 4-spine stickleback, green crab) were the most common species in our surveys, with generally higher abundances in the beach seine. Thus, an underestimation of these common species by UVC may have contributed to the significant difference in species composition between methods (Brock, 1982). Lastly, since we pooled two nearshore transects to compare with one beach seine, the UVC sampled a larger overall area than the beach seine, which may have increased species richness (Soberon & Lorente, 1993). However, variability in terms of species richness between the two nearshore transects prior to pooling was low (on average±1.66 species),
cannot be interchanged, and needs to stay consistent over long temporal or large spatial scales to avoid sampling biases. Ideally, the two survey methods could go hand in hand, complementing each other to assess broader changes in faunal assemblages and coastal ecosystems over time and space.
Habitat differences
Foundation species, such as seagrasses are known to increase habitat complexity, which is often positively correlated with adult faunal density, recruitment and post-settlement survival, and negatively correlated with predation risk (Preisser & Deegan, 1995;Heck, Hays & Orth, 2003;Vandermeulen, 2005;Vandermeulen, 2009;Schmidt et al., 2011;Schein et al., 2012). Thus, seagrass beds can support different macrofaunal assemblages compared to unvegetated or unstructured habitats, but there can also be considerable overlap and spill-over between adjacent habitats (Nagelkerken et al., 2001).
In our study, UVC surveys performed in shallow nearshore habitats yielded significant differences in faunal assemblage structure compared to UVC in eelgrass beds, despite their close proximity (Weldon et al., 2004). These results are consistent with other studies reporting higher abundance, richness and diversity in seagrass beds compared to unvegetated habitats (Preisser & Deegan, 1995;Hughes et al., 2002;Heck, Hays & Orth, 2003;Vandermeulen, 2005;Vandermeulen, 2009;Joseph, Locke & Godin, 2006;Schmidt et al., 2011;Schein et al., 2012). This relationship likely exists because eelgrass plants provide increased habitat complexity and structure, more ecological niches, a refuge from predation, a less turbulent environment and more abundant and diverse food sources (Preisser & Deegan, 1995;Heck, Hays & Orth, 2003;Schmidt et al., 2011). The only non-significant measure in our study was evenness, suggesting that despite significant differences in species richness and abundance, the assemblages have a similar distribution of the proportion of individuals spread over several species, with two or three abundant, and many uncommon species. However, on average evenness was higher in eelgrass beds compared to nearshore habitats, also reported in a similar study comparing seagrass beds and sandy bottom habitats in the Caribbean, which were attributed to differences in habitat complexity and productivity (Nagelkerken & Van der Velde, 2004).
common species and overall assemblage structure can be explained by habitat preferences and are not outweighed by spill-over or connectivity between habitats.
Given the differences in assemblage structure between nearshore and eelgrass habitats, nearshore surveys do not represent faunal assemblages in eelgrass beds. However, due to their close proximity and likelihood of spill-over from and connectivity with seagrass beds (Nagelkerken et al., 2001), nearshore assemblages are likely influenced by changes within seagrass beds. Therefore, monitoring not just one, but multiple coastal habitats, would provide the most valuable insight into overall changes in coastal ecosystems by highlighting the importance of linkages between different habitats (França, Costa & Cabral, 2009;França, Costa & Cabral, 2011;Selleslagh et al., 2009;Franco et al., 2012).
CONCLUSIONS
In the southern Gulf of St. Lawrence, Canada, two long-term and regional-scale monitoring and research programs surveying coastal fish assemblages have been in place since 2003. Due to different survey methods and survey locations used, results are not directly comparable to each other in assessing broader changes in the entire assemblage. As new regional monitoring programs are being developed or refined around the world, such as NorSt-EMP in the Southern Gulf of St. Lawrence, multiple survey methods and habitats should ideally be combined to assess long-term and large-scale changes in estuarine and coastal ecosystems. In addition, the results of our study emphasize the ecological importance of eelgrass beds which support significantly enhanced macrofaunal abundance and diversity compared to surrounding unvegetated habitats.
ACKNOWLEDGEMENTS
We would like to thank N Cullain, A Dixon and M Courtenay for assistance with field work and data collection. We would also like to thank three anonymous reviewers whose constructive comments improved the manuscript.
ADDITIONAL INFORMATION AND DECLARATIONS
Funding
Financial support was provided by the Natural Sciences and Engineering Research Council of Canada with a grant to HKL (NSERC RGPIN-341219-2008) and the Department of Fisheries and Oceans (DFO). The funders had no role in study design, data collection and analysis, decision to publish, or preparation of the manuscript.
Grant Disclosures
The following grant information was disclosed by the authors:
Natural Sciences and Engineering Research Council of Canada: NSERC RGPIN-341219-2008.
Competing Interests
The authors declare there are no competing interests.
Author Contributions
• Duncan G.L. Baker conceived and designed the experiments, performed the experiments,
analyzed the data, wrote the paper, prepared figures and/or tables, reviewed drafts of the paper.
• Tyler D. Eddy analyzed the data, wrote the paper, reviewed drafts of the paper.
• Reba McIver performed the experiments, analyzed the data, wrote the paper, reviewed
drafts of the paper.
• Allison L. Schmidt conceived and designed the experiments, performed the experiments,
analyzed the data, wrote the paper, reviewed drafts of the paper.
• Marie-Hélène Thériault, Monica Boudreau and Simon C. Courtenay conceived and
designed the experiments, performed the experiments, contributed reagents/materials/-analysis tools, wrote the paper, reviewed drafts of the paper.
• Heike K. Lotze conceived and designed the experiments, performed the experiments,
analyzed the data, contributed reagents/materials/analysis tools, wrote the paper, prepared figures and/or tables, reviewed drafts of the paper.
Animal Ethics
The following information was supplied relating to ethical approvals (i.e., approving body and any reference numbers):
All procedures performed in this study involving animals were in accordance with the ethical standards of the institutions at which the studies were conducted. The Dalhousie University Committee on Laboratory Animals approval number is: #11–103.
Field Study Permissions
The following information was supplied relating to field study approvals (i.e., approving body and any reference numbers):
This field research was conducted under the scientific licence to the Department of Fisheries and Oceans, # SG-RHQ-13-089.
Data Availability
The following information was supplied regarding data availability: Survey data can be found in theSupplemental Information.
Supplemental Information
Supplemental information for this article can be found online athttp://dx.doi.org/10.7717/ peerj.1832#supplemental-information.
REFERENCES
Anderson MJ, Gorley RN, Clark M. 2008.PERMANOVA+ for PRIMER: guide to software
Beldade R, Gonçalves EJ. 2007.An interference visual census technique applied to cryptobenthic fish assemblages.Life and Environment57:61–65.
Brock RE. 1982.A critique of the visual census method for assessing coral reef fish
populations.Bulletin of Marine Science32(1):269–276.
Canadian Department of Fisheries and Oceans (DFO). 2009.Does eelgrass (Zostera
marina) meet the criteria as an ecologically significant species? DFO Canadian
Science Advisory Secretariat Science Advisory Report 2009/018. Ottawa: Department of Fisheries and Oceans Canada.
Chapman CJ, Atkinson R J A. 1986.Fish behaviour in relation to divers.Progress in
Underwater Science11:1–14.
Clarke KR, Gorley RN. 2008a. Resemblance: Similarities, dissimilarities and distance. In:
PRIMER V6 user manual. Plymouth: PRIMER-E Ltd., 44–45.
Clarke KR, Gorley RN. 2008b. Pre-treatment options: transforming. In:PRIMER V6
user manual. Plymouth: PRIMER-E Ltd., 37–38.
Coll M, Schmidt AL, Romanuk T, Lotze HK. 2011.Food-web structure of seagrass
com-munities across different spatial scales and human impacts.PLoS ONE6(7):e22591
DOI 10.1371/journal.pone.0022591.
Connolly R. 1994.Comparison of fish catches from a buoyant pop net and a beach seine
net in a shallow seagrass habitat.Marine Ecology Progress Series105:309–305.
Côté IM, Perrow MR. 2006. Fish. In: Sutherland WJ, ed.Ecological census techniques: a
handbook. Cambridge: Cambridge University Press, 250–277.
Dickens LC, Goatley CHR, Tanner JK, Bellwood DR. 2011.Quantifying relative diver
effects in underwater visual censuses.PLoS ONE6(4):e18965
DOI 10.1371/journal.pone.0018965.
Edgar GJ, Barrett NS, Morton AJ. 2004.Biases associated with the use of underwater
visual census techniques to quantify fish density and size-structure.Journal of
Experi-mental Marine Biology and Ecology308:269–290DOI 10.1016/j.jembe.2004.03.004.
ESRI. 2011.ArcGIS Desktop: Release 10. Redlands. Redlands: Environmental Systems
Research Institute (ESRI).
Finley MA, Courtenay SC, Teather KL, Hewitt M, Holdway DA, Hogan NS, Van den
Heuvel MR. 2013.Evaluating cumulative effects of anthropogenic inputs in PEI
estuaries using the Mummichog (Fundulus heteroclitus).Integrated Environmental
Assessment and Management 9(3):496–507DOI 10.1002/ieam.1396.
França S, Costa MJ, Cabral HN. 2009.Assessing habitat specific fish assemblages in
estuaries along the Portuguese coast.Estuarine, Coastal and Shelf Science83:1–12
DOI 10.1016/j.ecss.2009.03.013.
França S, Costa MJ, Cabral HN. 2011.Inter- and intra-estuarine fish assemblage
variability patterns along the Portuguese coast.Estuarine, Coastal and Shelf Science 91:262–271DOI 10.1016/j.ecss.2010.10.035.
Franco A, Pérez-Ruzafa A, Drouineau H, Franzoi P, Koutrakis ET, Lepage M, Verdiell-Cubedo D, Bouchoucha M, López-Capel A, Riccato F, Sapounidis A, Marcos
assemblages in coastal lagoon habitats: Effect of sampling method.Estuarine, Coastal,
and Shelf Science112:115–125DOI 10.1016/j.ecss.2011.08.015.
Government of Canada GeoGratis. 2013.Atlas of Canada, National Scale Data
1:1,000,000: Boundary Polygons. Ottawa: Natural Resources Canada, Earth Sciences
Sector, Canada Centre for Mapping and Earth Observation.
Harmelin-Vivien ML, Francour P. 1992.Trawling or visual censuses? Methodological
bias in the assessment of fish populations in seagrass beds.Marine Ecology13:41–51
DOI 10.1111/j.1439-0485.1992.tb00338.x.
Harvey E, Fletcher D, Shortis MR. 2001.A comparison of the precision and accuracy of
estimates of reef length fishes determined visually by divers with estimates produced by stereo video system.Fishery Bulletin99:63–71.
Harvey E, Fletcher D, Shortis MR, Kendrick GA. 2004.A comparison of underwater
visual distance estimates made by scuba divers and stereo-video system: implications for underwater visual census of reef fish abundance.Marine and Freshwater Research 55:573–580DOI 10.1071/MF03130.
Heck Jr KL, Able KW, Fahay MP, Roman CT. 1995.Composition, abundance, biomass,
and production of macrofauna in a New England estuary: comparisons among eelgrass meadows and other nursery habitats.Estuaries18(2):379–389
DOI 10.2307/1352320.
Heck Jr KL, Hays G, Orth JR. 2003.Critical evaluation of the nursery role hypothesis
for seagrass meadows.Marine Ecology Progress Series253:123–136
DOI 10.3354/meps253123.
Hernandez PA, Graham CH, Master LL, Albert DL. 2006.The effect of sample size and
species characteristics on performance of different species distribution modeling methods.Ecography29:773–785DOI 10.1111/j.0906-7590.2006.04700.x.
Holmes TH, Wilson SK, Travers MJ, Langlois TJ, Evans RD, Moore GI, Douglas RA,
Shedrawi G, Harvey ES, Hickey K. 2013.A comparison of visual- and
stereo-video based fish community assessment methods in tropical and temperate marine waters of Western Australia.Limnology and Oceanography: Methods11:337–350
DOI 10.4319/lom.2013.11.337.
Hughes TP. 1996.Demographic approaches to community dynamics: a coral reef
example.Ecology77:2256–2260DOI 10.2307/2265718.
Hughes JE, Deegan LA, Wyda JC, Weaver MJ, Wright A. 2002.The effects of eelgrass
habitat loss on estuarine fish communities of southern New England.Estuaries 25:235–249DOI 10.1007/BF02691311.
Joseph V, Locke A, Godin JJ. 2006.Spatial distribution of fishes and decapods in eelgrass
(Zostera marinaL.) and sandy habitats of a New Brunswick estuary, eastern Canada.
Aquatic Ecology40:111–123DOI 10.1007/s10452-005-9027-x.
Langlois TJ, Harvey ES, Fitzpatrick B, Meeuwig JJ, Shedrawi G, Watson DL. 2010.
Lazzari MA, Able KW, Fahay MP. 1988.Life history and food habits of the Grubby,
Myoxocephalus aeneus(Cottidae), in a Cape Cod estuary.Copeia1:7–12
DOI 10.2307/1445597.
Lotze HK, Milewski I, Worm B, Koller Z. 2003.Nutrient pollution: a eutrophication
survey of eelgrass beds in estuaries and coastal bays in northern and eastern New
Brunswick. Fredericton: Conservation Council of New Brunswick.
Mapstone BD, Ayling AM. 1998.An investigation of optimum methods and unit sizes
for the visual estimation of abundances of some coral reef organisms.Great Barrier
Reef Marine Park Authority Research Publication47:1–69.
Murphy HM, Jenkins GP. 2010.Observational methods used in marine spatial
moni-toring of fishes and associated habitats: a review.Marine and Freshwater Research 61:236–252DOI 10.1071/MF09068.
Nagelkerken I, Kleijnen S, Klop T, Van den Brand RA, Cocheret de la Morinière E,
Van der Velde G. 2001.Dependence of Caribbean reef fishes on mangroves and
seagrass beds as nursery habitats: a comparison of fish faunas between bays with and without mangroves/seagrass beds.Marine Ecology Progress Series214:225–235
DOI 10.3354/meps214225.
Nagelkerken I, Van der Velde G. 2004.A comparison of fish communities of subtidal
seagrass beds and sandy seabeds in 13 marine embayments of a Caribbean island, based on species, families, size distribution and functional groups.Journal of Sea
Research52:127–147 DOI 10.1016/j.seares.2003.11.002.
Piercer C, Rasmussen J, Leggett W. 1990.Sampling littoral fish with a seine: corrections
for variable capture efficiency.Canadian Journal of Fisheries and Aquatic Sciences 47:1004–1810DOI 10.1139/f90-115.
Preisser MC, Deegan LA. 1995.Effect of changing plant morphology on invertebrate
susceptibility to predation in eelgrass beds.The Biological Bulletin189:242–243.
Ross HE, Franklin SS, Weitman G. 1969.Adaptation of divers to distortion of size
and distance underwater. Technical Report number 68-61. Fort Belvoir: Defense Technical Information Center, 1–49.
Schein A, Courtenay SC, Crane CS, Teather KL, Van den Heuvel MR. 2012.The role of
submerged aquatic vegetation in structuring the nearshore fish community within an estuary of the southern Gulf of St. Lawrence.Estuaries and Coasts35:799–810
DOI 10.1007/s12237-011-9466-7.
Schmidt AL. 2012.The role of marine macrophytes in providing essential ecosystem
ser-vices: Their relative contribution and how services are impacted by eutrophication. PhD thesis, Dalhousie University, Halifax, Nova Scotia, Canada.
Schmidt AL, Coll M, Romanuk TN, Lotze HK. 2011.Ecosystem structure and services in
eelgrassZostera marinaand rockweedAscophyllumnodosumhabitats.Marine Ecology
Progress Series437:51–68DOI 10.3354/meps09276.
Schmidt AL, Scheibling RE. 2007.Effects of native and invasive macroalgal canopies
on composition and abundance of mobile benthic macrofauna and turf-forming algae.Journal of Experimental Marine Biology and Ecology341:110–130
Schmidt AL, Wysmyk J, Craig S, Lotze HK. 2012.Regional-scale effects of eutrophica-tion on ecosystem structure and services of seagrass beds.Limnology and
Oceanogra-phy 57(5):1389–1402DOI 10.4319/lo.2012.57.5.1389.
Schmitt E, Sluka E, Sullivan-Sealey E. 2002.Evaluating the use of roving diver and
transect surveys to assess the coral reef fish assemblage off southeastern Hispaniola.
Coral Reefs21:216–233 DOI 10.1007/s00338-002-0216-y.
Selleslagh J, Amara R, Laffargue P, Lesourd S, Lepage M, Girardin M. 2009.Fish
composition and assemblage structure in three Eastern English Channel macrotidal estuaries: A comparison with other French estuaries.Estuarine, Coastal and Shelf
Science81:149–159DOI 10.1016/j.ecss.2008.10.008.
Skinner MA, Courtenay SC, McKindsey CW. 2013.Reductions in distribution,
photosynthesis, and productivity of eelgrassZostera marinaassociated with oyster
Crassostrea virginicaaquaculture.Marine Ecology Progress Series486:105–119
DOI 10.3354/meps10345.
Soberon JM, Lorente LB. 1993.The use of species accumulation functions for the
prediction of species richness.Conservation Biology7(3):480–488
DOI 10.1046/j.1523-1739.1993.07030480.x.
Vandermeulen H. 2005. Assessing marine habitat sensitivity: a case study with eelgrass
(Zostera marinaL.) and kelps (Laminaria, Macrocystis). In:DFO Canadian science
advisory secretariat research document 2005/032. Ottawa: Department of Fisheries
and Oceans Canada.
Vandermeulen H. 2009. An introduction to eelgrass (Zostera marina): the persistent
ecosystem engineer. In:DFO Canadian science advisory secretariat research document
2009/085. Ottawa: Department of Fisheries and Oceans Canada.
Ward-Paige CA, Flemming JM, Lotze HK. 2010.Overestimating fish counts by
non-instantaneous visual censuses: consequences for population and community descriptions.PLoS ONE5(7):e11722DOI 10.1371/journal.pone.0011722.
Ward-Paige CA, Lotze HK. 2011.Assessing the value of recreational divers for censusing
elasmobranchs.PLoS ONE6(10):e25609DOI 10.1371/journal.pone.0025609.
Watson DL, Harvey ES, Anderson MJ, Kendrick GA. 2005.A comparison of temperate
reef fish assemblages recorded by three underwater stereo-video techniques.Marine
Biology148(2):415–425DOI 10.1007/s00227-005-0090-6.
Weldon J, Garbary D, Courtenay SC, Ritchie W, Godin C, Thériault M-H, Boudreau
M, Lapenna A. 2004.The community aquatic monitoring project (CAMP) for
measuring marine environmental health in coastal waters of the southern Gulf of St. Lawrence: 2004 overview. Canadian Technical Report in Fisheries and Aquatic Sciences 2624. Ottawa: Department of Fisheries and Oceans Canada.Available at http:// open.canada.ca/ vl/ en/ doc/ publications-317505.
Willis TJ, Millar RB, Babcock RC. 2000.Detection of spatial variability in relative density
of fishes: comparison of visual census, angling, and baited underwater video.Marine