A COMPARISON OF METHODS FOR ESTIMATING FISH ASSEMBLAGES
ASSOCIATED WITH ESTUARINE ARTIFICIAL REEFS*
Michael Lowry1**, Heath Folpp2,3, Marcus Gregson2 and Rob Mckenzie2
1
Wild Fisheries Research Division, NSW Department of Primary Industries (Port Stephens Fisheries Institute, Locked Bag 1 Nelson Bay NSW 2315)
2
Recreational and Indigenous Fishing Division, NSW Department of Primary Industries (Cronulla Fisheries Research Centre, 202 Nicholson Parade, Cronulla NSW 2230)
3
School of Biological, Earth and Environmental Sciences (BEES) (University of New South Wales, Sydney NSW 2052 Australia)
**
Corresponding author: [email protected]
A
B S T R A C TMonitoring strategies which adequately represent the entire community associated with artificial structures will enable more informed decisions regarding the broader effects of artificial structures and their role in the management of fisheries resources. Despite the widespread application of a range of in situ visual monitoring methodologies used in the assessment of artificial structures, the relative biases associated with each method have not been critically examined and remain poorly understood. Estimates of fish abundance on six estuarine artificial reefs carried out by divers using underwater visual census techniques (UVC) were compared with estimates of relative abundance determined by baited remote underwater video (BRUV). It was found that when combined, both methods provided a more comprehensive description of the species associated with estuarine artificial reefs. However, the difference in the number of species detected and the frequency of detection varied between methods. Results indicated that the differences in rates of detection between UVC and BRUV methodologies were primarily related to the ecological niche and behaviour of the species in question. UVC provided better estimates of the rare or cryptic reef associated species. BRUV sampled a smaller proportion of species overall but did identify key recreational species such as
Acanthopagrus australis, Pagrus auratus and Rhabdosargus sarba with increased frequency. Correlation of
abundance indices for species classified as "permanent" identified interspecific interactions that may act as a source of bias associated with BRUV observations.
R
E S U M OO monitoramento biológico da comunidade associada a substratos artificiais permite a tomada de decisões corretas em relação ao uso e o papel dos novos habitats no manejo de recursos pesqueiros. Apesar da enorme aplicação das técnicas de censo visual no estudo da ictiofauna em recifes artificiais, os erros relativos de cada metodologia ainda não foram analisados. Estimativas de abundância de peixes obtidas através de censos visuais subaquáticos (CVS) em seis recifes artificias assentados em ambientes estuarinos, foram comparadas com a abundância relativa estimada através de técnicas de monitoramento remoto com vídeo subaquático (MRVS) e isca para atração dos animais. Os resultados combinados de ambas as técnicas descreveram melhor as espécies associadas aos recifes artificiais de regiões estuarinas. Entretanto, a diferença no número de espécies identificadas e a freqüência de detecção entre ambas as técnicas foram devidas principalmente aos nichos ocupados e ao comportamento específico de cada espécie. A técnica de CVS estimou melhores as espécies raras e crípticas associadas aos recifes. A técnica de MRVS estimou uma proporção menor de espécies, mas foi capaz de identificar mais frequentemente e com mais precisão as espécies recreacionais tais como Acanthopagrus australis, Pagrus auratus e Rhabdosargus sarba. Índices de correlação de abundância de espécies “permanentes” revelaram interações específicas que podem representar uma fonte de erro associada às observações com vídeo remoto.
Descriptors: Artificial reef, Baited underwater video, Visual census, Survey bias. Descritores: Recifes artificiais, Vídeo submarino, Censo visual, Vício amostral.
I
NTRODUCTIONA critical element in understanding how artificial reefs can be integrated into a more general
__________
(*) Paper presented at the 9th CARAH – International Conference on Artificial Reefs and Related Aquatic Habitats on 8-13 November, Curitiba, PR, Brazil.
in the initial phase following deployment demonstrate an ability to support greater fish abundance, diversity and biomass than similar naturally occurring habitats (PICKERING; WHITMARSH, 1997; WANTIEZ; THOLLOT, 2000; CHOU et al., 2002; RELINI et al., 2007; ARENA et al., 2007). Differences in the assemblage structure and recruitment patterns are further complicated by the relatively small size and isolated nature of many artificial reefs. The challenge for research workers is to develop appropriate standardized sampling protocols that will provide accurate and statistically valid information to enable an assessment of objectives associated with artificial structures to be made and permit direct comparison between studies (SALE, 1980; WILDING; SAYER, 2002; BORTONE, 2006).
Historically, sampling methods used in studies associated with artificial reefs fall into two broad categories, direct observation by divers (UVC) or destructive methods which include rotenone(?) sampling (RANDALL, 1963; STARCK, 1968) and adaptations of commercial fishing methods such as long-lining and gill netting (GANNON et al., 1985; KELCH et al., 1999). The practical limitations of destructive sampling methodologies, which are often prohibited in sensitive areas such as marine parks (LIPEJ et al., 2003; CAPPO et al., 2004; WILLIS et al., 2003) have resulted in the widespread use of a range of visual census techniques to monitor fish assemblages in a variety of shallow marine habitats. In situ visual methods are relatively rapid, provide adequate levels of replication and are capable of recording a broad suite of variables, e.g. relative abundance, density size structure species composition and habitat characteristics (BORTONE et al., 2000; SAMOILYS; CARLOS, 2000). However, the limitations of diver based methodologies have been well documented (THRESHER; GUNN, 1986;
SMITH, 1988; LINCOLN SMITH, 1989;
THOMPSON; MAPSTONE, 1997; KULBICKI, 1998) and relate to the physical limitations of the diver (e.g. water depth and visibility) and species specific sources of "detection heterogeneity" (MACNEIL et al., 2008; KULBICKI, 1998) which can be summarized as the ability of the diver to see fishes accurately and record their presence under variable conditions (SALE, 1997). Recent innovations in the development of video technology haveresulted in the widespread use of baited remote underwater video (BRUV) as a means of monitoring fish populations in a variety of habitats (CAPPO et al., 2006). BRUV systems do however have inherent biases such as difficulties in determining the area sampled due to variables associated with the dispersion of bait (BAILEY; PRIEDE, 2002; PRIEDE, MERRETT,
1998; PRIEDE; MERRETT, 1996), conservative relative abundance estimation (FARNSWORTH et al., 2007), reliance on acceptable visibility and an inability to detect more cryptic reef associated species (WATSON et al., 2005).
An assessment of conventional sampling methodology is required to determine the suitability of existing methodologies to accurately reflect the dynamics of the communities associated with artificial structures. Previous studies associated with artificial structures which provide direct comparison of methods are limited to an evaluation of UVC and video transect surveys of tropical species (TESSIER et al., 2005). There is currently no information comparing the use of BRUV and UVC methodologies to record fish assemblages on estuarine artificial structures. This study compares abundance estimates derived from UVC and BRUV to: (a) investigate the suitability of these techniques for describing the species assemblages associated with estuarine artificial reefs, and (b) determine relative sources of biases associated with each method as a basis for developing a sampling strategy that will provide a comprehensive and accurate assessment of artificial reefs.
M
ATERIAL ANDM
ETHODSStudy Area and Artificial Reefs Structures
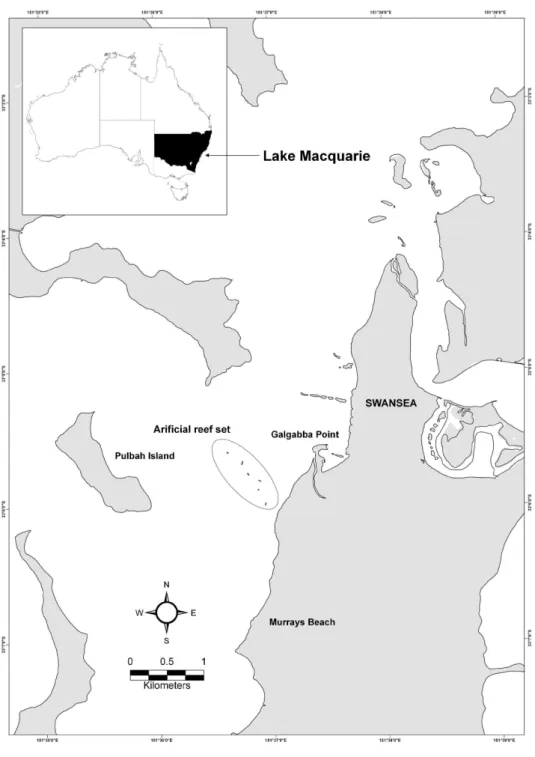
The study was carried out in the largest coastal saltwater lake in Australia, Lake Macquarie (33o05’S 151o36’E) (Fig. 1). The lake is 24 km long, covers an area of over 120 km and has an average depth of 7 m and a maximum depth of 11 m. A total of 180 artificial reef modules (Mini-Bay Reef Balls®)
Baited Remote Underwater Video (BRUV)
Three BRUV systems were built based on the design of Cappo et al. (2004). A stainless steel frame was constructed to provide a mount for the camera housing. A bait arm (20 mm plastic conduit) extended a distance of 1 m from the face of the camera housing supported a plastic bait container. Units were baited using standardized bait that was replenished prior to every deployment. Initial trials indicated that the standardized mixture provided a constant dispersal over the deployment times under a variety of conditions.
Three Sony DCR-HC21E Mini DV video cameras fitted with Sony 0.7X conversion lenses (VCL-HGO737X) were used, each mounted inside a submersible housing. Cameras were set on "short play" (SP) mode and focus set to "manual infinity". Analysis of tapes was carried out using the BRUVS tape reading interface 2.1 (ERICSON; CAPPO, 2006). Observations from the tapes were made of the time to first sighting and Max N (the maximum number of individuals of each species observed in one frame over the sampling period) and time of Max N were recorded for all species observed. See Cappo et al. (2006) for a detailed review of Max N as an estimator of relative abundance.
Underwater Visual Census (UVC)
Diver census was carried out by means of two counts, a stationary count to identify all immediately visible species followed by a ’roaming’ count to record the heavily reef associated and cryptic species residing within the reef structure itself. All species were recorded using a slate and pencil. When monospecific groups of more than fifty fish were observed sets of individuals were used by the diver to estimate the total population. For schools of mixed species the number was estimated for the entire school and an approximation made of the proportion of each species comprising the school.
Data Analysis
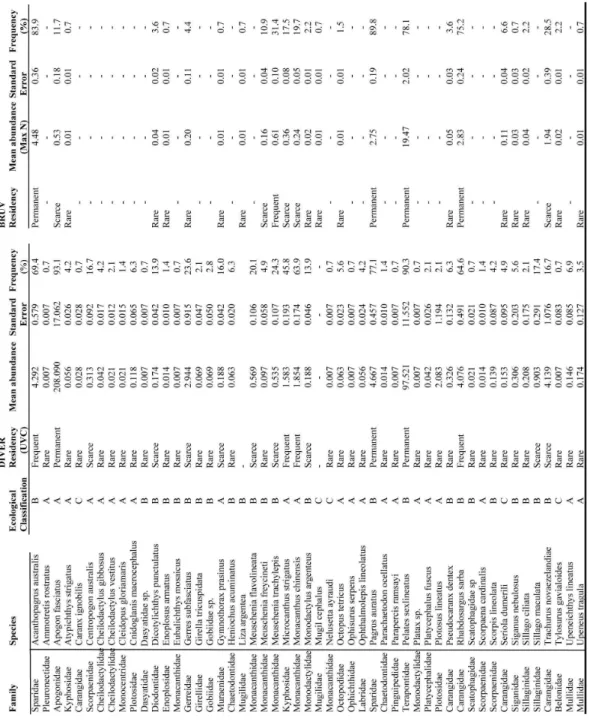
Each of the species was classified on the basis of its vertical distribution inside the water column and its position relative to the reef, the species being collectively defined as ecological groups (NAKAMURA, 1985). The first group (Type A) included species that tend to have direct contact with the reef structure itself, and often occupy crevices, holes or gaps within the reef. The second group (Type B) included species found in the immediate vicinity, but not coming into direct contact with the reef. The third, (Type C), included more transient species that did not demonstrate any site associated attachment to
the reef but were observed to move through the reef area. Similarity among species observed by each method was compared using the Sørensen Index (S) (LEGENDRE; LEGENDRE, 1998).
Percentage sighting frequency was defined as the percentage of all survey days on which the particular species or family was recorded by each method (UVC and BRUV). The percentage occurrence of each species was categorized into four groups; permanent species (>75%), frequent species (75-30%), scarce species (30-10%) and rare species (<10%) (TESSIER et al., 2005). In order to provide an evaluation of bias in the two methods, sighting frequency and abundance data were compared. UVC counts and Max N values were log(x+1) transformed. Pearson’s correlation coefficients (r) were computed between sighting frequency and abundance indices for both methods. Correlations amongst species identified as permanent by BRUV were carried out to determine possible species specific effects that may be acting to bias relative abundance estimates obtained by BRUV. Multivariate analysis (MDS) was used to identify relationships between UVC counts and relative abundance estimates generated by BRUV. Estimates of Max N and UVC counts derived from replicate artificial reefs were standardized (by total) and square root transformed. The relative variability in assemblages among techniques was measured using the index of multivariate dispersion (MVPdisp) derived using the analysis software PRIMER-E (CLARKE;WARWICK, 2001). The contribution of species to average dissimilarity between methods was determined using the SIMPER routine in PRIMER-E (CLARKE, 1993). Similarity percentages (SIMPER) were used to examine which individual species contributed to any observed differences in assemblage composition by identifying those with a ratio of dissimilarity to standard deviation of greater than 0.85. The ratio of the average dissimilarity and standard deviation (Diss/SD) is given as a measure of how consistently the species contributes to the characterization of differences between groups.
R
ESULTReplicate BRUV samples recorded a higher variability in assemblage structure (MVDisp=1.189) than was recorded among UVC counts (0.829). Categorization by ecological grouping identified the majority of species as either Type A (41%) or Type B (49%) with a minority of species identified as Type C (10%). Six species (Apogon fasciatus, Pelates sexlineatus, Pagrus auratus, Acanthopagrus australis, Rhabdosargus sarba) (where is the sixth?) were identified as permanent, however the majority (86%) of species identified were classified as scarce or rare. Forty-one of the species identified had a greater percentage occurrence by UVC with only eight species recording a greater proportion of observations by BRUV. BRUV observations identified four species (Acanthopagrus australis, Pagrus auratus, Pelates sexlineatus and Rhabdosargus sarba) as permanent. The species identified most often (93%) by UVC was Apogon fasciatus. However, this species was categorized as scarce by BRUV, being identified on 11.7% of observations. Both Pagrus auratus and Pelates sexlineatus were identified as permanent residents by both methods, however Acanthopagrus australis and Rhabdosargus sarba were identified as permanent by BRUV, but were classified as frequent by UVC.
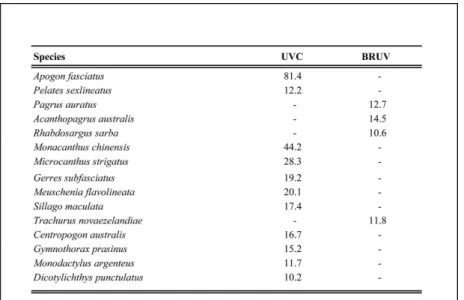
A total of 15 species had differences in the frequency of sighting between methods of 10% or greater (Table 2). The largest difference in sighting frequency between methods was found for Apogon fasciatus and Monacanthus Chinensis with 81% and 44% more sightings by UVC respectively. Species
with a greater frequency of sightings using BRUV included Pagrus auratus (13%), Acanthopagrus australis (15%), Rhabdosargus sarba (11%) and Trachurus novaezelandiae (12%). Sighting frequency values for species identified by both BRUV and UVC indexed by ecological and frequency classification (Table 3) indicated a relationship between observation method and ecological group. UVC identified a greater proportion of rare Type A species which represented 35% of all species identified by this method, compared to 12% identified by BRUV.
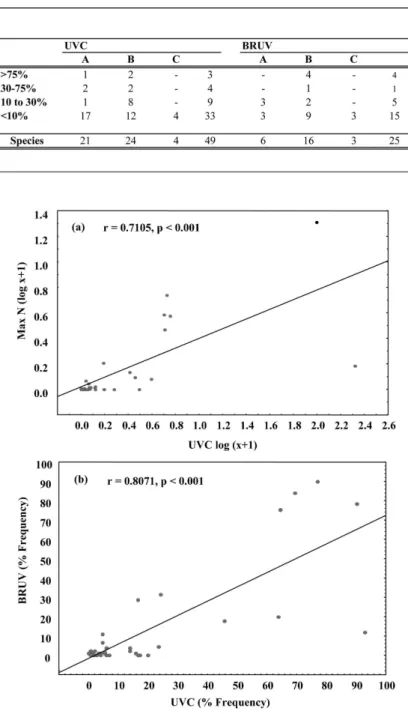
Correlation between UVC and BRUV mean sighting frequencies (r = 0.81, p< 0.001) and mean abundance data (Max N and UVC) were both strong (r = 0.71, p<0.05) (Fig. 2). Analysis of individual species identified as "permanent" by BRUV (Fig. 3) identified significant negative correlations between mean daily Max N values between Pelates sexlineatus and Acanthopagrus australis (r = -0.36 p<0.001), Pelates sexlineatus and Pagrus auratus (r = -0.23, p<0.001) and Pelates sexlineatus and Rhabdosargus sarba (r = -0.31, p< 0.001). Significant positive correlations were identified between Rhabdosargus sarba and Acanthopagrus australis (r = 0.45, p<0.001), and Rhabdosargus sarba and Pagrus auratus (r=0.39, p<0.001). UVC counts identified significant relationships between Rhabdosargus sarba and Pelates sexlineatus (r = 0.31, p<0.001), Rhabdosargus sarba and Acanthopagrus australis (r = 0.3, p<0.01) and Rhabdosargus sarba and Pagrus auratus (r = 0.36 p<0.001) (Fig. 3b).
Table 3. Number of species or species groups by category of occurrence: (>75%) permanent, (30-75%) frequent, (10-30%) rare and (<10%) scarce. All species classified by ecological type; (A) species found within the structure of the reef, (B) species found closely associated with the reef and (C) transient species.
The relationships between survey methodology and ecological groups are more clearly defined by the MDS analysis. UVC census was significantly different from the BRUV data (R = 0.116 p<0.001) (Fig. 4a). Species which contributed most to the differences between groups, identified by a ratio of dissimilarity to standard deviation of greater than 0.85 (SIMPER), included Apogon fasciatus (2.32), Pelates sexlineatus (1.43), Acanthopagrus australis (1.26), Pagrus
auratus (1.31), Rhabdosargus sarba (1.30) and Monacanthus chinensis (0.95). Pictorial representation of abundance indices for these species ("bubble plots") (Fig. 4(b-g)) more clearly indicates the relative contribution of each species to the observed pattern with Type A species (Apogon fasciatus and Monacanthus chinensis) defined by UVC observations and the remaining Type B species more evenly spread across both methods.
D
ISCUSSIONThe two survey methods (UVC and BRUV) were complementary in characterizing the species associated with estuarine artificial reefs. Previous studies comparing camera methods with diver surveys (FRANCOUR et al., 1999; STOBART et al., 2007; LANGLOIS et al., 2006) found similar results identifying a larger number of species using UVC. Our results indicate that the differences in rates of detection between UVC and BRUV methodologies are primarily related to the ecological niche andbehavior of the species in question. UVC provided a better coverage of the rare or cryptic reef associated species. BRUV sampled a smaller proportion of species overall but did however identify "key species" such as Acanthopagrus australis, Rhabdosargus sarba and Pagrus auratus with increased frequency. More detailed analysis of the BRUVS data for those species identified as "permanent" identified an interspecific interaction, with decreased rates of detection of these key species associated with increased abundance of Pelates sexlineatus.
Differences in the frequency of observations and abundance estimates between methods indicate that there are biases in both techniques that apply differently depending on the species in question. Sources of bias are categorized by MacNeil et al. (2008) as intrinsic factors that relate directly to the species observed, these include crypsis, size, color or behavior, or extrinsic factors such as the survey method, observer effects and site characteristics. Intrinsic factors were found to be the major source of "detection heterogeneity" with the predominantly site-associated Type A species such as Apogon fasciatus and Monacanthus chinensis identified 82% and 44% more frequently by UVC, respectively. These highly reef-associated species were not adequately represented by the BRUV assessments and made the strongest contribution to the observed patterns of detection. The lower detection frequency by UVC of key recreational species such as Pagrus auratus, Acanthopagrus australis and Rhabdosargus sarba in our study is consistent with previous work which has found UVC techniques to be less effective at detecting the more mobile Carangid and Sparid species (JENNINGS; POLUNIN, 1995; KULBICKI, 1998; WILLIS et al., 2000).
Extrinsic factors such as the size of the artificial reef and the aspect and proximity of the BRUV unit in relation to the reef may explain some of the observed variation between methods. Watson et al. (2005) observed a higher degree of overall variability in species recorded on naturally occurring reefs by diver stereo-video transects than baited or unbaited underwater video. The greater consistency in the identification of species using baited video has been
explained in terms of known biases associated with UVC (KULBICKI, 1998) or alternatively by the fact that the BRUVs longer sampling period actually samples a larger area (WILLIS et al., 2000). Our results do not support this, with BRUV observations indicating greater overall variability than the UVC and may be explained to some degree by the size and location of the artificial structures.
The artificial structures in this study are relatively small (<20 m2) and separated by at least 180 m of sandy substrate from any other artificial or naturally occurring structure. Many species appeared to maintain a high level of site attachment. Acanthopagrus australis and Pagrus auratus in particular were observed to move away from the diver, but were, however, reluctant to move more than 3-4 m away from the reef structure itself (pers obs). This possibly resulted in a higher frequency of UVC observations compared to those of similar studies carried out on contiguous reefs or larger artificial structures. Conversely, the relative size and isolated nature of the artificial reef formation may have contributed to the greater overall variability in observations by the BRUV system. Simulated BRUV drops indicated that cameras were placed in close proximity (<5 m) to the reef structure, however, what effects even relatively small variations in the location and aspect of the camera in relation to the reef may have had on estimates of Max N are unknown. Small variations in the proximity of the camera combined with low current speeds, may act to limit the spread of the bait plume and the detection of species by the BRUV unit, particularly the more site associated Type A species.
Other factors specific to the use of BRUV systems are the variable species response to the bait itself. The mechanisms that govern fish responses to bait are complex and likely to differ between species (CAPPO et al., 2003). While many studies have noted the biases associated with baited video and made recommendations of ways in which the effect of bait can be standardized (PRIEDE; MERRETT, 1996; PRIEDE; MERRETT, 1998; FARNSWORTH et al., 2007; COLLINS et al., 2002), there has been little attention to the impact that inter and intraspecific interactions have on our understanding of abundance estimates derived using BRUV.
the bait for extended periods can act to restrict the field of view, potentially limiting the number of species identified. Alternatively, inter or intra-specific interactions may result in only certain species or certain size classes approaching the bait. This effect can be exacerbated by schooling species which are characterized by low time at first feeding and large Max N values. These schooling species can physically obscure the field of view, decrease visibility by stirring up sediment, or preclude the approach of some other species or species groups.
The observed pattern of negative correlations between Pelates sexlineatus and other species identified by BRUV as permanent provides limited evidence of species specific bias. Pelates sexlineatus is an extremely gregarious species approaching the bait in large schools of up to 800 individuals within seconds of the BRUV landing on the seabed. The results indicate that the higher numbers of Pelates sexlineatus influence the detection of other species, particularly the more mobile larger species such as Pagrus auratus, Rhabdosargus sarba and Acanthopagrus australis. A comparison of the UVC data indicates that the reduction in the observation of these key species associated with large numbers of Pelates sexlineatus is a result of the method as no similar relationship was detected for these species in the UVC observations. Stobart et al. (2007) also noted that the more numerous "bait species" were detected in greater numbers by BRUV than UVC. Evidence from previous comparative studies also suggests that species specific responses to bait may also be a possible source of bias with more larger fish being identified by BRUV than by UVC, indicating that these larger fish are excluding smaller fish from the bait (LANGLOIS et al., 2006; STOBART et al., 2007).
While recognizing there are physical limitationsto the number of fish that can be detected by BRUV systems, some studies have suggested that the higher Max N values for the same species identified at other locations is evidence that this is not a significant source of bias (WILLIS et al., 2000). This, however, ignores the potential for interspecific interactions to vary between locations. Watson et al. (2005) concluded that information obtained from BRUV would be useful in examining a particular impact such as a recreational or commercial one with one important caveat: "provided the fish’s (or, fishes’) behavioural responses to bait in control and impacted areas are the same". The use of video based monitoring systems can offer a solution to known biases associated with UVC (FRANCOUR et al., 1999). However, biases inherentto the use of BRUVs and the more intra and interspecific sources of bias identified by this and other studies should be more clearly understood.
Recommendations for future work include controlled studies to test how accurately relative abundance estimates measured using a BRUV tracks known actual abundance. Further work should also examine the role that species specific effects such as size of fish or competition between species plays in the interpretation of information derived from baited and unbaited BRUV systems. Willis et al. (2000) and Watson et al. (2005) both reported that the unbaited video recorded similar species richness and was useful in observing the natural behavior of fish but concluded that over the short deployment periods used in the study (10 mins) the unbaited system was inadequate for studies of species richness and total number of individuals in an area. The use of unbaited camera systems deployed over longer periods may be particularly useful in the monitoring of artificial structures which in themselves act as a mechanism for the aggregation of many fish species.
Results indicate that BRUV is an effective method for recording species associated with artificial reefs with the exception of cryptic species that are located within the reef structure itself. The results of this study underline previous findings (WILLIS et al., 2000; CONNELL; KINGSFORD, 1998; CAPPO et al., 2004) which emphasize the importance of using complementary methods to obtain accurate estimates of species diversity and abundance. UVC methods are essential for the collection of baseline data, i.e. the number and type of species associated with artificial structures to give a more realistic understanding of how artificial structures differ from natural areas of reef, and how the assemblages associated with these structures vary in space and time. BRUV techniques complement UVC by providing increased coverage of species known to be diver averse as well as providing important information regarding behavior of the species identified. Given the limitation of each method, it is recommended that monitoring plans for artificial structures should adopt a multi-method approach utilizing both BRUV and UVC where possible. This will aid in establishing a comprehensive picture of spatial and temporal variation in the structure of species assemblages and enable "calibration" of the bias associated with each method. The allocation of resources to each method will largely depend on logistical considerations and the objectives of the program.
R
EFERENCESARENA, P.; JORDAN, L.; SPIELER, R. Fish assemblages on sunken vessels and natural reefs in southeast Florida, USA. Hydrobiologia, v. 580, p.157-171, 2007. BAILEY, D.; PRIEDE, I. Predicting fish behaviour in
BORTONE, S. A. A perspective of artificial reef research: the past, present, and future. Bull. mar. Sci., v. 78, p. 1-8, 2006.
BORTONE, S. A.; SAMOILYS, M. A.; FRANCOUR, P. Fish and macroinvertebrate evaluation. In: SEAMAN JR, W. (Ed.). Artificial reef evaluation with application to natural marine habitats. Boca Raton, Fla.: CRC Press , 2000.
CAPPO, M.; HARVEY, E.; MALCOLM, H.; SPEARE, P. Potential of video techniques to monitor diversity, abundance and size of fish in studies of Marine Protected Areas. In: BEUMER, J. P.; GRANT, A.; SMITH, D. C. (Ed.). Aquatic Protected Areas - what works best and how do we know? WORLD CONGRESS ON AQUATIC PROTECTED AREAS, 2003, Cairns, Australia.
CAPPO, M.; SPEARE, P.; DEATH, G. Comparison of baited remote underwater video stations (BRUVS) and prawn (shrimp) trawls for assessments of fish biodiversity in inter-reefal areas of the Great Barrier Reef Marine Park. J. expl marine Biology and Ecology, v. 302, p. 123-152, 2004.
CAPPO, M.; HARVEY, E. S.; SHORTIS, M. R. Counting and measuring fish with baited video techniques - an overview. In: LYLE, J. M.; FURLANI, D. M.; BUXTON, C. D. (Ed.) . AFSB CONFERENCE AND WORKSHOP “CUTTING-EDGE TECHNOLOGIES IN FISH AND FISHERIES SCIENCE”, 2006, Hobart, Tasmania… Workshop Proceedings … Australian Society for Fish Biology, 2006.
CHOU, W.-R.; TEW, K. S.; FANG, L.-S. Long-term monitoring of the demersal fish community in a steel-slag disposal area in the coastal waters of Kaohsiung, Taiwan. ICES J. mar. Sci., v. 59, p. 238-242, 2002. CLARKE, K. R. Non parametric multivariate analysis of
changes in community structure. Aust. J. Ecol., v. 18, p. 117-143, 1993.
CLARKE, K. R.; WARWICK, R. M. Changes in marine communities: An approach to statistical analysis and interpretation, Plymouth: Primer-E, 2001.
CLAUDET, J.; PELLETIER, D. Marine protected areas and artificial reefs: A review of the interactions between management and scientific studies. Aquat. Living Resour., v. 17, p. 129-138, 2004.
COLLINS, M. A.; YAU, C.; GUILFOYLE, F.; BAGLEY, P.; EVERSON, I.; PRIEDE, I. G.; AGNEW, D. Assessment of stone crab (Lithodidae) density on the South Georgia slope using baited video cameras. ICES J. mar. Sci., v. 59, p. 370, 2002.
CONNELL, S. D.; KINGSFORD, M. J. Spatial, temporal and habitat-related variation in the abundance of large predatory fish at One Tree Reef, Australia. Coral Reefs, v. 17, p. 49-57, 1998.
ERICSON, G.; CAPPO, M. BRUVS Tape Reading Interface. 2.1 ed. Townsville, QLD, Australia: Australian Institute of Marine Science, 2006.
FARNSWORTH, K. D.; THYGESEN, U. H.; DITLEVSEN, S.; KING, N. J. How to estimate scavenger fish abundance using baited camera data. Mar. Ecol. Progr. Ser., v. 350, p. 223, 2007.
FRANCOUR, P.; LIRET, C.; HARVEY, E. Comparison of fish abundance estimates made by remote underwater video and visual census. Naturalista Siciliano, v. 23, p. 155-168, 1999.
GANNON, J. E.; DANEHY, R. J.; ANDERSON, J. W.; MERRITT, G.; BADER, A. P. The ecology of natural shoals in Lake Ontario and their importance to artificial reef development. In: D’ITRI, F. M. (Ed.). Artificial reefs: Marine and freshwater applications. Chelsea: Lewis Publishers, 1985.
HARVEY, E. S.; CAPPO, M.; BUTLER, J. J.; HALL, N.; KENDRICK, G. A. Bait attraction affects the performance of remote underwater video stations in assessment of demersal fish community structure. Mar. Ecol. Progr. Ser., v. 350, p.245-254, 2007.
JENNINGS, S.; POLUNIN, N. V. C. Biased underwater visual census biomass estimates for target-species in tropical reef fisheries. J.Fish Biol., v. 47, p. 733-736, 1995.
KELCH, D. O.; SNYDER, F. L.; REUTTER, J. M. Artificial reefs in Lake Erie: biological impacts of habitat alteration. In: BENAKA, L. R. (Ed.). Fish habitat - essential fish habitat and rehabilitation. AMERICAN FISHERIES SOCIETY SYMPOSIUM, 1999, Bethesda. KULBICKI, M. How the acquired behaviour of commercial
reef fishes may influence the results obtained from visual censuses. J. expl mar. Biol. Ecol., v. 222, p. 11-30, 1998.
LANGLOIS, T.; CHABANET, P.; PELLETIER, D.; HARVEY, E. Baited underwater video for assessing reef fish populations in marine reserves. Fish. Newsl. South Pacific Commission, v. 118, p.53, 2006.
LEGENDRE, P.; LEGENDRE, L. Numerical ecology. 2nd English ed. Amsterdam: Elsevier Science , 1998. LINCOLN SMITH, M. P. Improving multispecies rocky reef
fish censuses by counting different groups of species using different procedures. Environ. Biol. Fishes, v. 26, p. 29-37, 1989.
LIPEJ, L.; BONACA, M. O.; SISKO, M. Coastal fish diversity in three marine protected areas and one unprotected area in the Gulf of Trieste (Northern Adriatic). Mar. Ecol., v. 24, p. 259-273, 2003. MACNEIL, M. A.; GRAHAM, N. A. J.; CONROY, M. J.;
FONNESBECK, C. J.; POLUNIN, N. V. C.; RUSHTON, S. P.; CHABANET, P.; MCCLANAHAN, T. R. Detection heterogeneity in underwater visual-census data. J. Fish Biol., v. 73, p. 1748-1763, 2008. NAKAMURA, M. Evolution of artificial fishing reef
concepts in Japan. Bull. mar. Sci., v. 37, p. 271-278, 1985.
PICKERING, H.; WHITMARSH, D. Artificial reefs and fisheries exploitation: a review of the "attraction versus production" debate, the influence of design and its significance for policy. Fish. Res., v. 31, p. 39-59, 1997.
PRIEDE, I. G.; MERRETT, N. R. Estimation of abundance of abyssal demersal fishes; a comparison of data from trawls and baited cameras. J. Fish Biol., v. 49, p. 207-216, 1996.
PRIEDE, I. G.; MERRETT, N. R. The relationship between numbers of fish attracted to baited cameras and population density: studies on demersal grenadiers Coryphaenoides (Nematonurus) armatus in the abyssal NE Atlantic Ocean. Fish. Res., v.36, p. 133-137, 1998. RANDALL, J. E. An analysis of the fish populations of
RELINI, G.; RELINI, M.; PALANDRI, G.; MERELLO, S.; BECCORNIA, E. History, ecology and trends for artificial reefs of the Ligurian sea, Italy. Hydrobiologia, v. 580, p.193-217, 2007.
SALE, P. F. Assemblages of fish on patch reefs - predictable or unpredictable? Environ. Biol. Fishes, v. 5, p.243-249, 1980.
SALE, P. F. Visual census of fishes: how well do we see what is there. In: INTERNATIONAL CORAL REEF SYMPOSIUM., 8., 1997. Proceedings…, 1997. SAMOILYS, M. A.; CARLOS, G. Determining methods of
underwater visual census for estimating the abundance of coral reef fishes. Environ. Biol. Fishes, v. 57, p. 289-304, 2000.
SMITH, M. P. L. Effects of observer swimming speed on sample counts of temperate rocky reef fish assemblages. Mar. Ecol. Progr. Ser., v. 43, p. 223-231, 1988. STARCK, W. A. A list of fishes of Alligator Reef, Florida
with comments on the nature of the Florida reef fish fauna. Undersea Biol., v. 1, p. 4-40, 1968.
STOBART, B.; GARCIA-CHARTON, J. A.; ESPEJO, C.; ROCHEL, E.; GONI, R.; RENONES, O.; HERRERO, A.; CRECHRIOU, R.; POLTI, S.; MARCOS, C.; PLANES, S.; PEREZ-RUZAFA, A. A baited underwater video technique to assess shallow-water Mediterranean fish assemblages: Methodological evaluation. J. expl mar. Biol. Ecol., v. 345, 2007.
TESSIER, E.; CHABANET, P.; POTHIN, K.; SORIA, M.; LASSERRE, G. Visual censuses of tropical fish aggregations on artificial reefs: slate versus video recording techniques. J. expl mar. Biol. Ecol., v. 315, 17-30, 2005.
THOMPSON, A. A.; MAPSTONE, B. D. Observer effects and training in underwater visual surveys of reef fishes. Mar.Ecol. Progr. Ser., v. 154, 53-63, 1997.
THRESHER, R. E.; GUNN, J. S. Comparative analysis of visual census techniques for highly mobile, reef-associated piscivores (Carangidae). Environ. Biol. Fishes, v. 17, p. 93-116, 1986.
WANTIEZ, L.; THOLLOT, P. Colonization of the F/V Calédonie Toho 2 wreck by a reef-fish assemblage near Nouméa (New Calédonia). Atoll Res. Bull, v. 485, p. 19, 2000.
WATSON, D.; HARVEY, E.; ANDERSON, M.; KENDRICK, G. A comparison of temperate reef fish assemblages recorded by three underwater stereo-video techniques. Mar. Biol., v. 148, p. 415-425, 2005. WILDING, T. A.; SAYER, M. D. J. Evaluating artificial reef
performance: approaches to pre- and post-deployment research. ICES J. mar. Sci., v. 59, S222-230, 2002. WILLIS, T. J.; MILLAR, R. B.; BABCOCK, R. C. Detection
of spatial variability in relative density of fishes: Comparison of visual census, angling, and baited underwater video. Mar. Ecol. Progr. Ser., v. 198, p. 249-260, 2000.
WILLIS, T. J.; MILLAR, R. B.; BABCOCK, R. C. Protection of exploited fish in temperate regions: high density and biomass of snapper Pagrus auratus (Sparidae) in northern New Zealand marine reserves. J. appl. Ecol., v. 40, p. 214-227, 2003.
(Manuscript received 24 May 2010; revised 12 April 2011; accepted 15 June 2011)