Article
Lipid Accumulation Product Is Associated with Insulin
Resistance, Lipid Peroxidation, and Systemic Inflammation
in Type 2 Diabetic Patients
Parvin Mirmiran1, Zahra Bahadoran1, Fereidoun Azizi2
1Nutrition and Endocrine Research Center, and Obesity Research Center, 2Endocrine Research Center, Research Institute for
Endocrine Sciences, Shahid Beheshti University of Medical Sciences, Tehran, Iran
Background: Lipid accumulation product (LAP) is a novel biomarker of central lipid accumulation related to risk of diabetes and cardiovascular disease. In this study, we assessed the association of LAP with glucose homeostasis, lipid and lipid peroxida-tion, and subclinical systemic inflammation in diabetic patients.
Methods: Thirty-nine male and 47 female type 2 diabetic patients were assessed for anthropometrics and biochemical measure-ments. LAP was calculated as [waist circumference (cm)–65]×[triglycerides (mmol/L)] in men, and [waist circumference (cm)– 58]×[triglycerides (mmol/L)] in women. Associations of LAP with fasting glucose, insulin, insulin resistance index, lipid and li-poprotein levels, malondialdehyde, and high-sensitive C-reactive protein (hs-CRP) were assessed.
Results: Mean age and LAP index were 53.6±9.6 and 51.9±31.2 years, respectively. After adjustments for age, sex and body mass index status, a significant positive correlation was observed between LAP index and fasting glucose (r=0.39, P<0.001), and homeostasis model assessment of insulin resistance (r=0.31, P<0.05). After additional adjustment for fasting glucose levels, antidiabetic and antilipidemic drugs, the LAP index was also correlated to total cholesterol (r=0.45, P<0.001), high density lipo-protein cholesterol (HDL-C) levels (r=–0.29, P<0.05), triglycerides to HDL-C ratio (r=0.89, P<0.001), malondialdehyde (r=0.65, P<0.001), and hs-CRP levels (r=0.27, P<0.05).
Conclusion: Higher central lipid accumulation in diabetic patients was related to higher insulin resistance, oxidative stress and systemic inflammation.
Keywords: Diabetes mellitus, type 2; Lipid accumulation product; Subclinical inflammation; Oxidative stress
INTRODUCTION
Lipid accumulation product (LAP) index, a newly developed biomarker of central lipid accumulation, has been proposed as an accurate and independent indicator of the risk of insulin
re-sistance, metabolic syndrome, type 2 diabetes and cardiovascu-lar disease [1-3]. LAP, which is estimated based on the combi-nation of waist circumference (WC) and triglyceride levels, and is compared to anthropometric measures, including body mass index (BMI), WC, and waist to hip ratio, has recently been
con-Received: 17 January 2014, Revised: 24 February 2014, 5 April 2014,
Accepted: 9 April 2014
Corresponding author: Fereidoun Azizi
Endocrine Research Center, Research Institute for Endocrine Sciences, Shahid Beheshti University of Medical Sciences, P.O.Box 19395-4763, Tehran, Iran
Tel: +98-21-224-32500, Fax: +98- 21-224-16264,
E-mail: [email protected]
Copyright © 2014 Korean Endocrine Society
sidered a better predictor of all-cause and cardiovascular mor-tality as well as diabetes development in different ages and eth-nic populations [4-6]. Since LAP was developed taking into account both triglyceride levels and WC, it is suggested that this index has a stronger correlation with visceral adiposity, higher levels of lypolysis and adipocytokines including inter-leukin-6, and plasminogen activator inhibitor-1 [7]. Recent studies report that higher LAP is related to abnormal glucose homeostasis and insulin resistance, as well as elevated alanine aminotransferase, an indicator of the hepatic feature of meta-bolic syndrome, in apparently healthy individuals [8,9]. Higher LAP was also found to be related to lower levels of sex-hor-mone-binding globulin and higher free androgen index as po-tential mediators of cardiovascular disease [10].
Despite data available regarding the association of LAP and cardiometabolic risk factors in healthy populations, little is known concerning LAP and the metabolic status of diabetic patients. Our primary focus in this study was to assess whether LAP index could be related to glucose homeostasis parame-ters, lipid and lipoprotein levels, lipid peroxidation, and sub-clinical systemic inflammation in type 2 diabetic patients.
METHODS
Study population
This study was conducted from April 2012 to January 2013. Men and women, aged 25 to 60 years, with a clinical diagno-sis of type 2 diabetes for at least 1 year, were recruited from the Iran Diabetes Society and the endocrine clinic of Taleghani Medical Center. Patients were excluded from the study if they had severe impairment of cardiac, hepatic or renal function, gestation or lactation and if they used insulin injection or con-sumed dietary supplements. Finally, 86 of the initially eligible patients, were included in the study. Written informed consent was obtained from all participants. Ethics approval for the trial was obtained from the Ethical Committee of the Research In-stitute for Endocrine Sciences, Shahid Beheshti University of Medical Sciences.
Demographics, anthropometrics, and clinical measurement
Trained interviewers collected information using the pretested questionnaires. Information on age, educational levels, medi-cal history and medications, duration of diabetes and oral anti-diabetic drugs, was collected. Anthropometric measurements were assessed by trained staff. Weight was measured to the
nearest 100 g using digital scales, while the subjects were minimally clothed, without shoes. Height was measured to the nearest 0.5 cm, in a standing position without shoes, using a tape measure. BMI was calculated as weight (kg), divided by the square of the height (m2
). WC was measured to the nearest 0.1 cm, midway between the lower border of the ribs and the iliac crest at the widest portion, over light clothing, using a soft measuring tape, without any pressure to the body.
Biochemical measurement
For all biochemical measurements, 12-hour fasting blood sam-ples were collected into tubes containing 0.1% Ethylenediami-netetraacetic acid disodium salt dihydrate and were centrifuged at 4◦C and 500 g for 10 minutes to separate plasma. Fasting se-rum glucose was measured by the enzymatic colorimetric method using a glucose oxidation kit (Pars Azmun Co., Teh-ran, Iran). Serum insulin concentrations were measured using an enzyme-linked immunosorbent assay (ELISAs) kit (Merco-dia, Uppsala, Sweden). Insulin resistance was estimated using the homeostasis model assessment of insulin resistance (HOMA-IR) index, which is defined as fasting plasma insulin (mU/L) multiplied by the fasting plasma glucose (mmol/L) di-vided by 22.5.
Serum total cholesterol and triglyceride levels were mea-sured by enzymatic colorimetric analysis with cholesterol es-terase/cholesterol oxidase and glycerol phosphate oxidase, re-spectively (Pars Azmun Co.). High density lipoprotein choles-terol (HDL-C) was measured by the immunoturbidimetry method after precipitation of apo B-containing lipoproteins with phosphotungstic acid (Pars Azmun Co.). Low density li-poprotein-cholesterol was calculated from serum total choles-terol, triglycerides and HDL-C, according to the Friedewald equation.
Serum high-sensitive C-reactive protein (hs-CRP; pg/mL) concentration was measured using the ELISA kit (Diagnostics Biochem Canada Inc., Thames Centre, Ontario, Canada). Serum malondialdehyde (MDA) was measured spectrophotometrically by the thiobarbituric acid reactive substances (TBARs) assay kit (Cayman Chemical Inc., Ann Arbor, MI, USA). Inter- and intra-assay coefficients of variations of all intra-assays were <5%.
Statistical methods
The Kolmogorov-Smirnov test was used to test for normal distributions. If the variable was not normally distributed, log-arithm of the skewed variable was entered in the models. The LAP index was categorized into quartiles (<24.5, 24.5 to 43.9, 44 to 65.5, and >65.5) metabolic parameters of the patients were compared across the quartile categories using the general linear models with adjustments for age and gender. A partial correlation test with adjustments for age, sex, antidiabetic and antilipidemic drugs, BMI status (≤24.9, 25 to 29.9, ≥30) and fasting glucose levels was used to clarify the association of LAP index and BMI with glucose homeostasis parameters, lipid and lipoprotein levels, MDA, and hs-CRP. To better esti-mate the association of LAP and the mentioned parameters, linear regression curve estimation analysis was also conducted and significant associations were presented as plots. Statistical analysis was performed with SPSS version 16.0 (SPSS Inc., Chicago, IL, USA). A P<0.05 was considered significant.
RESULTS
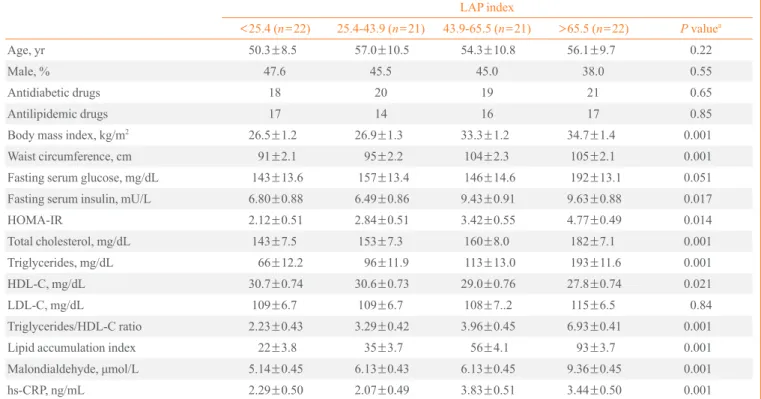
The mean age of participants was 53.6±9.6 years, and 45% were men. The mean of LAP index was 22±3.8, 35±3.7, 56± 4.1, and 93±3.7 in the 1st, 2nd, 3rd, and 4th quartile categories of LAP, respectively. Table 1 presents the characteristics, bio-chemical and anthropometric values of the participants across quartile categories of LAP index. Participants in the highest quartile of LAP also had higher BMI. A significant increasing trend of serum fasting glucose, insulin, insulin resistance in-dex, and total cholesterol levels was observed across increas-ing LAP. Mean levels of HDL-C significantly decreased across increasing LAP quartiles. Compared to the lowest quartile cat-egory of LAP index, participants in the highest had higher tri-glyceride/HDL-C ratios, MDA and hs-CRP levels. Partial cor-relation coefficients of LAP index and BMI with metabolic parameters are presented in Table 2. After adjustments for age, sex and BMI status, significant positive correlations were ob-served between LAP index and fasting glucose (r=0.39, P<0.001), and LAP index and HOMA-IR (r=0.31, P<0.05).
Table 1. Demographics, Anthropometric Measurements, and Cardiometabolic Risk Factors of the Patients by Categories of LAP Index
LAP index
<25.4 (n=22) 25.4-43.9 (n=21) 43.9-65.5 (n=21) >65.5 (n=22) P valuea Age, yr 50.3±8.5 57.0±10.5 54.3±10.8 56.1±9.7 0.22
Male, % 47.6 45.5 45.0 38.0 0.55
Antidiabetic drugs 18 20 19 21 0.65
Antilipidemic drugs 17 14 16 17 0.85
Body mass index, kg/m2 26.5±1.2 26.9±1.3 33.3±1.2 34.7±1.4 0.001
Waist circumference, cm 91±2.1 95±2.2 104±2.3 105±2.1 0.001
Fasting serum glucose, mg/dL 143±13.6 157±13.4 146±14.6 192±13.1 0.051
Fasting serum insulin, mU/L 6.80±0.88 6.49±0.86 9.43±0.91 9.63±0.88 0.017
HOMA-IR 2.12±0.51 2.84±0.51 3.42±0.55 4.77±0.49 0.014
Total cholesterol, mg/dL 143±7.5 153±7.3 160±8.0 182±7.1 0.001
Triglycerides, mg/dL 66±12.2 96±11.9 113±13.0 193±11.6 0.001
HDL-C, mg/dL 30.7±0.74 30.6±0.73 29.0±0.76 27.8±0.74 0.021
LDL-C, mg/dL 109±6.7 109±6.7 108±7..2 115±6.5 0.84
Triglycerides/HDL-C ratio 2.23±0.43 3.29±0.42 3.96±0.45 6.93±0.41 0.001
Lipid accumulation index 22±3.8 35±3.7 56±4.1 93±3.7 0.001 Malondialdehyde, μmol/L 5.14±0.45 6.13±0.43 6.13±0.45 9.36±0.45 0.001 hs-CRP, ng/mL 2.29±0.50 2.07±0.49 3.83±0.51 3.44±0.50 0.001
Values are expressed as mean±SEM.
LAP, lipid accumulation product; HOMA-IR, homeostatic model assessment of insulin resistance; HDL-C, high density lipoprotein cholesterol; LDL-C, low density lipoprotein cholesterol; hs-CRP, high-sensitive C-reactive protein.
After additional adjustment for fasting glucose levels, antidia-betic and antilipidemic drugs, it was found that total cholester-ol (r=0.45, P<0.001), HDL-C levels (r=–0.29, P<0.05), tri-glyceride/HDL-C ratio (r=0.89, P<0.001), MDA (r=0.65, P<0.001), and hs-CRP levels (r=0.27, P<0.05) were also correlated to the LAP index. There were significant correla-tions between BMI and serum insulin (r=0.44, P<0.01), HOMA-IR (r=0.29, P<0.05), triglyceride/HDL-C ratio (r= 0.28, P<0.05), and hs-CRP levels (r=0.40, P<0.01). Curve es-timation plots are presented in Fig. 1. Significant linear asso-ciations between LAP index with fasting glucose, HOMA-IR, and total cholesterol levels were observed. Triglyceride/HDL-C ratio (β=0.91, P<0.001), MDA (β=0.58, P<0.001), and hs-CRP levels (β=0.27, P<0.05) also had linear associations with the LAP index.
DISCUSSION
In the current cross-sectional study, a higher LAP index was related to higher fasting glucose and insulin resistance in type 2 diabetic patients. Central lipid accumulation was also corre-lated with total cholesterol, HDL-C and triglyceride/HDL-C ratio, independent of fasting serum glucose. Moreover, a strong correlation between LAP, MDA and hs-CRP levels was ob-served.
LAP has previously been reported as a predictor of diabetes, metabolic syndrome, and cardiovascular disease [2-6]. The odds ratio of diabetes in subjects with high LAP was 7.40 (95% confidence interval [CI], 5.10 to 10.75) and 19.09 (95% CI, 6.57 to 55.50) in Japanese men and women, respectively [1]. Some previous studies indicated that, compared to other anthropometric measures such as WC and BMI, LAP could be considered a better predictor of diabetes development and car-diovascular disease risk [4-6]. A recent cross-sectional study on 2,524 nondiabetic Chinese subjects showed that, compared to BMI and WC, LAP had a greater impact on the insulin re-sistance index [13]. In an analysis conducted in the third Na-tional Health and Nutrition Examination Survey, LAP had bet-ter correlation with cardiovascular risk factors, including lipid risk variables, uric acid concentration, and heart rate, among US adults compared to BMI [3]. A possible explanation for these observations may be that the two components of LAP, abdominal fat and triglyceride concentrations, have greater physiological correlations with lipid and lipoprotein metabo-lism, as well as lipoprotein particle size, compared to BMI (describing lipid over-accumulation) [3]. In our study, com-pared to BMI, LAP had greater correlation with fasting serum glucose, lipid and lipoprotein parameters, and lipid peroxida-tion index. BMI rather than LAP was correlated with serum insulin and hs-CRP; the association of both BMI and LAP with HOMA-IR were similar.
In young healthy Korean women, higher LAP was also re-lated to higher postprandial glucose levels, insulin response and homeostatic assessment model of insulin resistance [8]. Polycystic ovary syndrome patients in the higher quartile of LAP, had a risk of impaired glucose tolerance of 41.81 (95% CI, 5.52 to 316.54) [14]. An 11-year follow-up of nondiabetic patients showed that visceral adiposity, but not abdominal subcutaneous fat, directly measured by computed tomography (CT) scan as the volume of intra-abdominal fat at the umbili-cus level, was an independent predictor of insulin resistance [15]. In the current study, the insulin resistance index in pa-tients with higher visceral lipid accumulation was twice as high (4.77±0.49 vs. 2.12±0.51, in the first and fourth quar-tiles, respectively). Some possible mechanisms have been pro-posed regarding the association of visceral fat and insulin re-sistance; first, visceral fat, compared to subcutaneous fat, has a higher rate of lypolysis and subsequently, could produce a higher free fatty acid load, which leads to fat accumulation in the liver and induces insulin resistance; second, adipocyto-kines derived from the visceral fat may be responsible for in-Table 2. The Correlation of LAP Index and BMI with Glucose
Homeostasis Parameters, Lipid and lipoprotein Levels, Lipid Peroxidation and Systemic Inflammation
Variable Partial correlation
r (P value)
LAP BMI
Fasting serum glucosea 0.39 (0.001) 0.12 (0.24)
Fasting serum insulina 0.15 (0.24) 0.44 (0.004)
HOMA-IRa 0.31 (0.014) 0.29 (0.04)
Total cholesterolb
0.45 (0.001) 0.17 (0.16)
HDL-Cb –0.29 (0.021) –0.19 (0.13)
LDL-Cb 0.02 (0.85) 0.04 (0.41)
Triglycerides/HDL-C ratiob 0.89 (0.001) 0.28 (0.05)
Malondialdehydeb
0.65 (0.001) 0.18 (0.20)
hs-CRPb 0.27 (0.032) 0.40 (0.01)
LAP, lipid accumulation product; BMI, body mass index; HOMA-IR, homeostatic model assessment of insulin resistance; HDL-C, high density lipoprotein cholesterol; LDL-C, low density lipoprotein cho-lesterol; hs-CRP, high-sensitive C-reactive protein.
aAdjusted for age, sex, and BMI status (for LAP only); bAdditionally
duction of insulin resistance [16].
Another finding of this study was the strong association of LAP with total cholesterol, HDL-C levels and triglyceride/ HDL-C ratio, independent risk factors of cardiovascular dis-ease. LAP has been correlated with total cholesterol (r=0.498,
P<0.001), and HDL-C (r=–0.319, P=0.026) [10]. In a previ-ous study, visceral adipose tissue assessed by CT scan was significantly related to apolipoprotein B (β=1.33, P=0.001) and HDL-C (β=–1.89, P=0.004) [11]. Another study also showed that visceral fat accumulation was correlated with Fig. 1. Linear association of lipid accumulation product (LAP) and metabolic parameters in type 2 diabetic patients (regression curve es-timation models were used). (A) Linear association of LAP and malondialdehyde (β=0.58, P<0.01). (B) Linear association of LAP with C-reactive protein (β=0.27, P<0.05). (C) Linear association of LAP with the triglycerides to high density lipoprotein cholesterol
(HDL-C) ratio (β=0.91, P<0.01). (D) Linear association of LAP with fasting serum glucose (β=0.39, P<0.05). (E) Linear association of LAP
with homeostasis model assessment of insulin resistance (β=0.31, P<0.05). (F) Linear association of LAP with serum total cholesterol
(β=0.42, P<0.01).
12
10
8
6
4
2
0 50 100 150
Lipid accumulation product Malondialdehyde (μmol/L)
A
350
300
250
200
150
100
50
0 50 100 150
Fasting blood glucose (mg/dL)
Lipid accumulation product D
10
8
6
4
2
0
0 50 100 150
Lipid accumulation product High sensitive C-reactive protein (ng/mL)
B
12
10
8
6
4
2
0 50 100 150
Homeostatic model assessment of insulin resistance
Lipid accumulation product E
12.5
10
7.5
5
2.5
0
0 50 100 150
Lipid accumulation product Triglycerides to HDL-C ratio
C
300
250
200
150
100
50
0 50 100 150
Serum total cholesterol (mg/dL)
apolipoprotein B (r=0.26, P<0.05), and HDL-C (r=–0.26,
P<0.05) [12]. Abnormal levels of adipocytokines caused by higher levels of visceral adiposity, including decreased levels of adiponectin and increased levels of visfatin, have been sug-gested as mediators of dyslipidemia [17]. Triglyceride/HDL-C ratio in patients with higher LAP was more than 3-fold (6.93± 0.41 vs. 2.23±0.43, in the first and fourth quartiles, respec-tively); this ratio is directly related to lipoprotein particle size and the risk of atherosclerosis [18,19].
In the current study, LAP was strongly correlated with MDA, an important biomarker of lipid peroxidation and oxi-dative stress, independent of age, gender, and fasting glucose levels. Although the association between LAP and oxidative stress parameters has not yet been determined, previous stud-ies have reported that higher visceral adiposity induced oxida-tive stress and lipid peroxidation. In healthy men and women, TBARs as biomarkers of systemic oxidative stress were posi-tively related to visceral adipose tissue and development of subclinical atherosclerosis [20]. Visceral fat was also correlat-ed with serum TBARs/cholesterol ratio (r=0.541, P<0.001) in patients with metabolic syndrome [21]. Moreover, visceral fat was reported as a significant determinant of expression of genes related to oxidative stress [22].
A moderately significant correlation between LAP and hs-CRP (r=0.25, P=0.007), an indicator of subclinical systemic inflammation, was also observed in this study. A similar asso-ciation was recently reported in postmenopausal women (r=0.315, P=0.042) [10]. It is well known that obesity and in-creased visceral adipocytes contribute to inin-creased levels of several inflammatory proteins such as CRP, interleukine-6, plasminogen activator inhibitor-1, P-selectin, vascular cell ad-hesion molecule 1, fibrinogen, and α1-acid glycoprotein [23, 24]. In a prospective cohort, a 6-year follow-up of middle-aged individuals showed that increases in visceral adiposity, measured by CT scan, were associated with increased levels of CRP (r2=
17.9%) [25].
Although, previous studies have indicated that LAP index is correlated to some cardiometabolic risk factors, to our knowl-edge these associations in diabetic patients are reported for the first time in this study. Moreover the correlation between LAP and oxidative stress in diabetic patients has not been previous-ly reported. There were some limitations which might be con-sidered important in the current study: cross-sectional setting and small sample size. Also, some potentially confounding variables including duration of diabetes, levels of glycosylated hemoglobin, and chronic vascular complications in diabetic
patients have been not considered in the analysis. In addition, the validity of HOMA-IR as an insulin resistance parameter has not validated in the patients.
In conclusion, LAP showed strong associations with glu-cose hemostasis parameters, lipid and lipoprotein levels, ath-erosclerotic lipid parameters, lipid peroxidation, and a sub-clinical inflammatory marker in type 2 diabetic patients. It is plausible to suggest that LAP may be a useful and simple clin-ical marker for assessment of cardiometabolic risk factors in type 2 diabetic patients. Further studies of longer durations are recommended to better estimate the power of LAP in the pre-diction of diabetes complications.
CONFLICTS OF INTEREST
No potential conflict of interest relevant to this article was re-ported.
ACKNOWLEDGMENTS
This study was funded by the Research Institute of Endocrine Sciences, Shahid Beheshti University of Medical Sciences, Tehran, Iran. The authors express appreciation to the partici-pants of this study. The authors wish to thank Ms. N. Shiva for critical editing of English grammar and syntax of the manu-script.
REFERENCES
1. Wakabayashi I, Daimon T. A strong association between lip-id accumulation product and diabetes mellitus in japanese women and men. J Atheroscler Thromb 2014;21:282-8.
2. Xiang S, Hua F, Chen L, Tang Y, Jiang X, Liu Z. Lipid accu-mulation product is related to metabolic syndrome in women with polycystic ovary syndrome. Exp Clin Endocrinol Dia-betes 2013;121:115-8.
3. Kahn HS. The “lipid accumulation product” performs bet-ter than the body mass index for recognizing cardiovascular risk: a population-based comparison. BMC Cardiovasc Disord 2005;5:26.
4. Ioachimescu AG, Brennan DM, Hoar BM, Hoogwerf BJ. The lipid accumulation product and all-cause mortality in patients at high cardiovascular risk: a PreCIS database study. Obesity (Silver Spring) 2010;18:1836-44.
in-creased mortality in normal weight postmenopausal wom-en. Obesity (Silver Spring) 2011;19:1873-80.
6. Yang C, Guo ZR, Hu XS, Zhou ZY, Wu M. A prospective study on the association between lipid accumulation prod-uct or body mass index and diabetes. Zhonghua Liu Xing Bing Xue Za Zhi 2010;31:5-8.
7. Chiang JK, Koo M. Lipid accumulation product: a simple and accurate index for predicting metabolic syndrome in Taiwanese people aged 50 and over. BMC Cardiovasc Dis-ord 2012;12:78.
8. Oh JY, Sung YA, Lee HJ. The lipid accumulation product as a useful index for identifying abnormal glucose regula-tion in young Korean women. Diabet Med 2013;30:436-42.
9. Ji BL, Li R, Zhang SH, Gong LL, Wang ZH, Ren W, Li QF. The lipid accumulation product is highly related to se-rum alanine aminotransferase level in male adults. Nutr Res 2012;32:581-7.
10. Maturana MA, Moreira RM, Spritzer PM. Lipid accumu-lation product (LAP) is related to androgenicity and car-diovascular risk factors in postmenopausal women. Ma-turitas 2011;70:395-9.
11. Onat A, Avci GS, Barlan MM, Uyarel H, Uzunlar B, San-soy V. Measures of abdominal obesity assessed for visceral adiposity and relation to coronary risk. Int J Obes Relat Metab Disord 2004;28:1018-25.
12. Ribeiro-Filho FF, Faria AN, Kohlmann O Jr, Ajzen S, Ri-beiro AB, Zanella MT, Ferreira SR. Ultrasonography for the evaluation of visceral fat and cardiovascular risk. Hy-pertension 2001;38(3 Pt 2):713-7.
13. Xia C, Li R, Zhang S, Gong L, Ren W, Wang Z, Li Q. Lip-id accumulation product is a powerful index for recogniz-ing insulin resistance in non-diabetic individuals. Eur J Clin Nutr 2012;66:1035-8.
14. Wehr E, Gruber HJ, Giuliani A, Moller R, Pieber TR, Obermayer-Pietsch B. The lipid accumulation product is associated with impaired glucose tolerance in PCOS wom-en. J Clin Endocrinol Metab 2011;96:E986-90.
15. Hayashi T, Boyko EJ, McNeely MJ, Leonetti DL, Kahn SE, Fujimoto WY. Visceral adiposity, not abdominal subcutane-ous fat area, is associated with an increase in future insulin re-sistance in Japanese Americans. Diabetes 2008;57:1269-75.
16. Jensen MD. Adipose tissue as an endocrine organ: implica-tions of its distribution on free fatty acid metabolism. Eur
Heart J Suppl 2006;8(Suppl B):B13-9.
17. Indulekha K, Anjana RM, Surendar J, Mohan V. Associa-tion of visceral and subcutaneous fat with glucose intoler-ance, insulin resistintoler-ance, adipocytokines and inflammatory markers in Asian Indians (CURES-113). Clin Biochem 2011;44:281-7.
18. Dobiasova M, Frohlich J. The plasma parameter log (TG/ HDL-C) as an atherogenic index: correlation with lipopro-tein particle size and esterification rate in apoB-lipoprolipopro-tein- apoB-lipoprotein-depleted plasma (FER(HDL)). Clin Biochem 2001;34:583-8.
19. Frohlich J, Dobiasova M. Fractional esterification rate of cholesterol and ratio of triglycerides to HDL-cholesterol are powerful predictors of positive findings on coronary angiography. Clin Chem 2003;49:1873-80.
20. Lear SA, Sarna LK, Siow TJ, Mancini GB, Siow YL, O K. Oxidative stress is associated with visceral adipose tissue and subclinical atherosclerosis in a healthy multi-ethnic population. Appl Physiol Nutr Metab 2012;37:1164-70.
21. Palmieri VO, Grattagliano I, Portincasa P, Palasciano G. Systemic oxidative alterations are associated with visceral adiposity and liver steatosis in patients with metabolic syn-drome. J Nutr 2006;136:3022-6.
22. Yamaoka M, Maeda N, Nakamura S, Kashine S, Nakaga-wa Y, Hiuge-Shimizu A, Okita K, ImagaNakaga-wa A, MatsuzaNakaga-wa Y, Matsubara K, Funahashi T, Shimomura I. A pilot inves-tigation of visceral fat adiposity and gene expression pro-file in peripheral blood cells. PLoS One 2012;7:e47377.
23. Freedland ES. Role of a critical visceral adipose tissue threshold (CVATT) in metabolic syndrome: implications for controlling dietary carbohydrates: a review. Nutr Metab (Lond) 2004;1:12.
24. Calabro P, Golia E, Maddaloni V, Malvezzi M, Casillo B, Marotta C, Calabro R, Golino P. Adipose tissue-mediated inflammation: the missing link between obesity and car-diovascular disease? Intern Emerg Med 2009;4:25-34.