Genome-Wide Identification of HrpL-Regulated Genes in
the Necrotrophic Phytopathogen
Dickeya dadantii
3937
Shihui Yang1¤a, Quan Peng1, Qiu Zhang1¤b, Lifang Zou1, Yan Li1,2, Christelle Robert3, Leighton Pritchard3, Hui Liu3, Raymond Hovey1, Qi Wang2, Paul Birch3, Ian K. Toth3*, Ching-Hong Yang1* 1Department of Biological Sciences, University of Wisconsin, Milwaukee, Wisconsin, United States of America,2Department of Plant Pathology, China Agricultural University, Beijing, China,3Plant Pathology, Scottish Crop Research Institute, Invergowrie, Dundee, United Kingdom
Abstract
Background: Dickeya dadantii is a necrotrophic pathogen causing disease in many plants. Previous studies have
demonstrated that the type III secretion system (T3SS) ofD. dadantiiis required for full virulence. HrpL is an alternative sigma factor that binds to thehrpbox promoter sequence of T3SS genes to up-regulate their expression.
Methodology/Principal Findings: To explore the inventory of HrpL-regulated genes of D. dadantii 3937 (3937),
transcriptome profiles of wild-type 3937 and ahrpLmutant grown in a T3SS-inducing medium were examined. Using a cut-off value of 1.5, significant differential expression was observed in sixty-three genes, which are involved in various cellular functions such as type III secretion, chemotaxis, metabolism, regulation, and stress response. A hidden Markov model (HMM) was used to predict candidatehrpbox binding sites in the intergenic regions of 3937, including the promoter regions of HrpL-regulated genes identified in the microarray assay. In contrast to biotrophic phytopathgens such as
Pseudomonas syringae,among the HrpL up-regulated genes in 3937 only those within the T3SS were found to contain ahrp
box sequence. Moreover, direct binding of purified HrpL protein to thehrpbox was demonstrated forhrpbox-containing DNA fragments ofhrpAandhrpNusing the electrophoretic mobility shift assay (EMSA). In this study, a putative T3SS effector DspA/E was also identified as a HrpL-upregulated gene, and shown to be translocated into plant cells in a T3SS-dependent manner.
Conclusion/Significances:We provide the genome-wide study of HrpL-regulated genes in a necrotrophic phytopathogen
(D. dadantii 3937) through a combination of transcriptomics and bioinformatics, which led to identification of several effectors. Our study indicates the extent of differences for T3SS effector protein inventory requirements between necrotrophic and biotrophic pathogens, and may allow the development of different strategies for disease control for these different groups of pathogens.
Citation:Yang S, Peng Q, Zhang Q, Zou L, Li Y, et al. (2010) Genome-Wide Identification of HrpL-Regulated Genes in the Necrotrophic PhytopathogenDickeya dadantii3937. PLoS ONE 5(10): e13472. doi:10.1371/journal.pone.0013472
Editor:Geraldine Butler, University College Dublin, Ireland
ReceivedMarch 16, 2010;AcceptedSeptember 30, 2010;PublishedOctober 19, 2010
Copyright:ß2010 Yang et al. This is an open-access article distributed under the terms of the Creative Commons Attribution License, which permits unrestricted use, distribution, and reproduction in any medium, provided the original author and source are credited.
Funding:This project is supported by grants from the National Science Foundation (award no. EF-0332163), the Research Growth Initiative of the University of Wisconsin-Milwaukee, the Scottish Government Rural and Environment Research and Analysis Directorate (RERAD), and the State Scholarship Fund of the China Scholarship Council awarded to Yan Li. The funders had no role in study design, data collection and analysis, decision to publish, or preparation of the manuscript.
Competing Interests:The authors have declared that no competing interests exist.
* E-mail: chyang@uwm.edu (CHY); Ian.Toth@scri.ac.uk (IKT)
¤a Current address: Biosciences Division and BioEnergy Science Center, Oak Ridge National Laboratory, Oak Ridge, Tennessee, United States of America ¤b Current address: Chemical Sciences Division, Oak Ridge National Laboratory, Oak Ridge, Tennessee, United States of America
Introduction
The type III secretion system (T3SS) is an essential virulence determinant of many bacterial pathogens that delivers effector proteins into host tissues. In plant pathogens such asPseudomonas
spp., Dickeya spp., Erwinia spp., Pantoea spp., Ralstonia spp., and
Xanthomonasspp., the T3SS is required for bacterial pathogenicity on host plants and for elicitation of the hypersensitive response (HR), a localized programmed cell death, in non-host plants [1–4]. The T3SS genes of phytobacteria are induced in the plant apoplast, when in close contact with host cells or in nutritionally poor synthetic T3SS-inducing minimal medium, which is thought to mimic conditions within the plant apoplast [1,2,4].
Expression of the T3SS in bacteria is coordinately regulated by networks of transcription factors in response to environmental
stimuli. Based on differences in regulation, T3SSs can be divided into two groups. The Group I system is found inP. syringae,Dickeya, Erwinia, and Pantoea spp., where T3SS genes are activated by HrpL, a member of the extracytoplasmic factor (ECF) family alternative sigma factor [5,6]. The Group II system is found inX. campestris and R. solanacearum, where transcription of T3SS-associated genes is regulated by members of the AraC family of transcriptional proteins [4,6–8].
downstream in the type III secretion regulon. In 3937, the T3SS genes are also regulated by an alternative pathway in which the RsmA protein down-regulates T3SS genes by affecting the mRNA stability and translation of hrpL. Another TCS GacS/GacA activates an untranslated regulatory RNArsmB, which sequesters RsmA and neutralizes its effect onhrpL[10,11,14].
Different modes of infection are used by phytopathogens to invade plant hosts. Biotrophic phytopathogens, such asP. syringae, keep the host plant cells alive and rely on living cells for growth and tissue colonization. Necrotrophic pathogens such as D. dadantii, on the other hand, kill plant cells upon tissue colonization by producing toxic proteins or plant cell wall degrading enzymes (PCWDEs), including pectinases [15–18]. Although it is becoming clear that phytopathogens may engage in either or both of these processes at different times of the infection process, for convenience the above, rather strict, definitions will be used throughout the manuscript [19].
In most biotrophic phytopathogens, T3SS deficient mutants are significantly attenuated in virulence [2,5,6,20–22]. However, due to the production of PCWDEs, T3SS mutants of 3937 still cause maceration but are delayed in initial multiplication within the plant [17,23].
To further expand our knowledge in this area, microarray and bioinformatics analyses were used to investigate HrpL-controlled genes within 3937 on a genome-wide scale, and the interaction of the HrpL protein with promoter regions of T3SS genes was further studied. In addition, the ability of the T3SS to translocate the 3937 effector protein DspA/E was demonstrated using a calmodulin-dependent adenylate cyclase (Cya) as a reporter.
Results
Use of transcriptomics to identify HrpL-regulated genes Although HrpL is considered to be the major sigma factor controlling many T3SS genes in several biotrophic phytopatho-gens, limited information is available describing the mechanism by which HrpL, the alternative sigma factor of a necrotrophic pathogen such asD. dadantiiregulates T3SS gene expression. To explore the inventory of HrpL-regulated genes in 3937, the transcriptome profile differences between wild-type 3937 and a
hrpLmutant WPP96 (Supplementary Table S1) were compared by microarray analysis. The microarray results are based on the geomean of ten normalized expression values derived from three biological replicates and two dye-swap experiments with a technical replicate for each array.
Based on our microarray assays, we identified 63 genes that were differentially regulated between 3937 and WPP96. Approx-imately 40% of these genes were up-regulated by HrpL with the arbitrary cut-off value of 1.5-fold difference (Table 1 and Table 2; Supplementary Fig. S1, S2). The HrpL-up-regulated T3SS genes are classified into two major categories; 1) T3SS substrate genes
dspA/E, hrpA, hrpK, hrpN,andhrpW; and 2) T3SS apparatus genes
hrpP, hrcQ, hrpG, and hrpF. In addition, orfC (a potential hrpW
chaperone), and two proteins of unknown function located in the
hrpcluster were also up-regulated by HrpL (Table 1). Other HrpL up-regulated genes identified in the microarray assay included those with functions related to regulation and chemotaxis, as well as others with unknown function (Table 1; Supplementary Fig. S1). In our microarray assay, two thirds of the HrpL-down-regulated genes have unknown functions, and the remainder are possibly involved in regulation, transportation, metabolism, or stress response (Table 2; Supplementary Fig. S1).
Our microarray data correlated well with the qRT-PCR results. Out of the 16 HrpL-regulated genes examined by qRT-PCR, only
gene ASAP15704 (Bcr/CflA subfamily drug resistance transporter) exhibited a microarray expression pattern that did not correspond to the qRT-PCR value. ASAP15704 appeared to be up-regulated in the microarray assay. However, the qRT-PCR result showed down-regulation without significant difference (Table 1). Due to extremely low expression of the dspA/E gene in thehrpLmutant, Ct value in thehrpLmutant background was high (greater than 35) compared to Ct value of 27 in wild-type 3937 background, which causes the large qPCR value variation although the qRT-PCR also indicated that dspA/Eis upregulated by HrpL (Table 1, 2). However, evendspA/E was not included in the qRT-PCR and microarray correlation calculation, there is still reasonably high correlation (R2= 0.63) between the microarray and qPCR results for the remaining 15 genes (Table 1, 2).
Bioinformatics-based determination of HrpL-regulated genes
To further characterize the set of D. dadantii HrpL-regulated genes, a hidden Markov model (HMM) was used to analyze thehrp
box consensus sequence of 3937. Using 69hrp boxes from four species as training sets (Supplementary Table S2), we identified 73 genes with a potential hrp box, although only 11 genes with HMMER bit scores .8.5 were considered as reliable (Supple-mentary Table S3).
Among the HrpL up-regulated genes identified in the micro-array assay, onlyhrpA, hrpF, hrpJ, hrpK, hrpN, andhrpWwere found to contain ahrpbox sequence in their promoter regions (bit score .8.5). Surprisingly, dspA/E was not included in this list of predictedhrpboxes, which may be due to the presence of a mis-predicted CDS in the source genome that would obscure identification of ahrpbox (Supplementary Table S3).
HrpL specifically binds to promoter regions of T3SS genes together with RNAP
HrpL is suggested to form a complex with core RNA polymerase (RNAP) and bind to the hrp box sequence in the promoter regions of T3SS genes of phytopathogens. However, few reports have demonstrated a direct interaction between HrpL and RNAP at specific regulatory regions for T3SS genes. In our microarray assayhrpAandhrpNwere found to be up-regulated by HrpL (Table 1). In addition, the HMM analysis (Supplementary Table S3) identified putativehrp box sequences in the promoter regions ofhrpAandhrpN(putativehrpbox is underlined and listed in Supplementary Table S1).
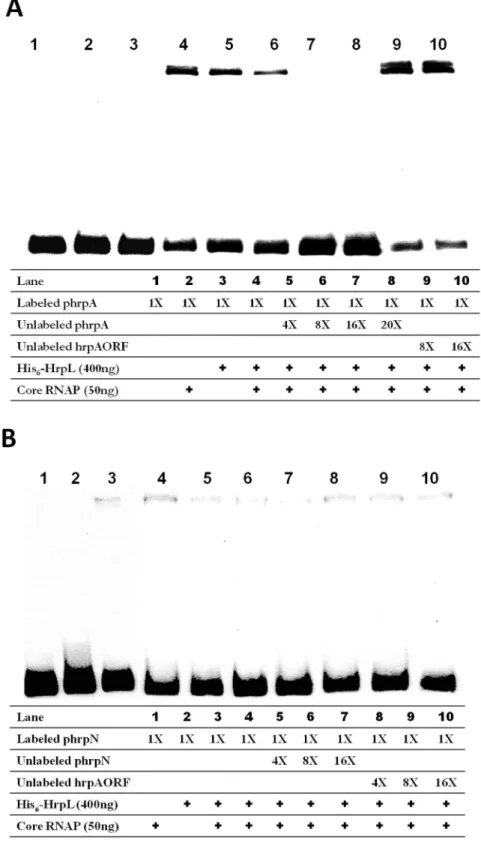
To study the interaction of the HrpL protein with the promoter regions ofhrpAandhrpNin 3937, an electrophoretic mobility shift assay (EMSA) was employed. RNAP (Epicentre Technologies, Madison, WI) and the His6-tagged HrpL (His6-HrpL) were incubated together with digoxigenin (DIG) labeled DNA frag-ments of hrpA or hrpN promoter regions containing hrp box sequences. Neither the His6-HrpL nor RNAP alone showed detectable binding to thehrpbox DNAs ofhrpAandhrpN(Fig. 1). However, mobility of the DNA fragments was retarded whenhrp
box DNA ofhrpAorhrpNwas incubated with RNAP and His6 -HrpL (Fig. 1), indicative of the requirement of RNAP in the binding of HrpL to these DNA fragments.
In addition, the specificity of RNAP-His6-HrpL binding to the promoter regions of hrpA and hrpN was demonstrated by a competition assay. Unlabeled DNA fragments of hrpA or hrpN
promoter regions were able to compete with DIG-labeledhrpAor
compete with the labeledhrpApromoter region (Fig. 1A) or labeled
hrpNpromoter region (Fig. 1B). These results are different from the competition effect observed with unlabeled promoter regions of T3SS genes (Fig. 1), and suggest specific binding between the RNAP-His6-HrpL complex and the promoter regions ofhrpAand
hrpN(Fig. 1).
The T3SS effector DspA/E is translocated into the plant host through a functional T3SS
Among all of the HrpL up-regulated genes identified in the microarray study (Table 1) and HMM bioinformatics prediction (Supplementary Table S3),dspA/Eis the only gene confirmed to encode a potential T3SS effector in 3937 [24]. In several phytopathogens, T3SS effectors function inside the host cytosol and interfere with host defenses by targeting the host cytoskeleton
and defense system [25]. While several studies have demonstrated that the T3SS inD. dadantiiplays a role in pathogenicity during the initial stages of infection [20,21,23,26,27], there has been no direct evidence for the translocation of effectors by this T3SS to the plant cytosol.
The Cya protein is a calmodulin-dependent adenylate cyclase that has been widely used as a reporter to study the translocation of proteins by bacterial pathogens [28–31]. Cya is active only upon delivery into the host cell cytosol, where it elevates cyclic AMP levels [32]. To investigate the translocation of DspA/E from 3937 into plant host cells, the Cya protein from Bordetella pertussiswas used as a reporter [32]. Cya was fused to the C-terminal end of full-length DspA/E, or to the first 315 amino acids of the protein, resulting in DspE-Cya and DspE315-Cya fusion proteins, respec-tively (Supplementary Table 1). The corresponding plasmids were
Table 1.HrpL up-regulated genes inDickeya dadantii3937.
ASAP ID Gene Product Microarray Ratioa qRT-PCR Ratioc hrpboxd
T3SS
15579 hrpJ HrpJ 2.21b
+
15584 hrpP HrpP 1.98b
15585 hrcQ HrcQ 2.12b
19004 hrpK HrpK 2.07b 7.22
62.29* +
19006 orfC HrpW chaperone 2.53b 7.7662.02*
19007 Unknown protein 2.67b
19008 Unknown protein 2.35b
19009 hrpW HrpW 1.94b
+
19012 dspA/E DspA/E 1.66 200.12682.82e*
19593 hrpA HrpA 13.33 +
20784 hrpN HrpN 9.08 +
20865 hrpG HrpG 1.74b
20866 hrpF HrpF 2.17b
+
Regulator
18408 dcuS Signal transduction histidine kinase 1.83
Metabolism
17589 cyoE Protoheme IX farnesyltransferase (haeme O biosynthesis) 1.60 1.2860.67 Transporter
15704 Drug resistance transporter Bcr/CflA subfamily 2.00 0.5660.13
Chemotaxis
17896 Methyl-accepting chemotaxis protein 1.69
18765 Methyl-accepting chemotaxis protein 1.51
Unknown
14661 Unknown protein 1.50
15855 Conserved unknown protein 1.55
17664 Unknown protein 1.70
18251 Conserved unknown protein 1.52
18705 Unknown protein 1.78
19405 Unknown protein 1.51
a: Ratio for 3937 wild type/hrpLmutant is the geomean of ten arrays (five slides, each slide has two arrays) from three biological replicates. HrpL up-regulated genes
have the transcript abundances differing by 1.5-fold and SAM q-value less than 1% in minimal medium 6 h post inoculation at 28uC. Genes in bold font had at least a 2-fold change.
b: Several genes in one operon or overlapped genes are regulated. c: The ratio of qRT-PCR from three replicates.
d: Hrp box was predicted with a hidden Markov model (HMM).
e: Ct value of qRT-PCR fordspA/EinhrpLmutant is 35 and 27 in wild-type strain 3937.
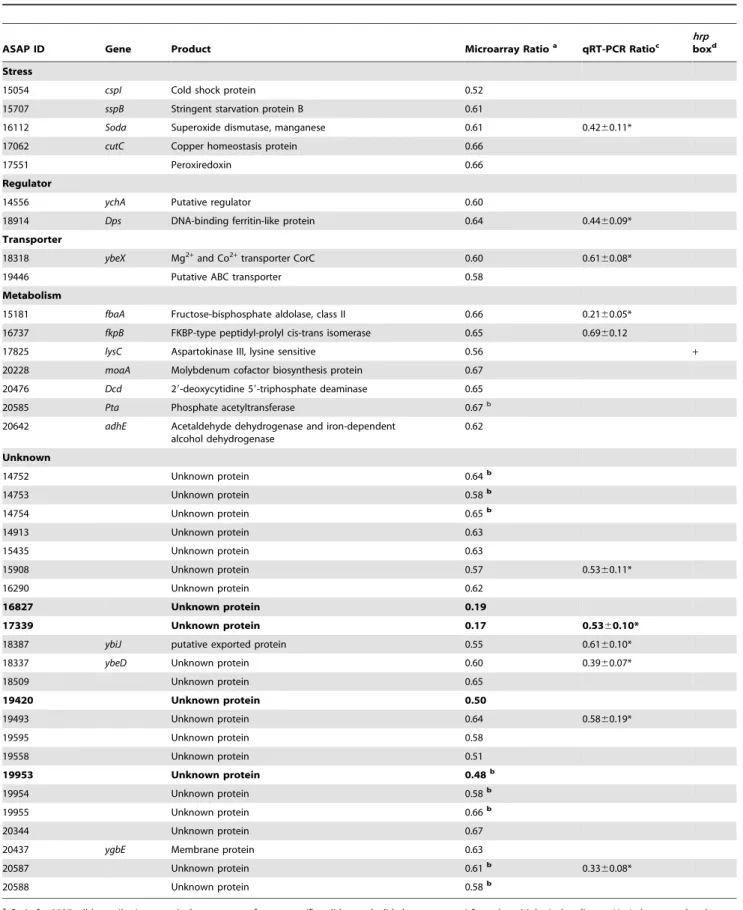
Table 2.HrpL down-regulated genes inDickeya dadantii3937.
ASAP ID Gene Product Microarray Ratioa qRT-PCR Ratioc
hrp
boxd
Stress
15054 cspI Cold shock protein 0.52
15707 sspB Stringent starvation protein B 0.61
16112 Soda Superoxide dismutase, manganese 0.61 0.4260.11*
17062 cutC Copper homeostasis protein 0.66
17551 Peroxiredoxin 0.66
Regulator
14556 ychA Putative regulator 0.60
18914 Dps DNA-binding ferritin-like protein 0.64 0.4460.09*
Transporter
18318 ybeX Mg2+
and Co2+
transporter CorC 0.60 0.6160.08*
19446 Putative ABC transporter 0.58
Metabolism
15181 fbaA Fructose-bisphosphate aldolase, class II 0.66 0.2160.05*
16737 fkpB FKBP-type peptidyl-prolyl cis-trans isomerase 0.65 0.6960.12
17825 lysC Aspartokinase III, lysine sensitive 0.56 +
20228 moaA Molybdenum cofactor biosynthesis protein 0.67
20476 Dcd 29-deoxycytidine 59-triphosphate deaminase 0.65
20585 Pta Phosphate acetyltransferase 0.67b
20642 adhE Acetaldehyde dehydrogenase and iron-dependent alcohol dehydrogenase
0.62
Unknown
14752 Unknown protein 0.64b
14753 Unknown protein 0.58b
14754 Unknown protein 0.65b
14913 Unknown protein 0.63
15435 Unknown protein 0.63
15908 Unknown protein 0.57 0.5360.11*
16290 Unknown protein 0.62
16827 Unknown protein 0.19
17339 Unknown protein 0.17 0.5360.10*
18387 ybiJ putative exported protein 0.55 0.6160.10*
18337 ybeD Unknown protein 0.60 0.3960.07*
18509 Unknown protein 0.65
19420 Unknown protein 0.50
19493 Unknown protein 0.64 0.5860.19*
19595 Unknown protein 0.58
19558 Unknown protein 0.51
19953 Unknown protein 0.48b
19954 Unknown protein 0.58b
19955 Unknown protein 0.66b
20344 Unknown protein 0.67
20437 ygbE Membrane protein 0.63
20587 Unknown protein 0.61b 0.33
60.08*
20588 Unknown protein 0.58b
a: Ratio for 3937 wild-type/hrpLmutant is the geomean of ten arrays (five slides, each slide has two arrays) from three biological replicates. HrpL down-regulated genes
have the transcript abundances differing by 1.5-fold and SAM q-value less than 1% in minimal medium 6 h post inoculation at 28uC. Genes in bold font had at least a 2-fold change.
b: Several genes in one operon or overlapped genes are regulated. c: The ratio of qRT-PCR from three replicates.
d: Hrp box was predicted with a hidden Markov model (HMM).
Figure 1. HrpL binds tohrpbox specifically.hrpAorhrpNpromoter regions containing thehrpbox were amplified by PCR and labeled with digoxigenin (DIG) (Pierce, Rockford, IL). The core RNAP or His6-HrpL sigma factor alone were mixed with 200 fmol labeled DNA probe (16) (Lane 1–2);
or core RNAP and His6-HrpL sigma factor mixture together with 16labeled DNA probe were mixed with same unlabelled DNA probe with various
concentrations up to 4000 fmol (206), or up to 3200 fmol (166) of unlabeled internal fragment of thehrpAgene.A: Labeled and unlabeledhrpA
promoter region containinghrpbox and the control fragments for thehrpAORF region withouthrpbox (hrpAORF) were used.B: Labeled and unlabelledhrpNpromoter region containinghrpbox and the control fragments for thehrpAORF region withouthrpbox were used.
transformed into a 3937outCmutant strain A1919, and anoutC/
hrcV double mutant strain Ech141. outC encodes an inner membrane protein of the type II secretion system (T2SS), which is responsible for the secretion of PCWDEs, including pectinases. Mutations in outC therefore prevent secretion of these enzymes and, in turn, reduce or eliminate plant cell maceration [33].hrcV
encodes a structural component of the T3SS, and a mutation in this gene is expected to prevent translocation of T3SS-dependent proteins [34].
AnoutCmutant strain A1919 and anoutC/hrcVdouble mutant strain Ech141 carrying constructs that encode either full-length DspA/E (pDspE-Cya) or the first 315 amino acids of DspA/E (pDspE315-Cya) fused to Cya were infiltrated into Nicotiana
benthamiana, and the concentration of cAMP (picomoles of cAMP per microgram of protein,6standard errors) was determined 7 h post infiltration. Compared with the cAMP concentration (0.0360.01) forN. benthamiana leaves infiltrated with the T2SS/ T3SS double mutant strain Ech141 harboring pDspE-Cya, a significantly higher concentration of cAMP (0.9760.04;p= 0.018, t-test) was observed in N. benthamianaleaves infiltrated with the T2SS mutant A1919 carrying pDspE-Cya (Table 3). Similarly, the concentration of cAMP (0.8060.02) from N. benthamiana leaves infiltrated with A1919 (pDspE315-Cya) was significantly higher than the concentration (0.0460.04;p= 0.003, t-test) from Ech141 (pDspE315-Cya). These results demonstrate that DspA/E of 3937 is translocated into the cytosol of N. benthamiana in a T3SS-dependent manner, and that the 315-amino-acid N-terminal fragment contains the translocation signal.
As a negative control, theN. benthamianaleaves infiltrated with buffer only had a cAMP level of 0.0260.00. In addition, Cya fusion proteins (p20514-Cya and p20422-Cya) were constructed with genes unrelated to T3SS (Supplementary Table S1). p20514-Cya and p20422-p20514-Cya contain full length genes that encode a putative cytoplasmic protein and the DNA-binding transcriptional regulatory protein FabR, respectively. No significant amount of cAMP was detected inNicotiana benthamianaleaves infiltrated with the wild-type strain carrying p20514-Cya or p20422-Cya (0.0160.00 and 0.0160.01, respectively).
Discussion
Many hypersensitive response and pathogenicity (Hrp) outer proteins (Hops) and effectors have been discovered in biotrophic
phytopathogens, includingP. syringae[5,25,35–38]. In this report, microarray analysis with the necrotrophic pathogen 3937 and its
hrpLmutant demonstrated that the only known effector,dspA/E,is up-regulated by HrpL. Similarly, only a limited number of T3SS-related genes were predicted to contain a hrp box based on an HMM search using promoter regions of genes identified in the microarray as being up-regulated by HrpL (Supplementary Table S3). These genes includehrpK, hrpN, hrpFin thehrpFoperon,hrpJ
in thehrpJ operon,hrpWin thedspA/Eoperon, and hrpAin the
hrpAoperon (Supplementary Table S3; Supplementary Fig. S2). When applied to all 3937 intergenic regions, the HMM predicts only five additional hrp boxes with confidence (Supplementary Table S3; Supplementary Fig. S2). Although the microarray assay results demonstrated more HrpL-downregulated genes than those upregulated by HrpL (Table 1, 2; Supplementary Fig. S2), none of the HrpL-downregulated genes had ahrpbox HMM prediction with a high confidence level (Table 2; Supplementary Table S4; Supplementary Fig. S2H-I). Nearly half of the HrpL-upregulated genes were annotated as T3SS associated genes in the 3937 genome and about half of the highly confident HMM predicted genes were also identified by microarray (Table 1; Supplementary Table S4; Supplementary Fig. S2E-F). The correlation among T3SS genes identified by genome annotation, microarray, and HMM prediction indicates that HrpL majorly upregulates T3SS genes, and the genes down-regulated by HrpL may be due to indirect regulation (Table 1, 2; Supplementary Table S4; Supplementary Fig. S2).
In addition, ten T3SS associated genes in the 3937 genome were determined to be up-regulated by microarray with an arbitrary cut-off value of 1.5-fold change. The number of T3SS genes identified by microarray drops significantly from ten to six HrpL-upregulated genes if the array cut-off value is set at a 2-fold difference (Table 1, Supplementary Table S4; Supplementary Fig. S2). Although there may be some false-positive HrpL-regulated genes identified using a 1.5-fold cut-off value, the false-negative rate is likely to increase if we apply a 2-fold change cut-off value in this study. In contrast, the number of genes in common among the set of T3SS associated genes in the 3937 genome and the HMM predicted genes did not change when the confidence level of the HMM prediction increased (Table 1, 2; Supplementary Table S4; Supplementary Fig. S2). Therefore, we used a 1.5-fold cut-off value for microarray analysis and a confidence level (HMM score) of 8.5.
If it is to be assumed that all T3SS effectors are preceded by a HrpL binding site, then this would imply that 3937 contains very few potential effectors. An alternative explanation is that some lower confidence hrp box predictions are in fact valid HrpL binding sites. Although the reason for 3937 and related necrorophic pathogens to have so few predicted effectors compared to biotrophic pathogens is unknown, and with the proviso that more may yet be discovered, it is possible that this low number is associated with the different modes of infection employed by necrotrophic and biotrophic plant pathogens. In biotrophic phytopathogens, the T3SS appears to be the major virulence determinant and is required for the bacterium to disarm the host defense responses during bacterial invasion.
InD. dadantii, however, the pectinases secreted from the T2SS play a more important role in pathogenesis [17,39]. Rather than eliminating pathogenicity, most T3SS mutants ofD. dadantiishow a delayed maceration of plant tissues [21,23,27]. This suggests that the T3SS of D. dadantii functions to promote the initial establishment of the bacterium in host plants during the early stages of infection. This is supported by evidence that the T3SS genes of D. dadantii are expressed during the early stages of
Table 3.Calmodulin-dependent adenylate cyclase activity of
Dickeya dadantiistrains, A1919 and Ech141, carrying DspE-Cya and DspE315-Cya hybrid protein constructs inNicotiana benthamiana.
DspE-Cya DspE315-Cya
A1919 0.9760.04 0.8060.02
Ech141 0.0360.01 0.0460.04
AnoutCmutant strain A1919 and anoutC/hrcVdouble mutant strain Ech141 carrying constructs that encoded either full-length DspE (pDspE-Cya) or the first 315 amino acids of DspE (pDspE315-Cya) fused to Cya were infiltrated intoN.
benthamianaat an OD600of 0.3. cAMP production was assayed 7 h post
infiltration as described [30]. cAMP was quantified in triplicate for each sample, cAMP levels are reported in picomoles of cAMP per micrograms of protein with standard errors. This experiment was performed twice and similar results were observed. Values are a representative of these two experiments. TheN. benthamianaleaves infiltrated with buffer only demonstrated a cAMP level of 0.0260.00.
infection [9], together with a delay in the expression of pectate lyases [9,40]. However, this hypothesis remains to be tested forD. dadantiias recent transcriptome data from the related pathogen,
Pectobacterium atrosepticum, suggest that the T3SS may be under quorum sensing control and, therefore, coordinately expressed later in infection together with the PCWDEs [41]. The finding that thehrp box sequence was mainly found in the T3SS genes identified in our microarray assay, suggests that many of the other genes identified in this array may be indirectly regulated by HrpL. Finally, although some T3SS genes e.g. dspF (ASAP19013) identified in the 3937 genome sequence (https://asap.ahabs. wisc.edu/asap/ASAP1.htm) were differentially expressed, they were below the cut-off value of 1.5-fold change and thus not included in Table 1.
HrpL is an RpoN-dependent ECF family sigma factor that regulates the expression of many T3SS genes, including those encoding effectors and assembly of the T3SS apparatus. It is suggested that HrpL associates with the core RNA polymerase and binds to thehrpbox consensus sequence in the promoter regions of T3SS genes to initiate transcription [25]. In this study, a direct interaction between the HrpL protein and the promoter regions of
hrpA (Fig. 1A) andhrpN(Fig. 1B) in 3937 was demonstrated by EMSA. The competition assays indicated that the binding between HrpL and the promoter regions of hrpA and hrpN was specific, suggesting that the HrpL protein directly regulates the transcriptional expression of these genes. In addition, the binding affinity of HrpL for thehrpbox of different T3SS genes is different. For example, the binding of HrpL to thehrpbox ofhrpA(Fig. 1A) seems to be stronger than to that ofhrpN(Fig. 1B). When added to a mixture of core RNAP and His6-HrpL sigma factor, the band intensity (Fig. 1A) was stronger using ahrpAlabeled DNA probe than when the same amount (200 fmol) of hrpN labeled DNA probe was used (Fig. 1B). Interestingly, we observed a correlation between the binding affinity of HrpL and the expression level of HrpL-induced genes: the relatively higher affinity of HrpL for the
hrpA promoter (Fig. 1A) renders hrpA expression over four-fold higher than that ofhrpNbased on the microarray data (Table 1). The calmodulin-dependent Cya protein is not secreted or translocated by the T3SS, [32], and is inactive inside the bacterial cytosol due to the absence of calmodulin. These properties make Cya a good reporter for T3SS translocation research in bacterial pathogens [28–31]. To avoid false positive results during our analysis of T3SS translocation as a consequence of plant tissue maceration by pectinases secreted from 3937, anoutCmutant was used. This mutant is unable to secrete pectinases through the T2SS [33]. hrcVencodes an inner membrane structural compo-nent of the T3SS apparatus and is essential for secretion of effectors [34]. We used single mutants of eitheroutC, orhrcVand a double mutantoutC/hrcVto demonstrate that DspA/E from 3937 is delivered into the plant cytosol in a T3SS-dependent manner. In addition, a plasmid containing only the first 315 amino acids of DspA/E was used to show that the T3SS secretion signal is located in the first one-fifth of the N-terminus of the DspA/E protein. This latter result is consistent with other reports, where T3SS secretion signals have been found within the first 20–150 amino acids of T3SS substrates [42–45].
In summary, using microarrays, hrp binding site prediction, EMSA, and Cya translocation assays, we provide the genome-wide study of HrpL-regulated genes in a necrotrophic phytopath-ogen. Specific binding between the alternative sigma factor HrpL and promoter regions of T3SS geneshrpAandhrpNwas observed. Finally, in sharp contrast to the biotrophic pathogenP. syringaepv.
tomato, only a single effector (DpsA/E) has so far been identified in 3937, which we have shown to be translocated by the 3937 T3SS
into the plant cytosol, where it functions in virulence. The T3SS in this necrotrophic pathogen may thus play a minor role during infection compared to biotrophic pathogens, instead relying more on its ability to physically attack the plant through the production of PCWDEs.
Materials and Methods
Bacterial strains and plasmids
Bacterial strains, plasmids, and primers used in this study are listed in Supplementary Table S1. Wild-type 3937 and its mutant strains were stored at –80uC in 15% glycerol and grown on Luria-Bertani (LB) agar or T3SS-inducing minimal medium (MM) [9]. Plasmids were isolated fromEscherichia coliDH5ausing QIAprep Spin Miniprep Kit (Qiagen, Valencia, CA). Plasmids were introduced into bacterial strains by electroporation using a Gene Pulser Electroporation system (Bio-Rad, Hercules, CA). Antibiot-ics were used at the following concentrations: ampicillin, 100mg/ mL; chloramphenicol, 50mg/mL; kanamycin, 50mg/mL; specti-nomycin, 50mg/mL. ThehrpL mutant WPP96 was used in this microarray assay, and this mutant was complemented by plasmid
phrpLin a previous study [12].
Construction of mutants
To construct theoutC/hrcVdouble mutant, a 2119-bpBamH
I-XhoI fragment containing the fullhrcVORF was amplified using primers hrcV-F and hrcV-R. This fragment was digested byPstI and re-ligated following removal of a 417-bp internal region of
hrcV. The recombinant fragment was inserted into pWM91 at the
BamHI and XhoI sites, resulting in the plasmid pWM91DhrcV (Supplementary Table S1). The plasmid was introduced into the
outCmutant strain A1919, and theoutC/hrcVdouble mutant was generated by homologous recombination and verified by DNA sequencing analysis.
RNA isolation and preparation of labeled cDNA
Wild-type D. dadantii 3937 and WPP96 were grown in T3SS-inducing minimal medium for 6 h, and total RNA was isolated using a Bio-Rad Aurum Total RNA Mini Kit as described by the manufacturer (Bio-Rad, Hercules, CA). RNA was quantified using a ND-100 spectrophotometer (NanoDrop Technologies, Wilming-ton, DE), and the quality was assessed on an agarose gel.
RNA was labeled as previously described [46] with minor modifications. Briefly, 12mg of total RNA was labeled in a 45-mL labeling reaction with 10mL of a combination of 1mL of spike RNA mix (GE Healthcare, Piscataway, NJ), 1.8mL of 256amino allyl deoxynucleoside triphosphate (dNTP) mixture [5mL each of dATP, dCTP, dGTP (100 mM), 2mL dTTP (100 mM), 6mL aminoallyl dUTP, and 17mL SDW], 4.5mL of dithiothreitol (0.1 M), 2mL of 1 mg/mL Oligo dT18 primers (Ambion, Austin, TX), and 2mL of reverse transcriptase in reaction buffer (Ambion, Austin, TX). Primers and RNA were heated to 70uC for 10 min and then cooled on ice following incubation for 2 h at 42uC. The remaining RNA was denatured with 15mL of 1 M NaOH and 15mL of 0.5 M EDTA (pH 8.0) at 65uC for 10 min following neutralization with 15mL of 1 M HCl.
targets were combined and mixed with distilled water and further purified with a QIAGEN MiniElute column (Qiagen, Valencia, CA). The labeling efficiency was estimated with 1mL of the cDNA using a NanoDrop ND-100 spectrophotometer.
Hybridization to DNA microarrays and image analysis D. dadantiimicroarrays (AMADID No. 012716) were developed at the Scottish Crop Research Institute (SCRI), Dundee, UK, through Agilent Technologies, Inc. (Santa Clara, CA) based on the genome sequence of strain 3937. The microarray experiment was carried out as described [46] with minor modifications. Briefly, labeled cDNA was made up to a volume of 80mL with distilled water, denatured at 98uC for 3 min, and then mixed with 25mL of control target and 105mL of 26hybridization buffer (Agilent,
Santa Clara, CA). The hybridization, wash, and dry were carried out in a LucideaTM Slidepro hybridization chamber (GE Healthcare, Piscataway, NJ). After hybridization for 17 h at 60uC, the arrays were washed for 1 min each with wash solution I (66SSPE [16SSPE is 0.18 M NaCl, 10 mM NaH2PO4, and 1 mM EDTA, pH 7.7], 0.005% N-lauroylsarcosine), followed by wash solution II (0.066SSPE, 0.005%N-lauroylsarcosine).
Arrays were scanned using a GenePix 4200A scanner (Molecular Devices, Sunnyvale, CA) with appropriate exposure settings for Cy3 (595 nm) and Cy5 (685 nm) at a 10-mm resolution, generating separate TIFF images. Signal intensity and ratios were generated using GenePix Pro 6 software (Molecular Devices, Sunnyvale, CA). Images were imported and aligned with clone position information (Agilent GAL file) using automated and manual grid alignment features. Median spot and individual median background (annulus setting) intensity values were extracted for each wavelength and imported into analysis software.
Microarray normalization and analysis
Microarray data with intensities reproducibly higher than background from 10 array results of three biological replicate experiments were selected for analysis. Following local background subtraction, the signal for each spot was normalized based on the geomean value of the median intensity of all the spots for each array as described [47]. Each ratio (hrpLmutant/3937 wild type) was converted to its log2 value for Significance Analysis of Microarrays (SAM) software analysis [48]. Genes showing differential expression in the microarray assays were determined by setting the number of falsely called genes to less than one for the significant gene list output. Significant genes compared to the geometric mean of the ratios from ten arrays were considered as HrpL-up-regulated if their level of transcription in thehrpLmutant WPP96 was no more than two-thirds of that observed in the corresponding 3937 wild type. Genes were considered HrpL-down-regulated if their level of transcription was at least 1.5-fold higher in thehrpLmutant WPP96 than that of wild-type 3937. The microarray data have been deposited into the GEO database with an accession number of GSE17185.
Real-time qRT-PCR
For independent confirmation of gene expression results obtained with oligonucleotide microarrays, 3937 and the hrpL
mutant WPP96 were grown in T3SS-inducing minimal medium. Total RNA from the bacteria was isolated using the TRI reagent method (Sigma, St. Louis, MO) and treated with the Turbo DNA-free DNase kit (Ambion, Austin, TX). These RNA preparations were independent from those used for microarray hybridizations. An iScript cDNA Synthesis Kit (Bio-Rad, Hercules, CA) was used to synthesize cDNA from 0.5mg of treated total RNA. The Real Master Mix (Eppendorf, Westbury, NY) was used for a real time
PCR reaction to quantify the cDNA level of target genes in different samples. The rplU gene was used as the endogenous control for data analysis [10]. The primer pairs used in this study are listed in Supplementary Table S1. Reactions were run and data collected using the OpticonTM2 system (Bio-Rad, Hercules, CA). All PCR experiments were performed in triplicate, and standard deviations were calculated.
HrpL binding site prediction by HMM
A training set of 69 HrpL binding sites extending from the236 to27 positions was compiled from literature sources (supplemen-tary Table S2). These sequences were aligned using Jalview [49] and the resulting alignment used as input to construct hidden Markov models (HMMs) with the hmmbuild and hmmcalibrate
packages of HMMer (http://hmmer.janelia.org/). The HMMer packagehmmsearchwas used to query test data sets and the target genome. Parameters for model construction (background and null models, HMMer version) were optimized by ten-fold cross-validation on the 69 sequence dataset. An optimal model was indicated, with a bit-score classifier threshold of 8.5. This model and threshold were applied to intergenic regions derived from the 3937 genome sequence obtained from ASAP (http://asap.ahabs. wisc.edu/software/asap/) to predict candidate HrpL-binding sites.
Expression and purification of His6-HrpL protein
For HrpL protein expression,hrpLwas amplified by PCR using Phusion high-fidelity DNA polymerase (New England Biolabs, Ipswich, MA) from 3937 chromosomal DNA with primer pairs hrpL-PF/hrpL-PR (Supplementary Table S1). PCR fragments were gel purified and ligated into the pENTR/SD/D-TOPO vector (Invitrogen, Carlsbad, CA). The resulting pENTR-HrpL constructs were then digested withNdeI andHindIII and ligated into NdeI/HindIII linearized pET-28a(+) vectors (Novagen, Madison, WI) to produce plasmid phrpL-28a.
An overnight LB culture ofE. coliBL21 (DE3) containing His6 -HrpL encoding plasmids phrpL-28a was subcultured into 100 mL of LB broth containing kanamycin. Bacterial cells were grown at 37uC with shaking until an OD600nmof 0.5 was reached. Following addition of IPTG (isopropyl-beta-thio galactopyranoside) to a final concentration of 1 mM, the culture was incubated for an additional 4 h to induce the expression of the his6-hrpL gene.
The bacterial cells were harvested by centrifugation at 22,0006g,
resuspended in 20 mL of water, and lysed by freezing and thawing. The lysate was sonicated on ice and centrifuged. The insoluble pellet was washed twice with a washing buffer (25% [wt/vol] sucrose, 5 mM EDTA, 1% [vol/vol] Triton X-100 in phosphate-buffered saline) and suspended in 5 mL of denaturing solution (6 M guanidinium hydrochloride, 0.1 M Tris-HCl buffer [pH 8.0], 1 mM EDTA [pH 8.0], 0.03 M b-mercaptoethanol). Protein renaturation was initiated by 20-fold dilution in 0.2 M ammonium acetate (pH 8.5). After 48 h of incubation at room temperature, the insoluble protein was removed by filtration through a 1-mm Whatman filter paper and the soluble protein was precipitated with 55% saturated ammonium sulfate overnight. The precipitate was collected by filtration through a 0.45mm Fisherbrand Nylon filter and solubilized in 2 mL of 10 mM Tris-HCl (pH 8.0). The concentration of purified HrpL protein was measured by the BCA protein assay kit (Bio-Rad, Hercules, CA).
Electrophoretic mobility shift assay
Primers were designed to amplify fragments containing thehrp
box in promoter regions of hrpAand hrpN. PCR products were labeled with DIG using the Biotin 39 end DNA labeling Kit (Pierce, Rockford, IL). In EMSA, a core RNAP (50 ng) (Epicentre Technologies, Madison, WI) was incubated on ice for 20 min with 400 ng of purified His6-HrpL protein. The core RNAP and His6 -HrpL sigma factor mixture was added into eppendorf tubes containing the DNA probe (200 fmol), 1mg Poly (dI?dC), DNA binding buffer, 50% Glyerol, 100 mM MgCl2, and 1% NP-40 (Pierce, Rockford, IL) to give a final volume of 20mL. Following incubation at 28uC for 20 min, the samples were loaded onto a 6% native polyacrylamide gel and eletrophoresed in 0.56TBE.
The DNA probes were transferred to an N-positive nylon membrane and detected according to the manufacturer’s protocol of chemiluminescent nucleic acid detection module (Pierce, Rockford, IL)
Construction ofcyafusion plasmid
The cya fusions were constructed using the Gateway cloning technology (Invitrogen, Carlsbad, CA) as described [30]. In brief, the appropriate PCR products were cloned into the pENTR/SD/ D-TOPO vector (Invitrogen, Carlsbad, CA) to create the entry clone. The PCR products were then transferred by recombination into the destination vector, pCPP3234, which contains the cya
gene without the start codon, to create an in-frame fusion of the target genedspA/Eandcyagenerating the constructs pDspE-Cya and pDspE315-Cya.
Quantification of cAMPin planta
Mutants derived from 3937 were infiltrated into leaves of N. benthamiana at a cell density of 0.3 (OD600nm). Leaf disks were harvested from the infiltrated areas 7 h post infiltration with a 1-cm-diameter cork borer and frozen in liquid nitrogen. Frozen disks were prepared for cAMP quantification as described [30]. The cAMP content in samples was determined with the Correlate-EIA Direct Cyclic AMP Enzyme Immunoassay Kit (Assay Designs, Inc., Ann Arbor, MI), following the manufacturer’s instructions. Protein concentration in the samples was determined with Bio-Rad protein assay kit (Bio-Bio-Rad, Hercules, CA). cAMP was quantified in triplicate for each sample, and reported in picomoles of cAMP per micrograms of protein with standard errors. This experiment was performed twice, and similar results were observed. Values are a representative of these two experiments.
Supporting Information
Table S1 Strains, plasmids, and DNA primers used in this study. Found at: doi:10.1371/journal.pone.0013472.s001 (0.11 MB DOC)
Table S2 The source of each of the hrp boxes comprising the hrp box training set. This data set is made up of sixty-nine sequences from four distinct species which share a recent common ancestor.
Found at: doi:10.1371/journal.pone.0013472.s002 (0.19 MB DOC)
Table S3 HMM predictions of the locations of hrp boxes having bit score greater than the optimal prediction threshold 8.5. Columns represent: Feature ID of Dickeya dadantii 3937 ASAP accession ID of version v6b; HMMer bit score for the prediction; distance between prediction and the closest downstream gene; name of closest downstream gene; annotated product of closest downstream gene; orientation of closest downstream gene; orientation of HMMer prediction.
Found at: doi:10.1371/journal.pone.0013472.s003 (0.13 MB DOC)
Table S4 Genes associated with type III secretion pathway in 3937.
Found at: doi:10.1371/journal.pone.0013472.s004 (0.12 MB DOC)
Figure S1 Functional categories of HrpL-regulated genes by comparing the transcriptome profiles of Dickeya dadantii 3937 wild-type and its hrpL mutant in T3SS inducing minimal medium after 6-h post inoculation at 28oC.
Found at: doi:10.1371/journal.pone.0013472.s005 (0.11 MB DOC)
Figure S2 Correlation among the T3SS genes in 3937 genome, HMM prediction, and microarray results. Genome: Dickeya dadantii 3937 T3SS gene ASAP accession ID of version v6b based on the annotation in ASAP website (Supplemental Table 4). Array_All: all the HrpL-regulated genes from microarray experiment with a cut-off value of 1.5-fold (Table 1, 2). Array_UP: all the HrpL-upregulated genes (Table 1). Array_DOWN: all the downregulated genes (Table 2). Array_2Fold: all the HrpL-regulated genes with cut-off value of 2-fold changes (Bold ones in Table 1, 2). Array_UP_2: HrpL-upregulated genes with at least 2-fold changes (Bold ones in Table 1). Array_DOWN_2: HrpL-downregulated genes with at least 2-fold changes (Bold ones in Table 2). HMM_All: all the genes predicted by HMM (Supplemental Table 3). HMM_SIG: HMM predicted genes with HMM score greater than 8.5 (Bold ones in Supplemental Table 3). Found at: doi:10.1371/journal.pone.0013472.s006 (0.48 MB DOC)
Acknowledgments
This work is dedicated to Professor Noel T. Keen. We thank Guy Condemine (Unite´ Microbiologie Adaptation et Pathoge´nie,UMR 5240 CNRS-UCB-INSA-Bayer CropScience) and Amy Charkowski (University of Wisconsin) for kindly providing us with the mutants A1919 and WPP96 respectively; Lisa M Schechter and Alan Collmer for providing plasmid pCPP3234 and advice on Cya assay; Eulandria Biddle for critical discussions and reading of the manuscript; and Nicole Perna (University of Wisconsin) for providing access to the annotatedD. dadantiigenome sequences (https://asap.ahabs.wisc.edu/asap/ASAP1.htm).
Author Contributions
Conceived and designed the experiments: QW PRB IKT CHY. Performed the experiments: SY QP QZ LZ YL CR LP HL. Analyzed the data: SY QP QZ CR IKT CHY. Contributed reagents/materials/analysis tools: RH. Wrote the paper: SY QP IKT CHY.
References
1. Buttner D, Bonas U (2006) Who comes first? How plant pathogenic bacteria orchestrate type III secretion. Curr Opin Microbiol 9: 193–200.
2. Galan JE, Collmer A (1999) Type III secretion machines: bacterial devices for protein delivery into host cells. Science 284: 1322–1328.
3. He SY, Nomura K, Whittam TS (2004) Type III protein secretion mechanism in mammalian and plant pathogens. Biochim Biophys Acta 1694: 181–206.
4. Mota LJ, Sorg I, Cornelis GR (2005) Type III secretion: the bacteria-eukaryotic cell express. FEMS Microbiol Lett 252: 1–10.
6. Tang X, Xiao Y, Zhou J-M (2006) Regulation of the type III secretion system in phytopathogenic bacteria. Mol Plant-Microbe Interact 19: 1159–1166. 7. Brencic A, Winans SC (2005) Detection of and response to signals involved in
host-microbe interactions by plant-associated bacteria. Microbiol Mol Biol Rev 69: 155–194.
8. Francis MS, Wolf-Watz H, Forsberg A (2002) Regulation of type III secretion systems. Curr Opin Microbiol 5: 166–172.
9. Peng Q, Yang S, Charkowski AO, Yap MN, Steeber DA, et al. (2006) Population behavior analysis ofdspEandpelDregulation inErwinia chrysanthemi 3937. Mol Plant-Microbe Interact 19: 451–457.
10. Yang S, Peng Q, San Francisco M, Wang Y, Zeng Q, et al. (2008) Type III secretion system genes ofDickeya dadantii3937 are induced by plant phenolic acids. PLoS ONE 3: e2973.
11. Yang S, Peng Q, Zhang Q, Yi X, Choi CJ, et al. (2008) Dynamic regulation of GacA in type III secretion, pectinase gene expression, pellicle formation, and pathogenicity ofDickeya dadantii(Erwinia chrysanthemi3937). Mol Plant-Microbe Interact 21: 133–142.
12. Yap MN, Yang CH, Barak JD, Jahn CE, Charkowski AO (2005) TheErwinia chrysanthemitype III secretion system is required for multicellular behavior. J Bacteriol 187: 639–648.
13. Yang S, Zhang Q, Guo J, Charkowski AO, Glick BR, et al. (2007) Global effect of indole-3-acetic acid biosynthesis on multiple virulence factors ofErwinia chrysanthemi3937. Appl Environ Microbiol 73: 1079–1088.
14. Chatterjee A, Cui Y, Chatterjee AK (2002) Regulation of Erwinia carotovora hrpL(Ecc)(sigma-L(Ecc)), which encodes an extracytoplasmic function subfamily of sigma factor required for expression of the HRP regulon. Mol Plant-Microbe Interact 15: 971–980.
15. Franza T, Mahe B, Expert D (2005)Erwinia chrysanthemirequires a second iron transport route dependent of the siderophore achromobactin for extracellular growth and plant infection. Mol Microbiol 55: 261–275.
16. Franza T, Michaud-Soret I, Piquerel P, Expert D (2002) Coupling of iron assimilation and pectinolysis inErwinia chrysanthemi3937. Mol Plant-Microbe Interact 15: 1181–1191.
17. Hugouvieux-Cotte-Pattat N, Condemine G, Nasser W, Reverchon S (1996) Regulation of pectinolysis inErwinia chrysanthemi. Annu Rev Microbiol 50: 213–257.
18. Login FH, Shevchik VE (2006) The single transmembrane segment drives self-assembly of OutC and the formation of a functional type II secretion system in Erwinia chrysanthemi. J Biol Chem 281: 33152–33162.
19. Toth IK, Birch PR (2005) Rotting softly and stealthily. Curr Opin Plant Biol 8: 424–429.
20. Bauer DW, Bogdanove AJ, Beer SV, Collmer A (1994)Erwinia chrysanthemi hrp genes and their involvement in soft rot pathogenesis and elicitation of the hypersensitive response. Mol Plant-Microbe Interact 7: 573–581.
21. Bauer DW, Wei ZM, Beer SV, Collmer A (1995)Erwinia chrysanthemi harpinEch: an elicitor of the hypersensitive response that contributes to soft-rot pathogenesis. Mol Plant-Microbe Interact 8: 484–491.
22. Weber E, Koebnik R (2005) Domain structure of HrpE, the Hrp pilus subunit of Xanthomonas campestrispv.vesicatoria. J Bacteriol 187: 6175–6186.
23. Yang CH, Gavilanes-Ruiz M, Okinaka Y, Vedel R, Berthuy I, et al. (2002)hrp genes ofErwinia chrysanthemi3937 are important virulence factors. Mol Plant-Microbe Interact 15: 472–480.
24. Bogdanove AJ, Kim JF, Wei Z, Kolchinsky P, Charkowski AO, et al. (1998) Homology and functional similarity of an hrp-linked pathogenicity locus,dspEF, ofErwinia amylovoraand the avirulence locusavrEofPseudomonas syringaepathovar tomato. Proc Natl Acad Sci USA 95: 1325–1330.
25. Collmer A, Lindeberg M, Petnicki-Ocwieja T, Schneider DJ, Alfano JR (2002) Genomic mining type III secretion system effectors inPseudomonas syringaeyields new picks for all TTSS prospectors. Trends Microbiol 10: 462–469. 26. Lopez-Solanilla E, Llama-Palacios A, Collmer A, Garcia-Olmedo F,
Rodriguez-Palenzuela P (2001) Relative effects on virulence of mutations in thesap, pel,and hrploci ofErwinia chrysanthemi. Mol Plant-Microbe Interact 14: 386–393. 27. Yang S, Perna NT, Cooksey DA, Okinaka Y, Lindow SE, et al. (2004)
Genome-wide identification of plant-upregulated genes ofErwinia chrysanthemi3937 using a GFP-based IVET leaf array. Mol Plant-Microbe Interact 17: 999–1008.
28. Bocsanczy AM, Nissinen RM, Oh CS, Beer SV (2008) HrpN ofErwinia amylovora functions in the translocation of DspA/E into plant cells. Mol Plant Pathol 9: 425–434.
29. Casper-Lindley C, Dahlbeck D, Clark ET, Staskawicz BJ (2002) Direct biochemical evidence for type III secretion-dependent translocation of the AvrBs2 effector protein into plant cells. Proc Natl Acad Sci USA 99: 8336–8341. 30. Schechter LM, Roberts KA, Jamir Y, Alfano JR, Collmer A (2004)Pseudomonas syringaetype III secretion system targeting signals and novel effectors studied with a Cya translocation reporter. J Bacteriol 186: 543–555.
31. Sory MP, Cornelis GR (1994) Translocation of a hybrid YopE-adenylate cyclase fromYersinia enterocoliticainto HeLa cells. Mol Microbiol 14: 583–594. 32. Ladant D, Ullmann A (1999)Bordatella pertussisadenylate cyclase: a toxin with
multiple talents. Trends Microbiol 7: 172–176.
33. Bouley J, Condemine G, Shevchik VE (2001) The PDZ domain of OutC and the N-terminal region of OutD determine the secretion specificity of the type II out pathway ofErwinia chrysanthemi. J Mol Biol 308: 205–219.
34. Holeva MC, Bell KS, Hyman LJ, Avrova AO, Whisson SC, et al. (2004) Use of a pooled transposon mutation grid to demonstrate roles in disease development for Erwinia carotovorasubsp.atrosepticaputative type III secreted effector (DspE/A) and helper (HrpN) proteins. Mol Plant-Microbe Interact 17: 943–950. 35. Alfano JR, Collmer A (2004) Type III secretion system effector proteins: double
agents in bacterial disease and plant defense. Annu Rev Phytopathol 42: 385–414.
36. Collmer A, Badel JL, Charkowski AO, Deng WL, Fouts DE, et al. (2000) Pseudomonas syringaeHrp type III secretion system and effector proteins. Proc Natl Acad Sci USA 97: 8770–8777.
37. Fouts DE, Abramovitch RB, Alfano JR, Baldo AM, Buell CR, et al. (2002) Genomewide identification ofPseudomonas syringaepv.tomatoDC3000 promoters controlled by the HrpL alternative sigma factor. Proc Natl Acad Sci USA 99: 2275–2280.
38. Lindeberg M, Cartinhour S, Myers CR, Schechter LM, Schneider DJ, et al. (2006) Closing the circle on the discovery of genes encoding Hrp regulon members and type III secretion system effectors in the genomes of three model Pseudomonas syringaestrains. MolPlant-Microbe Interact 19: 1151–1158. 39. Toth IK, Bell KS, Holeva MC, Birch PRJ (2003) Soft rot erwiniae: from genes to
genomes. Mol Plant Pathol 4: 17–30.
40. Jafra S, Figura I, Hugouvieux-Cotte-Pattat N, Lojkowska E (1999) Expression of Erwinia chrysanthemipectinase genespelI, pelL, andpelZduring infection of potato tubers. Mol Plant-Microbe Interact 12: 845–851.
41. Liu H, Coulthurst SJ, Pritchard L, Hedley PE, Ravensdale M, et al. (2008) Quorum sensing coordinates brute force and stealth modes of infection in the plant pathogenPectobacterium atrosepticum. PLoS Pathog 4: e1000093. 42. Cambronne ED, Roy CR (2006) Recognition and delivery of effector proteins
into eukaryotic cells by bacterial secretion systems. Traffic 7: 929–939. 43. Cornelis GR, Van Gijsegem F (2000) Assembly and function of type III secretory
systems. Annu Rev Microbiol 54: 735–774.
44. Lee SH, Galan JE (2004)Salmonella type III secretion-associated chaperones confer secretion-pathway specificity. Mol Microbiol 51: 483–495.
45. Sory MP, Boland A, Lambermont I, Cornelis GR (1995) Identification of the YopE and YopH domains required for secretion and internalization into the cytosol of macrophages, using the cyaA gene fusion approach. Proc Natl Acad Sci U S A 92: 11998–12002.
46. Venkatesh B, Babujee L, Liu H, Hedley P, Fujikawa T, et al. (2006) TheErwinia chrysanthemi3937 PhoQ sensor kinase regulates several virulence determinants. J Bacteriol 188: 3088–3098.
47. Hovey R, Lentes S, Ehrenreich A, Salmon K, Saba K, et al. (2005) DNA microarray analysis of Methanosarcina mazei Go1 reveals adaptation to different methanogenic substrates. Mol Genet Genomics 273: 225–239. 48. Tusher VG, Tibshirani R, Chu G (2001) Significance analysis of microarrays
applied to the ionizing radiation response. Proc Natl Acad Sci U S A 98: 5116–5121.