BGD
10, 2791–2834, 2013SOM compositions in shallow photic
sediments
A. K. Hardison et al.
Title Page
Abstract Introduction
Conclusions References
Tables Figures
◭ ◮
◭ ◮
Back Close
Full Screen / Esc
Printer-friendly Version Interactive Discussion
Discussion
P
a
per
|
Dis
cussion
P
a
per
|
Discussion
P
a
per
|
Discussio
n
P
a
per
|
Biogeosciences Discuss., 10, 2791–2834, 2013 www.biogeosciences-discuss.net/10/2791/2013/ doi:10.5194/bgd-10-2791-2013
© Author(s) 2013. CC Attribution 3.0 License.
Open Access
Biogeosciences
Discussions
Geoscientific Geoscientific
Geoscientific Geoscientific
This discussion paper is/has been under review for the journal Biogeosciences (BG). Please refer to the corresponding final paper in BG if available.
Microphytobenthos and benthic
macroalgae determine sediment organic
matter composition in shallow photic
sediments
A. K. Hardison1,*, E. A. Canuel1, I. C. Anderson1, C. R. Tobias2, B. Veuger3, and M. Waters4
1
Virginia Institute of Marine Science, College of William and Mary, P.O. Box 1346, Gloucester Point, VA 23062, USA
2
Department of Marine Sciences, University of Connecticut, Groton, CT 06340, USA
3
The Royal Netherlands Institute for Sea Research (NIOZ), Yerseke, The Netherlands
4
Valdosta State University, Valdosta, GA 31698, USA
*
now at: University of Texas Marine Science Institute, 750 Channel View Dr., Port Aransas, TX 78373, USA
Received: 7 January 2013 – Accepted: 24 January 2013 – Published: 15 February 2013
Correspondence to: A. K. Hardison ([email protected])
BGD
10, 2791–2834, 2013SOM compositions in shallow photic
sediments
A. K. Hardison et al.
Title Page
Abstract Introduction
Conclusions References
Tables Figures
◭ ◮
◭ ◮
Back Close
Full Screen / Esc
Printer-friendly Version Interactive Discussion
Discussion
P
a
per
|
Dis
cussion
P
a
per
|
Discussion
P
a
per
|
Discussio
n
P
a
per
Abstract
Benthic macroalgae are a common symptom of eutrophication in shallow coastal bays as a result of increased nutrient loads. Microphytobenthos (MPB) and benthic macroal-gae play an important role in system metabolism within shallow coastal bays. However, their independent and interactive influences on sediment organic matter (SOM) are
5
not well understood. We investigated the influence of macroalgae and MPB on SOM quantity and quality in an experimental mesocosm system using bulk and molecular level (total hydrolyzable amino acids, THAA; phospholipid linked fatty acids, PLFA; pig-ment) analyses. Our experiment used an incomplete factorial design made up of two factors, each with two levels: (1) light (ambient vs. dark) and (2) macroalgae (presence
10
vs. absence of live macroalgae). Over the course of the 42-day experiment, total or-ganic carbon (TOC) and total nitrogen (TN) increased under ambient light by 173±14
and 141±7 %, respectively, compared to in the dark (78±29 and 39±22 %). THAA
comprised a substantial fraction of SOM (∼16 % of TOC, 35 % of TN) and followed
TOC and TN accumulation patterns. Mole percent composition of the THAA pool
indi-15
cated that SOM was composed of more labile organic material (e.g. L-glutamic acid, phenylalanine) under ambient light conditions while SOM in dark treatments was more degraded, with higher proportions of glycine and D-alanine. PLFA content, which rep-resents viable biomass, made up∼1 % of TOC and contained high levels of algal fatty
acids in the light, particularly PLFA derived from diatoms. In the presence of MPB (i.e.
20
light and macroalgae treatments), SOM lability increased, resulting in the observed in-creases in bacterial PLFA concentrations. Macroalgae, which were added to half of the light treatments, decreased SOM accumulation compared to light treatments without macroalgae, with TOC and TN increasing by only 130±32 and 94±24 %,
respec-tively. This decrease likely resulted from shading by macroalgae, which reduced
pro-25
BGD
10, 2791–2834, 2013SOM compositions in shallow photic
sediments
A. K. Hardison et al.
Title Page
Abstract Introduction
Conclusions References
Tables Figures
◭ ◮
◭ ◮
Back Close
Full Screen / Esc
Printer-friendly Version Interactive Discussion
Discussion
P
a
per
|
Dis
cussion
P
a
per
|
Discussion
P
a
per
|
Discussio
n
P
a
per
|
more similar to dark treatments and less similar to light treatments without macroalgae. Overall MPB and benthic macroalgae fundamentally altered SOM quality and quantity, which may have notable ecological consequences for shallow-water systems such as increased hypoxia/anoxia, sulfide accumulation, enhanced mineralization and/or stim-ulated denitrification.
5
1 Introduction
Shallow coastal bays make up approximately 13 % of the world’s coastline, are among the most highly productive ecosystems on earth, and are distinctly vulnerable to ef-fects from the growing problem of nutrient over-enrichment due to increased human activities (Nixon, 1995; NRC, 2000; Pedersen et al., 2004). One consequence of
nu-10
trient loading to many of these systems has been a shift in primary producer com-munity structure. Because much of the sediment surface resides within the euphotic zone in these bays, benthic autotrophs often are the dominant primary producers. Observations from a number of systems have shown that as nutrient loading in-creases, ephemeral macroalgae, phytoplankton, and epiphytes increase, while
slow-15
growing perennial macrophytes such as seagrasses decrease (Valiela et al., 1992; Hauxwell et al., 2001; Duarte, 1995; Sand-Jensen and Borum, 1991). In Waquoit Bay MA, for example, ephemeral populations of green (Cladophora) and red (Gracilaria) macroalgae replacedZostera marina seagrass when nutrient loadings increased six-fold (Hauxwell et al., 2003). The mechanisms underlying this shift in community
struc-20
ture relate to differences among plant types in nutrient uptake and growth strategies (Sand-Jensen and Borum, 1991; Nielsen et al., 1996). Microphytobenthos (MPB), in-cluding benthic microalgae such as diatoms, and cyanobacteria, often contribute sig-nificantly to primary production within these shallow systems; however, their response as the autotrophic community structure shifts in the face of nutrient over-enrichment is
25
BGD
10, 2791–2834, 2013SOM compositions in shallow photic
sediments
A. K. Hardison et al.
Title Page
Abstract Introduction
Conclusions References
Tables Figures
◭ ◮
◭ ◮
Back Close
Full Screen / Esc
Printer-friendly Version Interactive Discussion
Discussion
P
a
per
|
Dis
cussion
P
a
per
|
Discussion
P
a
per
|
Discussio
n
P
a
per
The dominant plants in a community greatly affect both the physical and biological con-ditions of a system, including overall community structure (Orth et al., 1984; Heck et al., 2003; Norkko, 1998), ecosystem processes such as nutrient cycling (Tyler et al., 2001; Risgaard-Petersen, 2003), and hydrologic conditions (Fonseca and Calahan, 1992; Ju-mars et al., 2001; Paterson and Black, 1999). For example, the presence of ephemeral
5
macroalgae often leads to episodic anoxia and increased sulfide concentrations (Sfriso et al., 1992; Krause-Jensen et al., 1999), which negatively affect fish and benthic fauna (Norkko et al., 2000; Raffaelli et al., 1998; Gray et al., 2002) as well as other au-totrophs (Hauxwell et al., 2003; Sundback and McGlathery, 2005). Macroalgae also affect other primary producers directly through shading and/or competition for nutrients.
10
Because of their location at the sediment surface or floating just above the sediments, macroalgae may reduce the amount of light available for MPB, thereby decreasing or inhibiting MPB production (Sundback and McGlathery, 2005; Tyler et al., 2003; Valiela et al., 1997). However, some MPB communities show evidence of photo-acclimation to low-light environments and are not affected by shading by overlying macroalgal mats
15
(Sundback and McGlathery, 2005; Sundback et al., 1996). In addition to their effects on light, macroalgae may out-compete MPB for water column nutrients, particularly when MPB are nutrient-limited, which may occur in sandy sediments during warm months (Nilsson et al., 1991; Sundback and McGlathery, 2005).
Shifts in plant community structure have also been linked to changes in
sedi-20
ment composition (Benoy and Kalff, 1999; Kenworthy et al., 1982), which in turn af-fect, ecosystem services like nutrient cycling and secondary production. Macrophyte canopies, for example, enhance accumulation of fine, organic-rich particles compared with unvegetated sediments (Benoy and Kalff, 1999; Gacia et al., 2002). Sediment or-ganic matter (SOM) consists of material from a variety of living and non-living sources
25
BGD
10, 2791–2834, 2013SOM compositions in shallow photic
sediments
A. K. Hardison et al.
Title Page
Abstract Introduction
Conclusions References
Tables Figures
◭ ◮
◭ ◮
Back Close
Full Screen / Esc
Printer-friendly Version Interactive Discussion
Discussion
P
a
per
|
Dis
cussion
P
a
per
|
Discussion
P
a
per
|
Discussio
n
P
a
per
|
While sources contributing to SOM vary by system, microbial biomass often contributes a significant fraction of SOM in shallow systems (Volkman et al., 2008; Canuel and Martens, 1993; Bouillon and Boschker, 2006). Specifically, MPB may be a particularly good source of labile organic matter, which may support bacterial production (Volkman et al., 2008; Hardison et al., 2011b; Middelburg et al., 2000).
5
The objectives of this study were to examine the influence of MPB on SOM qual-ity and quantqual-ity, and to investigate how the MPB contribution to SOM changes in the presence of a macroalgal bloom. Because gross measurements of SOM (e.g. total organic C, total nitrogen (N)) do not provide information on source or availability, we combined bulk and molecular-level analyses to more accurately characterize the SOM
10
of a shallow coastal bay. Specific organic compounds (biomarkers) were used to at-tribute organic matter to different sources.
2 Methods
2.1 Site description
Sediments and macroalgae were collected from Hog Island Bay, Virginia (HIB), which is
15
located along the Delmarva Peninsula and part of the Virginia Coast Reserve, a Long-Term Ecological Research (LTER) site. HIB is a shallow coastal lagoon (<2 m deep at mean low water), typical of temperate lagoons along the US east coast and is dom-inated by benthic autotrophs (McGlathery et al., 2001; Thomsen et al., 2006). We collected sediments and macroalgae from mid-lagoon sites where localized blooms
20
of macroalgae have previously developed during warmer months (McGlathery et al., 2001; Thomsen et al., 2006). Throughout the rest of the year when macroalgae are less abundant, MPB dominate (McGlathery et al., 2001; Anderson et al., 2003). Ad-ditional details about the study system and complementary data from a companion stable isotope tracer study can be found in Hardison et al. (2011b).
BGD
10, 2791–2834, 2013SOM compositions in shallow photic
sediments
A. K. Hardison et al.
Title Page
Abstract Introduction
Conclusions References
Tables Figures
◭ ◮
◭ ◮
Back Close
Full Screen / Esc
Printer-friendly Version Interactive Discussion
Discussion
P
a
per
|
Dis
cussion
P
a
per
|
Discussion
P
a
per
|
Discussio
n
P
a
per
2.2 Experimental design
We used a flow-through mesocosm (“perfusionator”) array at the Virginia Institute of Marine Science (VIMS) Eastern Shore Laboratory (ESL) in Wachapreague, VA that allowed for addition of nutrients simultaneously via surface water (SW) and porewa-ter (PW). Since nutrients are delivered to shallow coastal bays both through SW (e.g.
5
runoffand atmospheric deposition) and/or PW (e.g. groundwater and sediment rem-ineralization), it was important for our study, which focused on the community living at the sediment-water interface, to include nutrients from both sources. Discussion of the design and testing of the perfusionator can be found in Hardison et al. (2011a). The perfusionator consisted of a 60 cm I.D.×60 cm height translucent fiberglass cylinder
10
that included a reservoir for PW at the base of the sediment column. Twelve meso-cosms were filled to a depth of ∼15 cm with intact sediments extruded from cores
collected from a mid-lagoon field site in May 2007. At the ESL, the mesocosms were placed in shallow water baths under shade cloth (30 % light attenuation) to control tem-perature and light. The water column above the sediments was stirred continuously
15
with a mini-jet pump to keep the water column well mixed.
Nutrient-amended feed water was delivered to each perfusionator simultaneously via the SW and PW. We continuously added N throughout the experiment so that N would not limit primary production, but concentrations remained within ambient N levels since this was not meant to be a N addition study. Feed water was drawn from a creek
20
adjacent to the ESL, pumped through a series of sand, bag (10 µm), cartridge (5 and 1 µm), and ultraviolet filters, and amended using a high-precision metering pump with (NH4)2SO4in a mixing chamber before delivery to each perfusionator. NH+4 was added
at a rate to achieve a concentration of 25 µM above background levels (2–4 µM) in mesocosm SW and with minimal change to PW background levels (200–300 µM). SW
25
additions were delivered gravimetrically directly to the perfusionator water column at a rate of∼43 L day−1, or a SW residence time of∼2 days. PW additions were delivered
BGD
10, 2791–2834, 2013SOM compositions in shallow photic
sediments
A. K. Hardison et al.
Title Page
Abstract Introduction
Conclusions References
Tables Figures
◭ ◮
◭ ◮
Back Close
Full Screen / Esc
Printer-friendly Version Interactive Discussion
Discussion
P
a
per
|
Dis
cussion
P
a
per
|
Discussion
P
a
per
|
Discussio
n
P
a
per
|
sediment column at a rate of∼15 L day−1, or a porewater residence time of∼1.8 days.
Fine scale control of the SW and PW flow rates into each perfusionator was achieved using intravenous (IV) drippers, which were calibrated daily.
The experiment consisted of an incomplete factorial design made up of two fac-tors, each with two levels: (1) light (ambient vs. dark) and (2) macroalgae (presence
5
vs. absence of live macroalgae). All factors were crossed with the exception of the dark+macroalgae treatment; in order to maintain living (and growing) macroalgae, only light treatments received a macroalgal addition. Each treatment was replicated (n=4). Once connected to the experimental system, the mesocosms equilibrated for two weeks before beginning the experiment. During this period, the dark and light
treat-10
ments were established, but macroalgae and nutrients were not added until the exper-iment began.
Macroalgae (Gracilaria vermiculophylla) were collected live from HIB in May 2007 and returned to the laboratory where they were cleaned of epiphytes and epifauna, rinsed with 0.7 µm filtered seawater, and placed in aquaria inside a greenhouse until
15
needed. Live macroalgae were added to half of the light treatments in densities ob-served naturally (124.8±1.6 gdw m−2) (McGlathery et al., 2001; Hardison et al., 2010;
Thomsen et al., 2006).
2.3 Sampling
Nutrient and macroalgal additions began on day 0. The mesocosms were sampled
20
prior to the additions to capture baseline conditions, and on days 1, 3, 7, 14 16, 21, 29 and 42. At each sampling, surface sediments (0–1 cm) were collected using two acrylic cores (5.7 cm I.D.) and reserved for bulk (total organic C (TOC), total N (TN)), amino acid, and fatty acid analyses. Sediments from both cores were combined in pre-combusted glass jars, immediately frozen at−4◦C, and frozen at −80◦C within 3
25
BGD
10, 2791–2834, 2013SOM compositions in shallow photic
sediments
A. K. Hardison et al.
Title Page
Abstract Introduction
Conclusions References
Tables Figures
◭ ◮
◭ ◮
Back Close
Full Screen / Esc
Printer-friendly Version Interactive Discussion
Discussion
P
a
per
|
Dis
cussion
P
a
per
|
Discussion
P
a
per
|
Discussio
n
P
a
per
concentrations using a cut-offsyringe (1.1 cm I.D.), placed into 15 mL centrifuge tubes, immediately frozen at −4◦C, and analyzed within 1 month. Additional sediments (0–
0.3 cm) were also collected for detailed pigment analysis using a cut-offsyringe (1.1 cm I.D.) on a subset of the sampling days. A different region of the sediment surface was sampled each day to avoid artifacts associated with re-sampling.
5
Macroalgae were removed from each mesocosm, patted dry, and weighed for deter-mination of biomass on days 7, 14, 21, 29, and 42. Wet mass was converted to dry mass using percent water estimates (72 %) fromG. vermiculophylla collected in the field, and dry mass values were normalized to the mesocosm sediment surface area (0.29 m2).
10
2.4 Bulk analyses
For bulk sediment TOC and TN measurements, sediments were freeze-dried, ground and homogenized, acidified to remove inorganic C (Hedges and Stern, 1984) and an-alyzed for TOC and TN using a Costech ECS 4010 elemental analyzer. Samples were analyzed for benthic chlorophyll a concentrations according to a modification of the
15
method of Lorenzen (1967; Pinckney et al., 1994). The sediment pellet was sonicated in 90 % acetone, vortexed and extracted for 24 h at−4◦C. The supernatant was passed
through a 0.45 µm CR-PTFE syringe filter and read on a Shimadzu UV-1601 UV Visi-ble spectrophotometer (λ=665, 750 nm). Chlorophyllaconcentrations (mg m−2) were calculated according to the equations in Lorenzen (1967). An additional set of samples
20
was later used for detailed pigment analyses (see pigments section, below).
2.5 Total hydrolyzable amino acids
Hydrolyzable amino acids (HAA) were analyzed on a subset of the sediment samples according to the method presented in Veuger et al. (2005). Freeze dried sediment (1 g) was rinsed with 2 N HCl and Milli-Q water to remove dissolved amino acids. The
sedi-25
BGD
10, 2791–2834, 2013SOM compositions in shallow photic
sediments
A. K. Hardison et al.
Title Page
Abstract Introduction
Conclusions References
Tables Figures
◭ ◮
◭ ◮
Back Close
Full Screen / Esc
Printer-friendly Version Interactive Discussion
Discussion
P
a
per
|
Dis
cussion
P
a
per
|
Discussion
P
a
per
|
Discussio
n
P
a
per
|
by cation exchange chromatography, amino acids were derivatized with isopropanol and pentafluoropropionic anhydride and further purified by solvent extraction. Concen-trations of the derivatized D- and L-amino acids were measured by gas chromatography combustion isotope ratio mass spectrometry on a HP 6890 GC with a Thermo type III combustion interface and a Thermo Delta Plus IRMS. The sum of concentrations of all
5
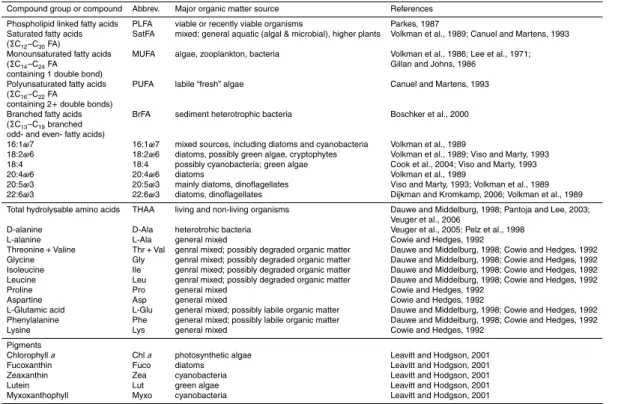
amino acids analyzed will be referred to as total hydrolyzable amino acids (THAA). The HAAs analyzed and their major organic matter sources are presented in Table 1.
2.6 Phospholipid linked fatty acids
Total fatty acids were analyzed on a subset of the sediment samples according to a modified Bligh and Dyer (1959) method (Canuel et al., 2007; Poerschmann and
Carl-10
son, 2006). Wet sediments (∼12 g) were extracted using an accelerated solvent
ex-tractor system (Dionex ASE 200) adapted for in-cell silica gel chromatography. Each sample was extracted twice on the ASE: neutral lipids were collected following extrac-tion with a 9:1 (v:v) hexane : acetone mixture at 50◦C, then polar lipids were collected following extraction with a 8:2 (v:v) methanol:chloroform solution at 80◦C. Polar lipid
15
fractions were saponified using KOH-CH3OH for 2 h at 110◦C. Saponified samples
were then extracted under basic and acidic conditions. The acid-extracted fractions were methylated with BF3-CH3OH to form fatty acid methyl esters (FAME). The polar FAME represented the phospholipid-linked fatty acids (PLFA). FAME concentrations were measured by gas chromatography with flame ionization detection (GC-FID, DB-5
20
column, HP 5890) and quantified using methyl heneicosanoate as an internal standard. Peak identities were verified using reference standards as well as coupled gas chro-matography mass spectrometry using a mass selective detector operated in electron impact mode (HP 6890, GC-MSD). Fatty acids are designated A:BωC, where A is the total number of carbon atoms, B is the number of double bonds, and C is the position
25
BGD
10, 2791–2834, 2013SOM compositions in shallow photic
sediments
A. K. Hardison et al.
Title Page
Abstract Introduction
Conclusions References
Tables Figures
◭ ◮
◭ ◮
Back Close
Full Screen / Esc
Printer-friendly Version Interactive Discussion
Discussion
P
a
per
|
Dis
cussion
P
a
per
|
Discussion
P
a
per
|
Discussio
n
P
a
per
references therein). The PLFA analyzed and their major organic matter sources are presented in Table 1.
2.7 Pigments
Additional photosynthetic pigments (chlorophylls and carotenoids) were measured on a subset of the samples using a high pressure liquid chromatography (HPLC) system
5
following the methods of Leavitt and Hodgson (2001) designed specifically for sedi-mentary pigments. Surface sediment samples were extracted with a solvent mixture of acetone, methanol and water mixed in an 80/15/5 ratio, which contained an internal standard (Sudan II; Sigma Chemical Corp., St. Louis, MO) and allowed to extract 16 h– 24 h in a −20◦C freezer. Following extraction, samples were centrifuged and filtered
10
through a 0.22 µm nylon syringe filters (Millex) to remove particulate matter. Sam-ples were placed in an autosampler tray where they were mixed with an ion-pairing agent (0.75 g tetrabutyl ammonium acetate and 7.7 g ammonium acetate in 100 mL HPLC-grade water) prior to injection. 150 µL of sample extract and 50 µL of ion-pairing agent were injected into a Shimadzu HPLC system following the mobile phase and
15
time sequence of Leavitt and Hodgson (2001). Chlorophyll and carotenoid pigments were separated chromatographically using a Rainin Model 200 Microsorb C18 column
and measured using a photodiode array detector. Pigment identification was made using retention times of known standards (DHI Lab Products, Denmark) and pigment-specific spectra recorded by the detector. Pigment concentrations are expressed as
20
nmol pigment gdw−1 and calculated by comparing peak areas against standards of
known concentration. The pigments analyzed and their major algal sources are pre-sented in Table 1.
2.8 Data analysis
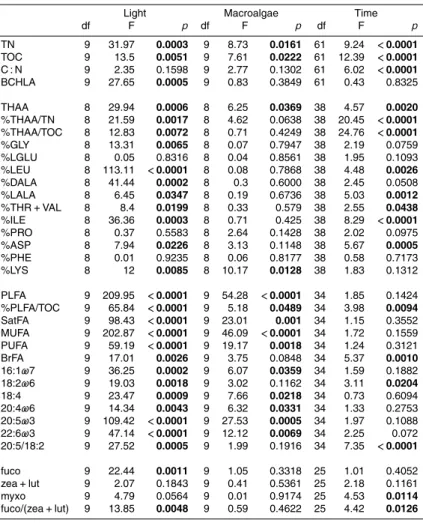
We applied repeated measures analysis of variance (ANOVA) to examine the effects
25
BGD
10, 2791–2834, 2013SOM compositions in shallow photic
sediments
A. K. Hardison et al.
Title Page
Abstract Introduction
Conclusions References
Tables Figures
◭ ◮
◭ ◮
Back Close
Full Screen / Esc
Printer-friendly Version Interactive Discussion
Discussion
P
a
per
|
Dis
cussion
P
a
per
|
Discussion
P
a
per
|
Discussio
n
P
a
per
|
sediment parameters using the Mixed procedure in SAS 9.1 (SAS Institute Inc., Cary, NC). In all models, a compound symmetry error structure was used to model the within-subject covariance structure. Individual HAA were analyzed on a mole percent abun-dance basis while individual PLFA and pigments were analyzed using concentration data. Results presented use Type III sum of squares from the ANOVA model. Unless
5
otherwise noted, values presented are means±1 SE for 4 replicates.
We performed principal components analysis (PCA; Minitab 15 software) to aid in evaluating relationships between treatments and response variables. PCA is used to simplify a dataset by identifying a small set of variables that accounts for a large por-tion of data variance. PCA was run with data from days 1 and 42 to explore changes in
10
PLFA (ng FA gdw−1
) and HAA (mole %) composition over the experiment. All HAA (11 compounds) and a sub-set of PLFA (9 compounds) representing all major fatty acid classes were used in the analyses. Prior to PCA, each dataset was normalized to to-tal concentration to correct for differences in concentrations between samples (Yunker et al., 2005). Any variables that were below detection were set to 1 prior to
normal-15
ization. The centered log ratio values (division by the geometric mean, followed by log transformation) were then autoscaled by dividing by the variable standard deviation. This data normalization procedure was performed to avoid artifacts of negative bias or closure associated with the dataset structure (Yunker et al., 2005). PCA loadings de-scribe the relationships between the PC and the response variables, while PCA scores
20
describe the relationships between the PC and the treatments.
3 Results
3.1 Experimental conditions
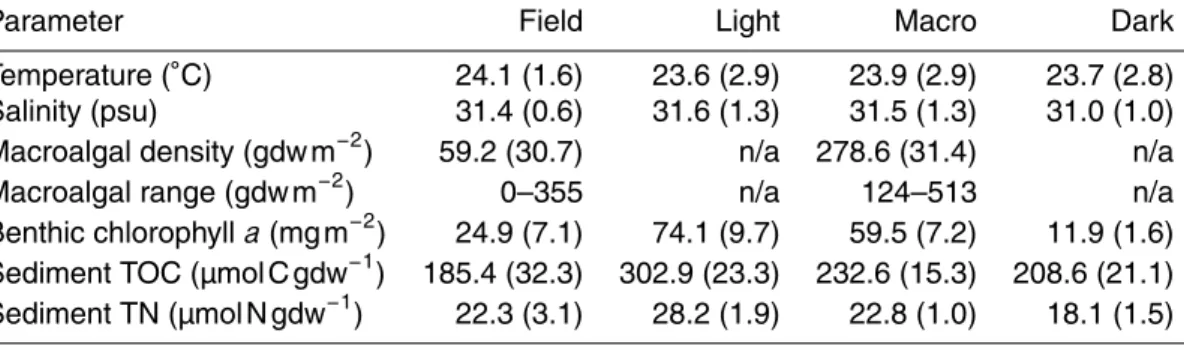
Temperature and salinity in the mesocosm water columns were similar among treat-ments and to the field site (Table 2). Macroalgae in the mesocosms grew steadily from
25
BGD
10, 2791–2834, 2013SOM compositions in shallow photic
sediments
A. K. Hardison et al.
Title Page
Abstract Introduction
Conclusions References
Tables Figures
◭ ◮
◭ ◮
Back Close
Full Screen / Esc
Printer-friendly Version Interactive Discussion
Discussion
P
a
per
|
Dis
cussion
P
a
per
|
Discussion
P
a
per
|
Discussio
n
P
a
per
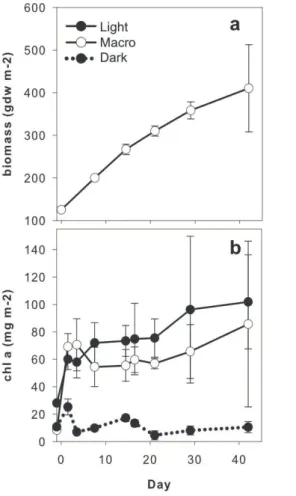
sites (Fig. 1a; Table 2). Concentrations of benthic chlorophyll a were higher for light treatments without macroalgae (“Light”) and with macroalgae (“Macro”) than for the dark treatment (“Dark”; Fig. 1b). Mean sediment TOC and TN concentrations for the mesocosms were similar to field values (Table 2).
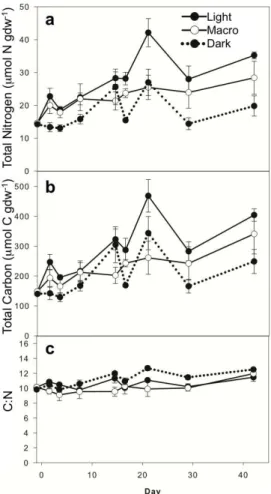
3.2 Bulk sediments 5
Surface sediment TN and TOC concentrations followed similar patterns throughout the experiment (Fig. 2a, b; Supplement Table S1) and were highly correlated with one another (r=0.96, 0.95 and 0.98 for Light, Macro, and Dark treatments, respectively). TN for all samples began at∼14 µmol N gdw−1 and increased throughout the
experi-ment, reaching levels (mean±SE) of 35.2±1.0, 28.4±5.0, and 19.8±3.1 µmol N gdw−1
10
on day 42 for Light, Macro, and Dark treatments, respectively. TOC increased from∼
144 µmol C gdw−1on day 0 to 404.0±20.6, 340.7±67.0, and 248.6±40.2 µmol C gdw−1
for Light, Macro, and Dark treatments, respectively, on day 42. For the Light and Dark treatments, the increases for TN and TOC were not monotonic, and both peaked on day 21 (Fig. 2a, b). Both TN and TOC showed significant light, macroalgae, and time
15
effects (Table 3). Light treatments had the highest TN and TOC concentrations; Dark had the lowest concentrations, and concentrations in Macro were intermediate. C : N ratios remained relatively constant over time (10.7±0.2) and displayed no significant
light or macroalgae effects (Fig. 2c; Table 3).
Benthic chlorophyllacontent was highly variable over time, but generally showed the
20
same patterns as sediment organic content (Fig. 1b). Between day 0 and day 42, con-centrations for the Light treatment increased from 28.1 to 101.8±34.2 mg Chlam−2,
Macro increased from 8.4 to 85.7±60.4 mg m−2, and the Dark treatment remained
unchanged, with a mean across all samples of 11.9±4.1 mg m−2. Light was
signif-icantly higher than Dark (Table 3). Because of high variability between mesocosms
25
BGD
10, 2791–2834, 2013SOM compositions in shallow photic
sediments
A. K. Hardison et al.
Title Page
Abstract Introduction
Conclusions References
Tables Figures
◭ ◮
◭ ◮
Back Close
Full Screen / Esc
Printer-friendly Version Interactive Discussion
Discussion
P
a
per
|
Dis
cussion
P
a
per
|
Discussion
P
a
per
|
Discussio
n
P
a
per
|
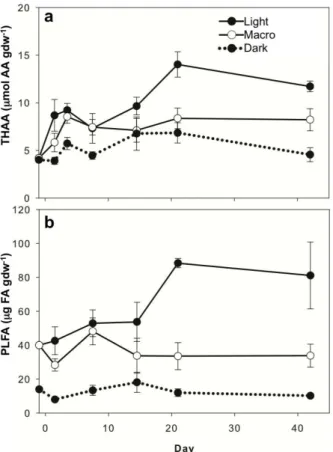
3.3 Total hydrolyzable amino acids (THAA)
THAA concentrations (Fig. 3a) showed similar patterns to sediment TOC and TN con-tent (Fig. 2a, b; Supplement Table S1). Concentrations for all treatments increased from∼4 µmol AA gdw−1on day 0 to 14.0±1.3, 8.4±1.1, and 6.8±1.1 µmol AA gdw−1
on day 21 for Light, Macro, and Dark treatments, respectively, and then concentrations
5
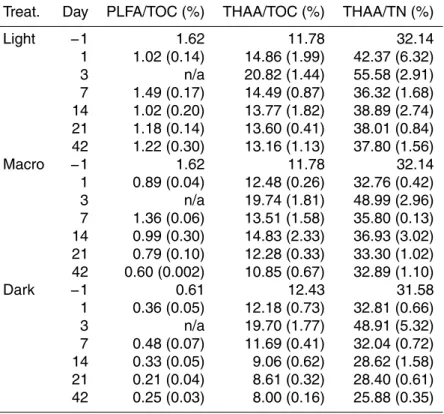
remained steady through day 42. Light treatment had highest concentrations, Dark had the lowest, and concentrations in Macro were intermediate (Fig. 3a). THAA-C made up approximately∼14 % of TOC for both Light treatments and 12 % of TOC for Dark
treat-ment, and THAA-N made up approximately 39 and 33 % of TN for Light and Dark treatments, respectively (Table 4).
10
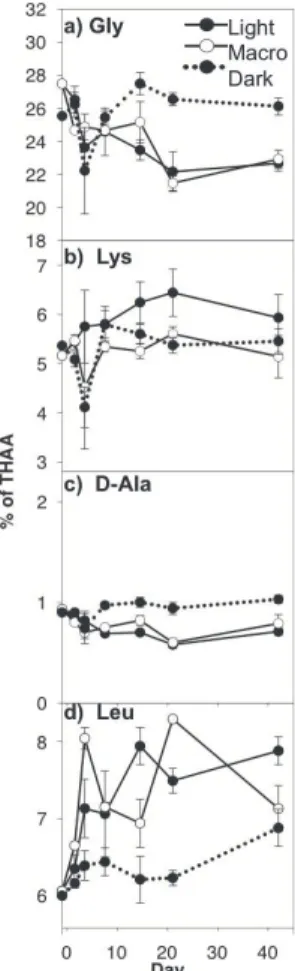
Concentrations of four selected individual amino acids are presented as mole per-centages in Fig. 4; however, data for all 11 amino acids analyzed are presented in Sup-plement Table S2, and abbreviations are provided in Table 1. Across all treatments, Gly was the most abundant amino acid, making up approximately 25 % of THAA, followed by L-Ala and Asp, L-Glu, Pro, Thr+Val, Leu, Lys, Ile and Phe, and D-Ala. Most amino
15
acids showed a significant light effect, with the exception of L-Glu, Pro, and Phe (Ta-ble 3). Mole percentages of Leu, L-Ala, Thr+Val, Ile, and Lys were higher for Light than Dark, while Gly, D-Ala and Asp were higher in the dark (Fig. 4d; Supplement Table S2). The only amino acid to display a significant macroalgae effect was Lys, for which mole percentages were higher in Light treatments (Fig. 4b; Table 3).
20
3.4 Phospholipid linked fatty acids (PLFA)
PLFA concentrations (Fig. 3b) followed patterns similar to those of sediment TOC, TN, and THAA content (Figs. 2a, b, 3a; Supplement Table S1). PLFA concentrations dif-fered significantly across treatments, with highest concentrations in Light treatments, lowest concentrations in Dark treatments, and intermediate concentrations in Macro
25
BGD
10, 2791–2834, 2013SOM compositions in shallow photic
sediments
A. K. Hardison et al.
Title Page
Abstract Introduction
Conclusions References
Tables Figures
◭ ◮
◭ ◮
Back Close
Full Screen / Esc
Printer-friendly Version Interactive Discussion
Discussion
P
a
per
|
Dis
cussion
P
a
per
|
Discussion
P
a
per
|
Discussio
n
P
a
per
0.3±0.03 % of TOC from days 0 to 42. Both Light treatments began with PLFA-C levels
at 1.6 % of TOC and generally decreased over time. By day 42, Light had the high-est PLFA-C levels, at 1.2±0.3 % of TOC, while Macro ended with PLFA-C levels of
0.6±0.002 % of TOC.
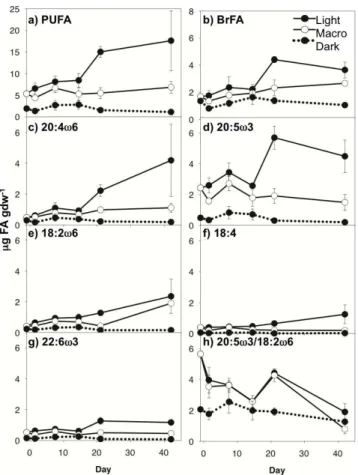
Concentrations of two selected groups and five individual PLFA are presented in
5
Fig. 5; however, data for all PLFA analyzed are presented in Supplemental Table 3. Abbreviations and sources are provided in Table 1, and treatment effects are shown in Table 3. Groups of PLFA representing algal and heterotrophic bacteria sources showed the same concentration patterns over time as total PLFA (Figs. 5a, b, 3b). SatFA (non-specific source) were the most abundant group, making up ∼50 % of total PLFA,
fol-10
lowed generally by MUFA (non-specific source;∼30 %), PUFA (algal; 15 %), and BrFA
(heterotrophic bacteria;∼5 %). PUFA and BrFA are displayed (Fig. 5a, b); however SAT
and MUFA followed similar patterns (Supplement Table S3). All PLFA groups showed a significant light effect, with concentrations in light treatments exceeding Dark treat-ments (Table 3). In addition, all groups except BrFA showed a significant macroalgae
15
effect, with higher concentrations in the Light treatment than Macro.
Algal-specific fatty acids varied between treatments as well as over time (Fig. 5c–g; Table 3). Concentrations of 20:4ω6 and 20:5ω6 (diatoms; Fig. 5c, d), 18:2ω6 (diatoms, possibly green algae, cryptophytes; Fig. 5e), 18:4 (possibly cyanobacteria; Fig. 5f), and 22:6ω3 (diatoms, possibly dinoflagellates; Fig. 5g) followed similar patterns. All were
20
significantly higher in the Light treatment than Dark. Among light treatments, all except 18:2ω6 were higher in the Light treatment. 18:2ω6 showed no significant macroalgae effect. Generally, C20 PUFA were more abundant than C18 PUFA, although their rela-tive abundances, as demonstrated by the ratios of 20:5ω3/18:2ω6, shifted over time (Fig. 5h). For light treatments, this ratio decreased from 5.7 to 1.9±0.5 (Light) and
25
0.8±0.3 (Macro) from day 0 to 42. BrFA, representing bacterial-specific fatty acids
BGD
10, 2791–2834, 2013SOM compositions in shallow photic
sediments
A. K. Hardison et al.
Title Page
Abstract Introduction
Conclusions References
Tables Figures
◭ ◮
◭ ◮
Back Close
Full Screen / Esc
Printer-friendly Version Interactive Discussion
Discussion
P
a
per
|
Dis
cussion
P
a
per
|
Discussion
P
a
per
|
Discussio
n
P
a
per
|
3.5 Accessory pigments
Concentrations of selected pigments and the ratio of fucoxanthin to the sum of zeax-anthan and lutein (fuco/(zea+lut)) are presented in Fig. 6 and treatment effects are shown in Table 3. Data for these pigments are presented in Supplementary Table 4, and abbreviations are defined in Table 1. Specific photosynthetic pigments varied
be-5
tween treatments as well as over time (Fig. 6a–c). Fuco (diatoms; Fig. 6a) was the most abundant accessory pigment, and was significantly higher in the light than in the dark. Concentrations of myxoxanthophyll (myxo, cyanobacteria; Fig. 6b) were negligi-ble and showed no significant treatment effects. Zea+lut (green algae and cyanobac-teria; Fig. 6c) were moderately abundant but showed no significant treatment effects.
10
Although our HPLC system cannot resolve the isomers zea and lut, our analyses sug-gest that the peak is dominated by lut and therefore represents green algae (Leavitt and Hodgson, 2001). This is supported by a purity analysis of the peak on the HPLC chromatograms and low concentrations of other cyanobacterial pigments (myxo). None of the pigments showed a significant macroalgae effect (Table 3). Although fuco was
15
more abundant than zea+lut, their relative abundances, as demonstrated by the ratios of fuco/(zea+lut), shifted over time (Fig. 6d). This ratio decreased from day 0 to day 42 from 21.1±3.7 to 4.2±2.1 (Light), from 21.1±7.2 to 1.5±0.2 (Macro) and from
21.1±0.6 to 0.6±0.1 (Dark).
3.6 Principal components analysis (PCA) 20
PCA provided a summary of changes in sediment composition between treatments and over time (day 1 vs. day 42). PC1 and PC2 explained 39.9 and 21.0 % of the vari-ance in PLFA composition, respectively (Fig. 7a, b). PLFA such as 14:0, 16:0, 20:5ω3, and 16:1ω7, which derive from a variety of aquatic microbes (Table 1), had the most positive loadings on PC1. In contrast, BrFA (bacterial sources),18:2ω6 (microalgae),
25
BGD
10, 2791–2834, 2013SOM compositions in shallow photic
sediments
A. K. Hardison et al.
Title Page
Abstract Introduction
Conclusions References
Tables Figures
◭ ◮
◭ ◮
Back Close
Full Screen / Esc
Printer-friendly Version Interactive Discussion
Discussion
P
a
per
|
Dis
cussion
P
a
per
|
Discussion
P
a
per
|
Discussio
n
P
a
per
(Fig. 7b). BrFA and 16:1ω7 had negative loadings on PC2, while polyunsaturated FA (PUFA), typically ascribed to algal sources, had positive loadings on PC2.
Light and Macro treatments grouped closely on day 1, and had more positive scores than the Dark treatment on PC1 (Fig. 7a). All treatments had similar scores along PC2 on day 1. In contrast, the treatments were separated along both PC axes on day 42. On
5
day 42, the light treatments (Light and Macro) had lower scores on PC1 than on day 1. On day 42, the treatments were also distributed along PC2, with the Dark treatment having the lowest PC2 score, Light having the highest, and Macro having intermediate scores.
In a separate analysis of HAA, PC1 and PC2 explained 36.2 and 25.0 % of the
vari-10
ance in HAA composition, respectively (Fig. 7c, d). Mole percentages of Leu and Ile had the most positive loadings on PC1 while loadings for Gly and D-Ala (bacteria) were the most negative (Fig. 7d). Mole percentages of Asp and Glu had positive loadings on PC2 while Pro, Gly and Lys had negative loadings on PC2. Like PLFA, scores along both PC were similar among treatments on day 1, grouping near zero, but diverged
15
by day 42 (Fig. 7c). While scores for the Dark treatment remained near day 1 values, both light treatments (Light and Macro) shifted towards more positive scores along PC1 on day 42. The light treatments were also separated along PC2 on day 42: Light had negative scores for PC2 while scores for Macro were positive.
4 Discussion 20
MPB and benthic macroalgae play an important role in system metabolism within shal-low coastal bays. However, their independent and interactive influences on SOM are not well understood. In this study, we demonstrated that changes in autotrophic com-munity structure (e.g. MPB, ephemeral blooms of macroalgae) that often result from excess nutrient loading can strongly influence SOM quality and quantity, which will
25
BGD
10, 2791–2834, 2013SOM compositions in shallow photic
sediments
A. K. Hardison et al.
Title Page
Abstract Introduction
Conclusions References
Tables Figures
◭ ◮
◭ ◮
Back Close
Full Screen / Esc
Printer-friendly Version Interactive Discussion
Discussion
P
a
per
|
Dis
cussion
P
a
per
|
Discussion
P
a
per
|
Discussio
n
P
a
per
|
4.1 Role of microphytobenthos
4.1.1 Amount and sources of SOM
To isolate the influence of MPB on SOM, we compared the Light and Dark treat-ments in our experimental system. Nearly every sediment parameter we measured showed a clear light-dark difference, demonstrating the significant influence of MPB on
5
SOM (Table 3). The quantity of SOM increased in Light, as demonstrated by bulk and molecular-level analyses. On a bulk scale, more SOM (TOC, TN) accumulated in the Light treatment compared with the Dark treatment (Fig. 2a, b). By day 42, TOC and TN in the Light increased from baseline values by 173 and 141 %, respectively, com-pared to only 77 and 39 % in the Dark. These light-dark differences were clearly related
10
to MPB biomass. Chlorophylla concentrations, which can be considered a proxy for MPB biomass, were higher in the Light treatment than in the Dark, indicating that MPB biomass was substantially lower in the Dark treatments (Fig. 1b).
Similarly, light-dark differences in THAA and PLFA concentrations also indicated that the presence of MPB altered SOM composition (Fig. 3a, b). By day 42, THAA increased
15
by 180 % relative to background levels in Light treatments compared to a 14 % increase in the Dark. Similarly, PLFA increased by 200 % from background values in Light treat-ments and actually decreased by 27 % in the Dark. Across treattreat-ments, THAA made up a substantial fraction of SOM (∼30–40 % of TN and 12–20 % of TOC; Table 4),
sim-ilar to the concentration range found during other studies in shallow marine systems
20
(Veuger et al., 2006; Cook et al., 2007). THAA included both living and non-living (de-trital) material because HAA have been shown to remain in sediments after cell death (Veuger et al., 2006; Dauwe and Middelburg, 1998; Pantoja and Lee, 2003). PLFA, on the other hand, made up a smaller fraction of TOC (∼1 %; Table 4), but represent only
viable microbial organic matter because PLFA turnover rapidly after cell death (Parkes,
25
BGD
10, 2791–2834, 2013SOM compositions in shallow photic
sediments
A. K. Hardison et al.
Title Page
Abstract Introduction
Conclusions References
Tables Figures
◭ ◮
◭ ◮
Back Close
Full Screen / Esc
Printer-friendly Version Interactive Discussion
Discussion
P
a
per
|
Dis
cussion
P
a
per
|
Discussion
P
a
per
|
Discussio
n
P
a
per
Analysis of the PLFA composition lent insight into the composition of the microbial community that developed in the Light and Dark treatments. Not only did PUFA, a gen-eral indicator for algal sources of organic matter, increase over time in the light (Fig. 5a), but PLFA specific to different microalgal communities also showed different patterns over time. For example, 20:5ω3, which is specific to diatoms (Table 1), was the most
5
abundant PUFA (Fig. 5d; Supplement Table S3), suggesting that diatoms were the dominant algal class within the surface sediments, which is consistent with surveys of microalgal community composition in temperate systems (Welker et al., 2002; Mac-Intyre et al., 1996). 22:6ω3, which was present in lower concentrations than 20:5ω3 (Fig. 5g; Supplement Table S3), is also found in diatoms, as well as dinoflagellates,
10
which do not often contribute significantly to sediment microalgal communities (Bar-ranguet et al., 1997). Other algae that may have been present based on PLFA abun-dance were green algae (18:2ω6, Fig. 5e) and possibly cyanobacteria (18:4, Fig. 5f), both of which have been shown to seasonally dominate MPB communities in intertidal sediments (Barranguet et al., 1997; Pinckney et al., 1995). However, both of these C18 15
PUFA can also be present in diatoms, cryptophytes, and dinoflagellates (at trace lev-els). We cannot say based on PLFA data alone that green algae and cyanobacteria were present; however, the accessory pigment data lends additional insight into the microalgal community within the sediments. The dominant accessory pigment in the 0–0.3 cm section in the light was fuco (Fig. 6a; Supplement Table S4), which is specific
20
to diatoms (Table 1). Myxo, the pigment specific to cyanobacteria, was present in low quantities across all treatments, suggesting that cyanobacteria were negligible com-ponents of this system (Fig. 6b). Zea+lut, which was dominated by lutein, a pigment found in green algae, were significantly higher in the light treatments, supporting the conclusion from the PLFA results that green algae were likely present in this system
25
(Fig. 6c).
BGD
10, 2791–2834, 2013SOM compositions in shallow photic
sediments
A. K. Hardison et al.
Title Page
Abstract Introduction
Conclusions References
Tables Figures
◭ ◮
◭ ◮
Back Close
Full Screen / Esc
Printer-friendly Version Interactive Discussion
Discussion
P
a
per
|
Dis
cussion
P
a
per
|
Discussion
P
a
per
|
Discussio
n
P
a
per
|
increased relative to diatoms during the experiment. Previous work has linked changes in algal community structure with changes in nutrient limitation (Sommer, 1996; Pinck-ney et al., 1995) and temperature (Tilman et al., 1986). Neither temperatures, nor N or phosphorous availability varied over the experiment; however, changes in other nutri-ents (e.g. silica) may have resulted in the observed shifts in algal composition. Algal
5
species compositions can also change in response to top-down forces such as the feeding preferences of grazers (Duffy and Harvilicz, 2001; Canuel et al., 2007). These shifts were not drastic, however. At the end of the experiment, when concentrations of C18 PUFA and green algal pigments were highest, C20 PUFA and diatom pigments
were still more abundant (Figs. 5c–d; 6c–g), suggesting that diatoms remained the
10
dominant algal class in this study.
In this experiment, we were able to quantify the contribution of MPB production to SOM and to characterize the changes in SOM quality that result from MPB production. Our results are consistent with previous studies, which have investigated the influence of the amount of light, rather than the presence or absence of light, on SOM. For
15
example, Spivak and colleagues (2007) observed increased sediment TOC and TN concentrations in an experimental seagrass system in treatments that received 69 % more light than their shaded treatments. They also observed increased contributions of fatty acids derived from plant and algal sources with increased light, consistent with our PLFA results.
20
4.1.2 Lability of SOM and response of the sediment microbial community
Our work further demonstrates that the lability of SOM changed as a result of the con-tributions of MPB in the light. On a bulk level, TN was higher for the Light treatment than the Dark treatment (Fig. 2a), which suggests that the SOM in the light was more labile (available for decomposition) than in the dark because N is generally the
limit-25
compo-BGD
10, 2791–2834, 2013SOM compositions in shallow photic
sediments
A. K. Hardison et al.
Title Page
Abstract Introduction
Conclusions References
Tables Figures
◭ ◮
◭ ◮
Back Close
Full Screen / Esc
Printer-friendly Version Interactive Discussion
Discussion
P
a
per
|
Dis
cussion
P
a
per
|
Discussion
P
a
per
|
Discussio
n
P
a
per
sition also indicated changes in organic matter lability. The mole percentages of Leu and Ile were higher in Light whereas Gly was lower (Fig. 4a, c; Supplement Table S4). Dauwe and Middelburg (1998) developed a degradation index (DI) based on amino acid composition, and found that mole percentages of Gly increased and Leu and Ile decreased with increasing degradation. They suggested that selective preservation of
5
structural compounds versus preferential breakdown of cytoplasmic (i.e. not structural) material explained the contrasting behavior of the individual molecules, although more recent studies have presented alternative explanations for similar findings (e.g. Veuger et al., 2012). It was not possible in the present study to calculate the DI because the THAA analyzed in this study (from GC analysis) does not overlap completely with those
10
analyzed in most other studies, which are HPLC-based. The fact that the Dark treat-ment followed the patterns predicted by the DI suggests that detrital material rather than newly produced biomass (e.g. by MPB and bacteria in the Light treatment) was the dominant source of SOM in the Dark treatment. Increases in total THAA and PLFA concentrations are also consistent with increased organic matter lability in the Light.
15
The general susceptibility of N-containing amino acids to microbial mineralization and high contributions of THAA to SOM make remineralization of THAA a potentially major source of inorganic N in sediments (Pantoja and Lee, 2003). Similarly, fatty acids, par-ticularly PUFA, are considered labile and make up an important component of energy flow in benthic food webs (Sun et al., 1997; Canuel et al., 1995; Canuel and Martens,
20
1996).
These changes in SOM quantity and quality in turn further shaped the sediment microbial community. The presence of labile SOM increased bacterial biomass in the Light treatment compared to the Dark treatment by providing more substrate for bacte-ria. Bacterial-specific PLFA concentrations were higher in the Light (Fig. 5b),
suggest-25
BGD
10, 2791–2834, 2013SOM compositions in shallow photic
sediments
A. K. Hardison et al.
Title Page
Abstract Introduction
Conclusions References
Tables Figures
◭ ◮
◭ ◮
Back Close
Full Screen / Esc
Printer-friendly Version Interactive Discussion
Discussion
P
a
per
|
Dis
cussion
P
a
per
|
Discussion
P
a
per
|
Discussio
n
P
a
per
|
matter in the Dark treatments by day 14. This may have been exacerbated by the fact that the Dark treatment was maintained in the dark for two weeks prior to the start of the experiment. Previous studies have suggested that bacterial and MPB activities may be coupled in a number of ways. First, bacteria can directly decompose detrital MPB material, as has been observed in numerous studies (Cook et al., 2007; Hardison et al.,
5
2011b; Veuger et al., 2007). Second, benthic microalgae, particularly diatoms, excrete extracellular polymeric substances (EPS) that aid in sediment stability and/or motility (Smith and Underwood, 1998; Welker et al., 2002; Taylor and Paterson, 1998), and may also serve as a substrate for bacteria (Middelburg et al., 2000; Hardison et al., 2011b; Evrard et al., 2008; Goto et al., 2001). Lack of bacterial biomass buildup in the Dark
10
treatments, in the absence of photosynthesizing-MPB, suggests that organic matter substrate became limiting after the initial pool of labile organic matter in the sediments was exhausted.
Overall, MPB fundamentally altered SOM composition in our mesocosm experiment. They produced labile organic matter that supported an active heterotrophic
bacte-15
rial community and increased C and N storage in the sediments. We likely observed higher MPB and bacterial abundances in the mesocosms relative to the field because the mesocosm system removed some predation pressure and reduced resuspension. However, the mesocosm experimental system also provided a tremendous opportunity since it is impossible to separate the effects of MPB from other processes in the field.
20
Since our objective was to compare treatments and assess the differences due to the presence of MPB, we present these changes as estimates of the potential influence of MPB on SOM in the environment.
4.2 Role of benthic macroalgae
Our second objective was to investigate the influence of a macroalgal bloom on SOM.
25
BGD
10, 2791–2834, 2013SOM compositions in shallow photic
sediments
A. K. Hardison et al.
Title Page
Abstract Introduction
Conclusions References
Tables Figures
◭ ◮
◭ ◮
Back Close
Full Screen / Esc
Printer-friendly Version Interactive Discussion
Discussion
P
a
per
|
Dis
cussion
P
a
per
|
Discussion
P
a
per
|
Discussio
n
P
a
per
reduce light available to benthic autotrophs, and increases in the occurrence and size of blooms of macroalgae have been hypothesized as a factor contributing to global seagrass declines (Hauxwell et al., 2001). Macroalgae have also been shown to “self shade” when light is attenuated within the layers of an algal mat (Peckol and Rivers, 1996; Krause-Jensen et al., 1996), and self-shading has been suggested as a possible
5
cause for “crashes” of mid-summer macroalgal blooms that have been observed in nu-merous systems (Sfriso et al., 1992; McGlathery et al., 2001). Macroalgae were added to the mesocosms at densities observed in HIB and other shallow coastal bays, and their final densities (4-fold increase) were within the range of more eutrophied lagoons (McGlathery et al., 2001; Hauxwell et al., 2001; Sfriso et al., 1992; Pregnall and Rudy,
10
1985). Our intensive sampling throughout the experiment allowed us to track changes between the light treatments with and without macroalgae as the macroalgal bloom developed. We were able to not only detect changes in many of the sediment param-eters that suggested that the presence of macroalgae influenced SOM, but we were also able to detect the timing of those changes as the macroalgal bloom developed, as
15
discussed below.
Changes in numerous sediment parameters suggested that macroalgae affected SOM quantity. TOC, TN, THAA, and PLFA concentrations were all lower in Macro treatments compared to Light treatments (Figs. 2a, b and 3a, b). By day 42, SOM accumulation in Macro treatments was intermediate between the Light and Dark
treat-20
ments. TOC, TN, and THAA increased from background values by 130, 94, and 97 %, respectively. PLFA, on the other hand, increased until ∼day 14 and then decreased
15 % from initial values by day 42, similar to the Dark treatments.
Molecular-level analyses also indicated that the macroalgae treatment affected the composition of SOM. PLFA and pigment data in the Macro treatment showed similar
25
BGD
10, 2791–2834, 2013SOM compositions in shallow photic
sediments
A. K. Hardison et al.
Title Page
Abstract Introduction
Conclusions References
Tables Figures
◭ ◮
◭ ◮
Back Close
Full Screen / Esc
Printer-friendly Version Interactive Discussion
Discussion
P
a
per
|
Dis
cussion
P
a
per
|
Discussion
P
a
per
|
Discussio
n
P
a
per
|
myxo; Figs. 5f, 6b) were negligible in these sediments. However, the concentrations of total PUFA and individual algal PLFA concentrations were lower in Macro treatments, indicating that macroalgae limited MPB production (Fig. 5). Changes in PLFA over time in the Macro treatment were likely related to the amount of macroalgal biomass within the mesocosms. By day 14, macroalgal biomass was∼300 gdw m−2(Fig. 1). In a study
5
by Krause-Jensen and colleagues (1996), this was the estimated value above which macroalgae completely blocked light reaching MPB. After this critical density in our experiment, MPB production decreased and SOM built up more slowly in Macro treat-ments. Even if macroalgal biomass had remained below 300 gdw m−2, chronic shading by macroalgae would likely have decreased MPB metabolism, as has been observed
10
in studies investigating the effects of shading on MPB metabolism (Stutes et al., 2006; Sundback and McGlathery, 2005). It is not uncommon for macroalgal blooms to reach densities above 300 gdw m−2in eutrophied systems and persist for days to weeks (see Sundback and McGlathery, 2005 and references therein). Based on results from this present study, it is likely that blooms of this magnitude negatively affect MPB biomass.
15
As in our light-dark comparison, the presence of macroalgae also changed the qual-ity of SOM. Concentrations of PLFA in Macro treatments remained level after day 14 (Fig. 3b), and the fraction of TOC from PLFA-C actually decreased, suggesting that pro-duction of labile organic matter slowed down compared to the Light treatment (Table 4). As a result of changes in SOM quantity and composition, the heterotrophic bacterial
20
community differed in treatments with macroalgae. The mole fraction of Lys was lower in the Macro treatment with values that were similar to the Dark treatment (Fig. 4b). Lys makes up a notable fraction of THAA in bacteria (5–15 %) (Cowie and Hedges, 1992), so a lower concentration in sediment THAA likely indicated decreased bacterial activity. Additional studies suggest that Lys is selectively degraded due to its simple structure
25
BGD
10, 2791–2834, 2013SOM compositions in shallow photic
sediments
A. K. Hardison et al.
Title Page
Abstract Introduction
Conclusions References
Tables Figures
◭ ◮
◭ ◮
Back Close
Full Screen / Esc
Printer-friendly Version Interactive Discussion
Discussion
P
a
per
|
Dis
cussion
P
a
per
|
Discussion
P
a
per
|
Discussio
n
P
a
per
4.3 Synthesis
PCA results provide a summary of the changes in the dominant controls on SOM on day 1 versus day 42. On day 1, PLFA composition in light treatments differed from dark, which likely reflects the fact that the dark treatments were incubated in the dark for two weeks prior to the start of the experiment. PLFA composition reflected the
5
contribution of algal fatty acids to SOM in both light treatments relative to the Dark treatment; however, since macroalgae were only present for 1 day, there were no sig-nificant macroalgae differences. On day 1 HAA composition did not yet differ between any treatments. By day 42, after macroalgal biomass had increased by 4-fold, all treat-ments displayed a gradient of PLFA and HAA composition. Sediment composition in
10
the Macro treatment shifted away from the Light treatment towards the Dark treatment, with less influence from algal PLFA and the more labile amino acids (e.g. Leu, Ile) and more influence from bacterial PLFA and less labile amino acids (e.g. Gly, D-Ala). In both light treatments, we also observed shifts in MPB community composition by day 42. On day 1, 20:5ω3 was the most prominent algal PUFA, and by day 42, algae
15
producing 18:2ω6 contributed relatively more to algal PLFA than on day 1.
Overall, MPB fundamentally altered SOM quality and quantity; however, the role of MPB as a source of labile SOM was significantly diminished due to shading by macroalgae. The potential ecological consequences of decreased MPB production are numerous. For example, biogeochemical processes such as nitrification and
denitrifi-20
cation are affected by diel variations in oxygen related to MPB metabolism as well as competition with MPB for dissolved N (An and Joye, 2001; Rysgaard et al., 1995). In addition, MPB are a nutrient-rich food source for numerous faunal grazers (Miller et al., 1996) and to heterotrophic bacteria (Banta et al., 2004). Sediment stability is also en-hanced by the presence of benthic diatoms that produce EPS (Tolhurst et al., 2002).
25
BGD
10, 2791–2834, 2013SOM compositions in shallow photic
sediments
A. K. Hardison et al.
Title Page
Abstract Introduction
Conclusions References
Tables Figures
◭ ◮
◭ ◮
Back Close
Full Screen / Esc
Printer-friendly Version Interactive Discussion
Discussion
P
a
per
|
Dis
cussion
P
a
per
|
Discussion
P
a
per
|
Discussio
n
P
a
per
|
shading by macroalgae significantly altered SOM properties that influence ecosystem processes, and chronic shading by dense macroalgal blooms, characteristic of some eutrophied systems, will likely result in surface sediments that more closely resemble sediments in regions unaffected by light.
Supplementary material related to this article is available online at: 5
http://www.biogeosciences-discuss.net/10/2791/2013/ bgd-10-2791-2013-supplement.pdf.
Acknowledgements. This work would not have been possible without the help of M. Lucken-bach, S. Fate, and R. Bonniwell at the Virginia Institute of Marine Science (VIMS) Eastern Shore Lab as well as R. Bushnell, J. Cope, E. Ferer, E. Lerberg, D. Maxey, L. Palomo, S. Sal-10
isbury, C. Smith, J. Stanhope, and H. Walker at VIMS. We are also grateful to J. Middelburg and M. Houtekamer at the Netherlands Institute for Sea Research (NIOZ). This research was supported by the National Science Foundation (Virginia Coast Reserve-Long Term Ecological Research project 0080381 and 0621014); Division of Environmental Biology (DEB) Ecosys-tems Program 0542645 to I.C.A. and E.A.C. and 0542635 to C.R.T., the European Association 15
of Organic Geochemists (Shell Travel Award to A.K.H.), the Environmental Protection Agency (EPA FP916722010 to A.K.H.), the Netherlands Organization for Scientific Research (Pionier 833.02.2002 to B.V.), and the Darwin Center for Biogeology (project 142.16.1052 to B.V.). The EPA has not officially endorsed this publication and the views expressed herein may not reflect the views of the EPA. This is VIMS publication xxxx.
BGD
10, 2791–2834, 2013SOM compositions in shallow photic
sediments
A. K. Hardison et al.
Title Page
Abstract Introduction
Conclusions References
Tables Figures
◭ ◮
◭ ◮
Back Close
Full Screen / Esc
Printer-friendly Version Interactive Discussion
Discussion
P
a
per
|
Dis
cussion
P
a
per
|
Discussion
P
a
per
|
Discussio
n
P
a
per
References
An, S. and Joye, S. B.: Enhancement of coupled nitrification-denitrification by benthic photo-synthesis in shallow estuarine sediments, Limnol. Oceanogr., 46, 62–74, 2001.
Anderson, I. C., McGlathery, K. J., and Tyler, A. C.: Microbial mediation of “reactive” nitrogen transformations in a temperate lagoon, Mar. Ecol. Prog. Ser., 246, 73–84, 2003.
5
Banta, G. T., Pedersen, M. F., and Nielsen, S. L.: Decomposition of marine primary producers: consequences for nutrient recycling and retention in coastal ecosystems, in: Estuarine Nutri-ent Cycling: The Influence of Primary Producers, edited by: Nielsen, S. L., Banta, G. T., and Pedersen, M. F., Kluwer Academic Publishers, The Netherlands, 187–216, 2004.
Barranguet, C., Herman, P. M. J., and Sinke, J. J.: Microphytobenthos biomass and community 10
somposition studied by pigment biomarkers: importance and fate in the carbon cycle of a tidal flat, J. Sea Res., 38, 59–70, 1997.
Benoy, G. A. and Kalff, J.: Sediment accumulation and Pb burdens in submerged macrophyte beds, Limnol. Oceanogr., 44, 1081–1090, 1999.
Bligh, E. G. and Dyer, W. J.: A rapid method of total lipid extraction and purification, Can. J. 15
Biochem. Physiol., 37, 911–917, 1959.
Boschker, H. T. S., Wielemaker, A., Schaub, B. E. M., and Holmer, M.: Limited coupling of macrophyte production and bacterial carbon cycling in the sediments ofZosteraspp. mead-ows, Mar. Ecol. Prog. Ser., 203, 181–189, 2000.
Bouillon, S. and Boschker, H. T. S.: Bacterial carbon sources in coastal sediments: a cross-20
system analysis based on stable isotope data of biomarkers, Biogeosciences, 3, 175–185, doi:10.5194/bg-3-175-2006, 2006.
Canuel, E. A. and Martens, C. S.: Seasonal-variations in the sources and alteration of organic-matter associated with recently-deposited sediments, Org. Geochem., 20, 563–577, 1993. Canuel, E. A. and Martens, C. S.: Reactivity of recently deposited organic matter: degrada-25
tion of lipid compounds near the sediment-water interface, Geochim. Cosmochim. Acta, 60, 1793–1806, 1996.
Canuel, E. A., Cloern, J. E., Ringelberg, D. B., Guckert, J. B., and Rau, G. H.: Molecular and isotopic tracers used to examine sources of organic matter and its incorporation into the food webs of San Francisco Bay, Limnol. Oceanogr., 40, 67–81, 1995.
BGD
10, 2791–2834, 2013SOM compositions in shallow photic
sediments
A. K. Hardison et al.
Title Page
Abstract Introduction
Conclusions References
Tables Figures
◭ ◮
◭ ◮
Back Close
Full Screen / Esc
Printer-friendly Version Interactive Discussion
Discussion
P
a
per
|
Dis
cussion
P
a
per
|
Discussion
P
a
per
|
Discussio
n
P
a
per
|
Canuel, E. A., Freeman, K. H., and Wakeham, S. G.: Isotopic compositions of lipid biomarker compounds in estuarine plants and surface sediments, Limnol. Oceanogr., 42, 1570–1583, 1997.
Canuel, E. A., Spivak, A. C., Waterson, E. J., and Duffy, J. E.: Biodiversity and food web struc-ture influence short-term accumulation of sediment organic matter in an experimental sea-5
grass system, Limnol. Oceanogr., 52, 590–602, 2007.
Cook, P. L. M., Butler, E. C. V., and Eyre, B. D.: Carbon and nitrogen cycling on intertidal mudflats of a temperate Australian estuary I. Benthic metabolism, Mar. Ecol. Prog. Ser., 280, 25–38, 2004.
Cook, P. L. M., Veuger, B., Boer, S., and Middelburg, J. J.: Effect of nutrient availability on carbon 10
and nitrogen incorporation and flows through benthic algae and bacteria in near-shore sandy sediment, Aquat. Microb. Ecol., 49, 165–180, 2007.
Cowie, G. L. and Hedges, J. I.: Sources and reactivities of amino-acids in a coastal marine-environment, Limnol. Oceanogr., 37, 703–724, 1992.
Dauwe, B. and Middelburg, J. J.: Amino acids and hexosamines as indicators of organic matter 15
degradation state in North Sea sediments, Limnol. Oceanogr., 43, 782–798, 1998.
Dijkman, N. A. and Kromkamp, J. C.: Phospholipid-derived fatty acids as chemotaxonomic markers for phytoplankton: application for inferring phytoplankton composition, Mar. Ecol. Prog. Ser., 324, 113–125, 2006.
Duarte, C. M.: Submerged aquatic vegetation in relation to different nutrient regimes, Ophelia, 20
41, 87–112, 1995.
Duffy, J. E. and Harvilicz, A. M.: Species-specific impacts of grazing, amphipods in an eelgrass-bed community, Mar. Ecol. Prog. Ser., 223, 201–211, 2001.
Evrard, V., Cook, P. L. M., Veuger, B., Huettel, M., and Middelburg, J. J.: Tracing carbon and nitrogen incorporation and pathways in the microbial community of a photic subtidal sand, 25
Aquat. Microb. Ecol., 53, 257–269, 2008.
Fonseca, M. S. and Calahan, J. A.: A preliminary evaluation of wave attenuation by four species of seagrass, Estuar. Coast. Shelf S., 25, 565–576, 1992.
Gacia, E., Duarte, C. M., and Middelburg, J. J.: Carbon and nutrient deposition in a Mediter-ranean seagrass (Posidonia oceanica) meadow, Limnol. Oceanogr., 47, 23–32, 2002. 30