Article
Printed in Brazil - ©2017 Sociedade Brasileira de Química0103 - 5053 $6.00+0.00*e-mail: [email protected]
Distribution and Sources of Aliphatic and Polycyclic Aromatic Hydrocarbons in
Surface Sediments of Itajaí-Açu Estuarine System in Brazil
Morgana Frena,*,a Giovana A. Bataglion,b Sara S. Sandini,c Katia N. Kuroshima,c
Marcos N. Eberlinb and Luiz A. S. Madureiraa
aDepartamento de Química, Universidade Federal de Santa Catarina,
Campus Universitário Trindade, 88040-900 Florianópolis- SC, Brazil
bLaboratório ThoMSon de Espectrometria de Massas, Instituto de Química,
Universidade Estadual de Campinas, 13083-970 Campinas-SP, Brazil
cCentro Tecnológico de Ciência da Terra e do Mar, Universidade do Vale do Itajaí,
88302-202 Itajaí-SC, Brazil
The Itajaí-Açu estuarine system, located in southern Brazil, has great economic importance due to the presence of two ports (Itajaí and Navegantes). This system is affected by industrial and dredging activities, which can cause the remobilization of pollutants accumulated over time in the sediment. In this context, hydrocarbons were assessed in twelve surface sediment samples.
n-Alkane and polycyclic aromatic hydrocarbons (PAH) concentrations were determined by gas chromatography and their sources assessed. Total concentrations ranged between 0.50 ± 0.04 and 69.70 ± 3.90 µg g-1 dry weight (d.w.) for n-alkanes and from 63.9 ± 12.1 to 1459.0 ± 43.5 ng g-1 d.w. for PAH. Most of the sediment samples presented carbon preference index (CPI) values close to unity, indicating that the area is submitted to petroleum-related sources, mainly close to Itajaí harbor, where an intense unresolved complex mixture (UCM) was observed. The presence at all stations of αβ-hopane biomarkers also indicated petrogenic input. Based on selected PAH ratios, the sedimentary PAH composition reflects a mixture of both petrogenic and pyrolytic sources. A comparison of the PAH concentrations found in this study with those listed in the sediment quality guidelines (SQGs) indicated that adverse biological effects on the biota are rarely expected.
Keywords: aliphatic hydrocarbon, polycyclic aromatic hydrocarbon, biomarker, hopane, contamination
Introduction
Contamination levels in coastal environments are increasing mainly due to the presence of anthropogenic activities, as waste industrial discharges, industrial activities, navigation traffic, etc.1 Therefore, sediment contamination in such areas may occur. In several countries, port activities are rapidly developing, requiring greater attention, especially in relation to the dredging of contaminated sediments and environmental management.2,3
The Itajaí-Açu estuarine system is located on the north-central coast of Santa Catarina state, in Brazil. This is an area of economic interest not only because of tourism, but also due to the presence of the Port of Itajaí, which is considered the third largest container handling
port in Brazil, the major international trading point of the state, and the largest national fishing pole landing site. Associated with this latter activity, several fish processing industries are installed along the margins of this estuary, mainly in the city of Itajaí. These industries dispose their waste products, usually without any treatment, directly into the estuary.4-7 In addition, the harbor area is constantly dredged, in order to maintain the navigation channel at an elevation of 11 meters. In May 2011, dredging began to deepen the main river channel, aiming to increase the depth from 11 to 14 meters, allowing the entrance of larger ships. Sediment dredging can cause remobilization of the pollutants accumulated in this compartment over time.6
are from biogenic, diagenetic, pyrolytic and petrogenic.10,11 In aquatic environments, hydrocarbons tend to associate with particulate organic matter due to their hydrophobic nature and they are subsequently deposited in the underlying sediments,12,13 which are recognized as excellent sinks for such pollutants.14
n-Alkanes are commonly used to characterize organic matter from various environments due to their source specificity. Long chain n-alkanes with an odd number of carbons (C27-C35) are the main components of epicuticular waxes of higher plants, while aquatic algae are dominated by shorter chain n-alkanes with an odd number of carbons (predominantly C15, C17 and C19).15 On the other hand, n-alkanes from petroleum show little or no predominance of either odd or even chain lengths.16
Hopanes are a particular class of pentacyclic triterpane biomarkers that originate from precursors in bacterial membranes.17,18 Due to their resistance to biodegradation, they are used to show the presence of oil and its refined products in the environment. Hopane stereoisomers exist in α/β and/or R/S configurations, which differ in terms of their thermodynamic stability. The naturally hopanoid precursors generally have the 17β(Η), 21β(Η)
stereochemistry and occur with only the R configuration at the C22 position. The ββ configuration occurs in living organisms and in ancient shales, which have experienced little thermal stress, whereas hopanes with the αβ
configuration are characteristic of petroleum due to their greater thermodynamic stability.19
PAH are widespread contaminants present throughout the marine environment and they also have been used to assess oil or pyrogenic contamination in marine sediments.20 PAH are known for their carcinogenic and mutagenic effects21 and therefore, they have been included in the United States Environmental Protection Agency (US EPA) priority pollutants list. They may enter the marine environment through several routes including atmospheric deposition, river runoff, domestic and industrial outfalls, and direct spillage of petroleum or petroleum products. In addition, there are inputs from natural sources, but they are usually low when compared to those from anthropogenic sources.22 The determination of PAH in sediments has been the subject of intensive studies from the mid-1970s to the present day and this environmental compartment serves as a useful index for the contamination level and the source of PAH inputs to the aquatic environment.23-28
There is limited information regarding the current distribution and sources of petroleum biomarkers in the sediments of the Itajaí-Açu estuarine system.29 In fact, the absence of data related to South American estuaries in general is one of the motivations for this study. In addition,
petroleum biomarkers in aquatic environments need to be identified in order to provide information regarding their anthropogenic impact on the environment, as well as to serve as a contamination load indicator. In this context, the aims of this study were: determine the grain size of the sediment samples to evaluate the behavior of organic matter when incorporated into the sediment; obtain information regarding the origin of organic matter by the ratio of total organic carbon and total nitrogen (TOC/TN) and investigate the distribution and sources of aliphatic and polycyclic aromatic hydrocarbons in surface sediment samples of this important estuarine system.
Experimental
Study area and sample collection
The Itajaí-Açu estuarine system has an estimated population of 1 million people and is located in the terminal portion of the Itajaí-Açu River, with the Itajaí City on the south and Navegantes City on the north. The estuary receives industrial and domestic effluents of these cities, besides the contribution of cities in the vicinity, such as Blumenau, Brusque and Gaspar. In this region is located the biggest fishing port of the country and several fish processing industries.30
The local astronomical tide is mixed with dominance of semi-diurnal tides. The fluvial regime is highly variable. The Itajaí-Açu River drains 15,500 km2, with an average river discharge of 230 m3 s-1. The estuarine circulation resulting of the physical agents, marine and fluvial, is a pattern highly stratified, where salt intrusion extends for tens of kilometers upstream of estuarine mouth. The meteorological and oceanographic conditions in this region are driven not only by the fresh water delivery, astronomical tides and local wind, but also by remote processes such as storm waves and tsunamis.30
The local climate is classified as mesothermal wet without water deficit during the year. The average annual temperature is 21.8 ºC, with average annual rainfall of 1416 mm and an average annual evapotranspiration of 1080 mm, resulting in an average fluid of 336 mm. The local wind climate is quite different from not so far coastal areas, mainly by the strong signal of breezes, like sea/land breeze and mountain/valley breeze. The coastal currents present a strong bi-directional regime south-southeast-north-northeast (SSE-NNO). Near surface currents are influenced by the estuary-shelf interactions, being driven by the brackish waters plume dispersion.5,30
varies spatially and temporally, according to the discharge regime of the Itajaí-Açu River. During periods of lower discharges, the sediments of estuary are dominated by silt and clay, while during periods of higher discharge (e.g., 700 m3 s-1) increases the sand content in sediments, resulting from river transport. Although these variable spatial and temporal variations, sediments in the estuarine basin are dominated by the clay fraction.5
A total of twelve surface sediment samples (0-10 cm depth) were collected from the Itajaí-Açu estuarine system in July 2011. The locations were selected in order to cover a large area, taking into consideration the industrial and dredging activities carried out in the estuarine system. The geographical locations of the sampling sites are shown in Figure 1 and site descriptions are given in Table 1.
Sediment samples were collected using a van-Veen dredge sampler, stored in glass jars (previously cleaned to organic trace analysis) and kept at 4 °C during transport to the laboratory. At laboratory, all sediment samples were freeze-dried, pulverized with a mortar, sieved through a stainless steel sieve (< 250 µm) and stored at 4 °C prior to analysis.
Chemicals and reagents
A standard stock solution containing C7-C40 saturated
alkanes, each one at 1000 mg mL-1 in hexane, was
obtained from Supelco (Bellefonte, PA, USA). A standard PAH mixture containing acenaphthene, acenaphthylene, anthracene, benzo[a]anthracene, benzo[a]pyrene, benzo[b] fluoranthene, benzo[g,h,i]perylene, benzo[k]fluoranthene, chrysene, dibenzo[a,h]anthracene, fluoranthene, fluorene, indeno[1,2,3,cd]pyrene, naphthalene, phenantrene and
pyrene, each one at 2.0 mg mL-1 in dichloromethane:benzene, was obtained from AccuStandard (New Haven, CT, USA). A mixture containing the perdeuterated compounds acenaphthene-d10, chrysene-d12, naphthalene-d8,
perylene-d12 and phenantrene-d10 was obtained from
AccuStandard (New Haven, CT, USA). The perdeuterated C30 n-alkane was obtained from Supelco (Bellefonte, PA, USA). All solvents used for sample processing and analyses (HPLC-grade methanol, n-hexane and dichloromethane) were purchased from Tedia (RJ, Brazil).
Table 1. Itajaí-Açu estuarine system surface sediment characteristics, description of the sampling sites, grain size fractions, total organic carbon (TOC),
total nitrogen (TN) and TOC/TN ratio
Station Station description Latitude Longitude Sand / % Silt / % Clay / % TOC / % TN / % TOC/TN
1 Detroit shipyard 26°51’30.27’’ 48°43’17.75’’ 2.1 30.0 67.9 1.82 0.11 16.5
2 terminal harbor of Itajaí 26°52’33.48’’ 48°42’45.40’’ 10.8 30.1 59.1 1.66 0.12 13.8
3 Itajaí-Mirim outfall 26°53’11.38’’ 48°40’59.80’’ 0.7 39.7 59.6 1.68 0.14 12.0
4 Itajaí shipyard 26°53’25.51’’ 48°40’04.62’’ 74.1 9.3 16.6 1.27 0.11 11.5
5 Itajaí harbor 26°53’55.34’’ 48°40’01.13’’ 8.6 41.3 50.1 0.43 0.02 21.5
6 Pier CEPSUL/IBAMA 26°54’30.57’’ 48°39’02.65’’ 5.4 42.3 52.3 0.11 0.01 11.0
7 South Pier 26°54’49.56’’ 48°38’05.20’’ 86.1 4.7 9.3 1.61 0.01 161.0
8 Navegantes Beach 26°53’33.42’’ 48°38’28.27’’ 99.6 0.4 0.0 0.08 0.03 2.7
9 Brava Beach 26°56’24.29’’ 48°37’35.31’’ 98.1 1.9 0.0 0.03 0.05 0.6
10 discharge Navegantes 26°53’36.00’’ 48°35’35.00’’ 20.2 52.2 27.6 1.44 0.11 13.0
11 discharge Brava 26°56’33.00’’ 48°35’50.00’’ 13.3 38.2 48.5 1.17 0.11 10.6
12 control sample 26°54’30.10’’ 48°32’30.10’’ 16.9 39.3 43.8 0.05 0.01 5.0
Figure 1. (a) Brazil; (b) Santa Catarina state; (c) map of study area showing
Analytical methods
Homogenized sediment samples (ca. 1 g) were acidified with 0.1 mol L-1 HCl solution, in order to remove carbonates, rinsed with deionized water and dried at 60 °C before the determination of total organic carbon (TOC). Total nitrogen (TN), total hydrogen (TH) and TOC were determined using an elemental analyzer (Carlo Erba EA 1110, Wigan, Reino Unido).
Grain size analysis (clay, silt and sand fractions) was carried out using the conventional method described by Suguio.31 Briefly, the classic methods of sieving and pipetting were used. The grading scale used for the separation of the grain size was the Wentworth scale.
In order to investigate the presence and distribution of n-alkanes, hopanes and PAH, 5 g of lyophilized sediments were successively extracted (three times) via ultrasonication for 30 min into 15 mL of a mixture of dichloromethane:methanol (2:1) (adapted from EPA 3540C).32 Extracts were concentrated in a rotary evaporator and fractionated using a chromatographic column containing activated silica (10 g), alumina (1 g) and metallic copper (2 g). The aliphatic fraction (containing n-alkanes and hopanes) was eluted with 55 mL of hexane and the aromatic fraction with 70 mL of hexane:dichloromethane (1:1).
T h e n- a l k a n e s w e r e a n a l y z e d w i t h a g a s chromatograph (GC) (Thermo Finnigan model Trace GC Ultra, Waltham, MA, USA) with a split/splitless injector and flame ionization detector (FID). A Restek RTX-5MS capillary column (30 m, 0.25 mm internal diameter (i.d.) and 0.25 µm df) was used under the following conditions: nitrogen as the carrier gas, splitless mode (1 min) and temperature program: 50 °C (held for 5 min), increasing at 6 °C min-1 to 300 °C (held for 20 min). The injector and detector temperatures were kept at 280 and 300 °C, respectively. Compounds were individually identified by matching the retention time to the results obtained from a standard n-alkane mixture.
For the determination of the hopanes, analyses were performed with a gas chromatograph (7890 A model, Agilent, Santa Clara, CA, USA) coupled with a quadrupole mass spectrometer (MS) (5975 C model, Agilent, Santa Clara, CA, USA) operating in full scan mode in a m/z range of 50 to 500. Sample injections (1 µL) were performed using a MultiPurpose Sampler (MPS2, Gerstel). The column and temperature program were the same as those used for the n-alkanes determination. The MS interface temperature, source temperature and the manifold temperature was 300, 200 and 150 ºC, respectively. The electron ionization source (70 eV) was switched on only after a 5-min period. Helium (99.999% purity) at a flow rate of 1.0 mL min-1
was used as the carrier gas. The hopanes were identified by comparison with the chromatographic fingerprint of a Brazilian oil sample and with the mass spectra published by Philp.19 The characteristic ions monitored for terpanes (hopanes) were m/z 191, 177 and 205.
The aromatic fraction was analyzed by gas chromatography coupled to mass spectrometry using a Thermo Finnigan model Trace GC Ultra GC interfaced to a Thermo Finnigan Polaris Q (ion trap mass analyzer), operated in full scan mode, in a m/z range of 50 to 500. A Restek RTX-5MS capillary column (30 m, 0.25 mm i.d., 0.25 µm df) was used under the following conditions: helium as the carrier gas (1 mL min-1), splitless mode (1 min) and temperature program with heating from 50 °C (5 min), then increasing at 6 °C min-1 to 300 °C, which was held for 10 min. The transfer line temperature and the ion source temperature was 280 and 200 °C, respectively, with an electron ionization source of 70 eV. Conditions were based on previous studies.29,33 PAH were individually identified by matching the retention time to the PAH standard mixture results and also through examination of the fragmentation profiles.
Quality assurance and quality control
Prior to the analysis, the standard solutions of n-alkanes and PAH were run to check the column performance and resolution. Quality assurance procedures, including appropriate blanks, were performed for each sample set, and no peaks interfered with the determination of the target compounds.
Quality assurance procedures included analytical curves for the quantification of n-alkanes and PAH in the sediment samples. Analytical curves for n-alkanes and PAH were plotted with six concentrations, covering the expected sample concentrations. In order to quantify n-alkanes, perdeuterated C30 n-alkane was added as the internal standard and coefficients of determination (R2) were higher than 0.9902 for all analytes. In the case of PAH, a mixture containing the perdeuterated compounds acenaphthene-d10, chrysene-d12,
naphthalene-d8, perylene-d12 and phenantrene-d10 obtained
from AccuStandard (New Haven, CT, USA) was added as the internal standard and coefficients of determination higher than 0.9918 for all analytes (given in Supplementary Information section, Table S3) were obtained.
In order to evaluate the analysis precision, the sediment samples obtained from the Itajaí-Açu estuarine system were analyzed in triplicate and relative standard deviations were lower than 15%.
perdeuterated n-hexadecane for AHs) prior to extraction. For both n-alkane and PAH, surrogate standard recoveries for all samples were in the range of 70-94%.
The method detection limit (MDL) and method quantification limit (MQL) were also determined during the sediment sample analysis. The MDL was calculated through seven replicates analyses. MDL = t × S, where t = 3.143 is the Student’s value at the 99% confidence level and S is the replicate analysis standard deviation, with n − 1 degrees of freedom. The MQL was estimated as three times the MDL value. For n-alkanes, the MDL was in the range of 0.05-0.33 µg g-1, while for PAH method detection limits were in the range of 2.1-9.5 ng g-1.
Principal component analysis
Principal component analysis (PCA) was performed using the Statistica 8.0 software (StatSoft Inc., Tulsa, USA) to identify similarities or distinctions among the sampling sites. For treatment, samples were taken as cases and the hydrocarbons as variables. The PCA datasheet consists of the original values of n-alkane and PAH concentrations at each sampling site.
Results and Discussion
Grain size distribution, TOC and TOC/TN
The grain size distribution varied widely in the sampling stations, with the sand fraction ranging between 0.7 (station 3) and 99.6% (station 8) (Table 1), whereas in a previous study, with sediment samples collected in 2008,29 it varied between 1.2 and 33.3%. However, the high percentage of sand was found in the stations located in the beach areas (Navegantes and Brava), which explain the difference to the previous study that only analyzed samples inside the estuary. Then, in general, except for the stations located in the beach, the sampling area appears to be a depositional environment, with a predominance of silt + clay fractions.
The TOC concentrations, which are a fundamental proxy for describing the abundance of organic matter in sediments,34 ranged from 0.03 (station 9) to 1.82% (station 1). These values are similar to those obtained for other estuarine systems.35,36 It is important to note that the highest TOC percentage (1.82%) was found at station 1, which also showed a high fine particle percentage (silt + clay = 97.9%). This is in agreement with the findings of previous studies, indicating that fine sediments are more susceptible to organic matter accumulation and preservation.37 TOC concentrations represent the fraction of organic matter that escaped remineralization during
sedimentation and are influenced by both initial production of biomass and subsequent degree of degradation.34 Regarding TOC values, these are consistent with results previously reported for the same area (between 0.89 and 1.79%).29 However, some stations have showed lower values for TOC in the present study (Table 1) and it can be attributed to the location of these samples, which are located in non-estuarine areas, in the beach and next to the ocean (stations 8, 9 and 12). Regression analysis was used to investigate the relation between the TOC and fine particles. The statistical results showed no significant correlation between TOC and fine particles (R2 = 0.058; p = 0.520). We think that the no correlation occurs maybe due to additional sources of TOC which are not associated with river runoff, or clay from landfills which are deposited in the sediments. The TN content ranged between 0.01 and 0.14, similarly to those obtained in the same area by Oliveira and Madureira.29 The TOC/TN ratio has been widely used to infer organic matter origin and sources, as different organism groups present different TOC and TN contents.38 Nonvascular aquatic plants have low TOC/TN ratios, typically between 4 and 10, whereas vascular land plants, which contain cellulose, have TOC/TN ratios of 20 or higher.15 The TOC/TN values (0.6-161.0) shown in Table 1 indicate a mixture of allochthonous and autochthonous organic matter inputs. This variability in the TOC/TN values is common in semi-enclosed and shallow environments due to the mixed nature of the organic matter sources.38 A pattern was observed in TOC/TN values, where the stations located inside the river were more influenced by allochthonous inputs. In contrast, autochthonous inputs predominated in the stations located near to the sea. Comparing the values obtained in this study with those previously reported for the same area (between 7.1 and 9.4),29 we can observe a larger input of terrestrial plants in the present study, mainly in the stations located in the river (stations 1-7). These results are consistent with the organic matter input from mangrove forest around the Itajaí-Açu River estuary and may also indicate the anthropogenic organic matter input due to the port activities. Additionally, stations 10 and 11 showed TOC/TN values close to those observed for samples located within the estuary and this occurs because these stations are discharge points of the sediments taken from inside the estuary.
Aliphatic hydrocarbons
The n-alkanes concentrations in the surface sediment samples are shown in Table 2. Total n-alkanes concentrations showed a wide range from 0.50 ± 0.04 (station 7) to 69.70 ± 3.90 µg g-1 dry weight (d.w.) (station 3). This range reflects the complexity of these environments in relation to sources of inputs and circulation, sedimentation and degradation patterns. The lowest total n-alkanes concentration observed at station 7 may be associated with the low quantity of fine sediment particles (silt + clay = 14%), which have larger relative surface areas than coarse particles and can adsorb colloidal and dissolved organic matter, forming sedimentary complexes.38 However, despite the station 7 showed the lowest total n-alkanes concentration, the TOC value was enhanced (1.61) compared to the stations with high sand amount (S8 and S9). This can be attributed to other sources of carbon which are not commonly found by the methodology used herein. Moreover, the TOC/TN value of 161.0 at this station indicates inputs from anthropogenic sources.
The highest total n-alkanes concentrations (69.70 ± 3.90 and 52.80 ± 3.40 µg g-1 d.w., respectively) were found at stations 3 (Itajaí-Mirim outfall) and 5 (Itajaí harbor), which showed a high quantity of fine sediment particles (silt + clay > 90%). However, granulometric fractions versus total n-alkanes concentrations showed a weak correlation (R2 = 0.30, p < 0.05), which indicates that grain size was not the main factor influencing the concentrations, although it has participation. The harbor has constant shipping traffic, which may explain the relatively high hydrocarbon concentration due to oil spills from vessels. Moreover, the Itajaí-Mirim outfall is a tributary of the
Itajaí-Açu River, the largest outlet in Santa Catarina state, responsible for most part of the river inflow to the estuary, draining an area of 15,500 km2.4,5 Its drainage basin is marked by the presence of some of major cities of the state and receives its wastewater,4 which may cause the upload of contaminants in the sediments of this area. The total n-alkanes concentrations found in Itajaí-Açu estuarine system are comparable to those of other estuarine and coastal environments around the world (given in Supplementary Information section, Table S2). In general, the total n-alkanes concentrations found in this study were higher than those observed for other sediment samples collected from coastal areas such as the Mandovi Estuary,39 Marmugoa harbor,39 Pearl River Estuary40 and Babitonga Bay29 (0.8-3.2, 1.6-10.7, 3.43-7.06 and 1.22-5.57 µg g-1, respectively), whereas similar concentrations were found in Brazilian areas such as the Laguna estuarine system33 and Sergipe River estuarine system (0.9-45.6 and 9.9-30.8 µg g-1, respectively).36 Additionally, total n-alkane concentrations found in this study were higher than those found by Oliveira and Madureira29 for the Itajaí-Açu estuarine system in a previous study (3.34-18.14 µg g-1). This indicates that the port activities are probably contributing to the increased contamination by oil derivatives in the sediments, as expected due to the intense traffic of ships.
Sediment samples collected from the Itajaí-Açu estuarine system showed the presence of n-alkanes ranging between n-C13 and n-C35, with a higher predominance of long chain n-alkanes (between n-C21 and n-C32). It has been proposed that short chained n-alkanes (n-C15 and n-C21) are
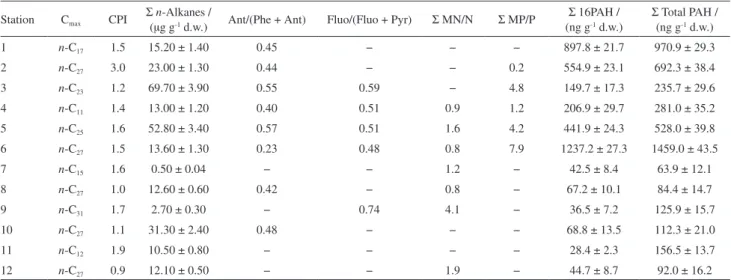
Table 2. Concentrations and ratios of hydrocarbons in the sediment samples collected from the Itajaí-Açu estuarine system
Station Cmax CPI
Σ n-Alkanes /
(µg g-1 d.w.) Ant/(Phe + Ant) Fluo/(Fluo + Pyr) Σ MN/N Σ MP/P
Σ 16PAH / (ng g-1 d.w.)
Σ Total PAH / (ng g-1 d.w.)
1 n-C17 1.5 15.20 ± 1.40 0.45 − − − 897.8 ± 21.7 970.9 ± 29.3
2 n-C27 3.0 23.00 ± 1.30 0.44 − − 0.2 554.9 ± 23.1 692.3 ± 38.4
3 n-C23 1.2 69.70 ± 3.90 0.55 0.59 − 4.8 149.7 ± 17.3 235.7 ± 29.6
4 n-C11 1.4 13.00 ± 1.20 0.40 0.51 0.9 1.2 206.9 ± 29.7 281.0 ± 35.2
5 n-C25 1.6 52.80 ± 3.40 0.57 0.51 1.6 4.2 441.9 ± 24.3 528.0 ± 39.8
6 n-C27 1.5 13.60 ± 1.30 0.23 0.48 0.8 7.9 1237.2 ± 27.3 1459.0 ± 43.5
7 n-C15 1.6 0.50 ± 0.04 − − 1.2 − 42.5 ± 8.4 63.9 ± 12.1
8 n-C27 1.0 12.60 ± 0.60 0.42 − 0.8 − 67.2 ± 10.1 84.4 ± 14.7
9 n-C31 1.7 2.70 ± 0.30 − 0.74 4.1 − 36.5 ± 7.2 125.9 ± 15.7
10 n-C27 1.1 31.30 ± 2.40 0.48 − − − 68.8 ± 13.5 112.3 ± 21.0
11 n-C12 1.9 10.50 ± 0.80 − − − − 28.4 ± 2.3 156.5 ± 13.7
12 n-C27 0.9 12.10 ± 0.50 − − 1.9 − 44.7 ± 8.7 92.0 ± 16.2
derived from algae and bacteria,39 although the absence of these compounds may also be related to degraded organic matter. The n-alkane distribution at most stations showed no odd/even hydrocarbon dominance, which can indicate the presence of petroleum (Figure 2).10
The carbon preference index (CPI), defined as the odd to even carbon-number n-alkanes ratio in the range of n-C25 to n-C34,41 was used to assess biogenic and petroleum-related input sources. CPI values of ca. 1 are regarded as indicative of input from microorganisms, recycled organic matter, and/or petroleum, whereas natural inputs have values of > 3.42 The CPI index for the Itajaí-Açu estuarine system sediments varied between 0.9 and 3.0, implying that the n-alkanes present originated from a mixture of biogenic and petroleum sources. At station 2, the CPI was 3.0, suggesting a major contribution from the epicuticular waxes of higher plants,15 which is consistent with the C
max value obtained for this station (n-C27). However, the CPI values for most stations were close to 1.0, indicating a significant input of AHs from petroleum sources.
Unresolved complex mixtures (UCMs) are considered to be the result of many coelutions of structurally complex isomers and homologues of branched and cyclic hydrocarbons.10 Their occurrence is generally associated with degraded or weathered petroleum residues because these molecules are resistant to biodegradation and accumulate in sediments.43 The UCM observed at station 5 (Figure 2) suggests the presence of petroleum input, which is consistent with the CPI value (1.6) obtained for this station. Despite the absence of UCM in other samples, as shown for station 1 in Figure 2, the n-alkane distribution showed no odd/even hydrocarbon dominance, which is an indicative that the n-alkanes originate from petroleum sources.10
Petroleum biomarkers were also investigated in this study. A hopane series ranging from C27 to C35 was detected in all sediment samples (Figure 3). The predominance of a thermodynamically stable α,β-hopane configuration19 supports the suggestion of petrogenic hydrocarbon inputs to these sediments. Confirmation of the fossil fuel origin of the hopanes was provided by the presence of 22S and 22R epimers of extended C31-C35α,β hopanes. This distribution was observed in the twelve sediment samples.
Station 12 is considered as a control location, subject only to inputs from biogenic sources, because it is
Figure 2. n-Alkanes partial GC-FID chromatograms for samples collected from stations 1 (Detroit shipyard), station 3 (Itajaí-Mirim outfall) and station 5
(close to Itajaí harbor).
Figure 3. Extracted ion chromatogram (m/z 191) of pentacyclic triterpanes
located far from the harbor and thus it was not expected to find contamination in this area. Although the total n-alkanes concentration was relatively low at this station (12.10 ± 0.50 µg g-1 d.w.), the presence of hopanes with the thermodynamically more stable 17α,21β configuration indicated that contamination is present, in agreement with the CPI value (0.9). This is probably due to ocean currents, which may carry the contaminated sediment away.4 Furthermore, the granulometric analyses have shown that this is a depositional area, with silt + clay percentage of 83.1.
The relative distribution of hopanes in the sediments is shown in Figure 4. All stations showed a high relative distribution of anthropogenic-related hopanes (represented by αβ hopanes, including S and R epimers), indicating the presence of contamination by petroleum and related
products, since hopanes with an αβ configuration
are characteristic of petroleum due to their higher thermodynamic stability. Diesel and gasoline were excluded as possible sources, since they are obtained from the low boiling point fraction of crude oils, which does not contain hopanes.44 On the other hand, other petroleum-related products, such as lubricating oils, may be potential sources.
Polycyclic aromatic hydrocarbons
The concentrations and sources of PAH were also evaluated. The 16 priorities PAH and its methylated compounds were analyzed. However, only the following PAH compounds showed concentrations higher than the
detection limits in the sediment samples: naphthalene, methylnaphthalenes, acenaphtylene, acenaphtene, fluorene, methylfluorenes, phenantrene, methylphenantrenes, anthracene, fluoranthene, pyrene, methylpyrenes, benzo[b] fluoranthene and benzo[a]pyrene.
The total PAH concentrations, expressed as the sum of the compounds listed above, ranged from 63.9 ± 12.1 to 1459.0 ± 43.5 ng g-1 d.w. (Table 2). The highest concentrations were observed at stations 1, 2, 5 and 6, located around Itajaí harbor and near two shipyards, where shipping traffic is intense, with total PAH concentrations higher than 500 ng g-1 d.w. According to Notar et al.45 concentrations > 500 ng g-1 are indicative of relatively highly contaminated samples, whereas sediments with 250 < total PAH < 500 ng g-1 are classified as fairly contaminated. In this regard, four sediment samples (stations 1, 2, 5 and 6) can be classified as highly contaminated and one sediment sample (station 4) as fairly contaminated. Another PAH classification criteria has been suggested by Baumard et al.46 to characterize sediment quality in terms of the contamination level as low, moderate, high or very high (0-100, 100-1000, 1000-5000 and > 5000 ng g-1 d.w., respectively). Based on this classification and considering Σ16 PAH, stations 7-12 can be classified in terms of the contamination level as low, stations 1-5 as moderate, and station 6 as high.
PAH concentrations in sediments were also compared to the international sediment quality guidelines (SQGs), which is a useful guide for assessing contamination in marine and estuarine sediments.47-49 In this study, two widely used sediment quality guidelines, the effects range-low value (ERL) and effects range-median value (ERM) as well as the probable effects level (PEL) and the threshold effects level (TEL) values, were considered to evaluate the possible ecotoxicological risks of PAH present in Itajaí-Açu estuarine system. The measured concentrations of PAH were compared to the ERL, ERM, TEL, and PEL values (given in Supplementary Information section, Table S4) and results of this study indicated that adverse effects on the benthic communities that live in the Itajaí-Açu estuary sediments are expected to occur rarely to occasionally.
A comparison of the total PAH concentrations in the Itajaí-Açu estuary sediments with other estuarine and coastal environments can be found in Supplementary Information section (Table S2), which provides a general overview of pollutant levels in other coastal areas. A comparison of the datasets revealed that the PAH concentrations in the Itajaí-Açu estuarine system are higher than those reported for the Persian Gulf,50 Patos Lagoon,51 Capibaribe estuarine system52 and Sergipe-Alagoas Basin53 (72.17-277.77, 7.3-92.8, < DL-497.6 and < DL-127.3 ng g-1, respectively),
Figure 4. Relative distribution of biogenic-related (ββ) and
but lower than those reported for Mundaú-Manguaba estuarine-lagoon system and Rio Paraíba do Sul, Brazil, affected by sugarcane monoculture practices and also urbanization (2.9-9344.3 ng g-1),54 Kaohsiung harbor, where the ship traffic is intense (472-16201 ng g-1),55 Fortaleza, northeast Brazil, with anthropogenic impacts coming from local harbor, industries and a petroleum refinery (3.0-2234.7 ng g-1)56 and Santos estuary, southeastern Brazil, an area with increased urbanization and industrialization (60-8680 ng g-1).57
The processes controlling sediment PAH concentrations are complex. Previous studies have shown that the distribution of these compounds in sediments is affected by a number of factors, including the chemical composition of the sediment (organic matter, clay content, etc.) and the currents.27,58 In the study reported herein, the regression analysis results showed that the total PAH concentrations were positively correlated with the clay content. However, the low value for the linear correlation found (R2 = 0.28) suggests that the sediment grain size was not a determining factor in the PAH accumulation. Although a smaller sediment grain size facilitates the accumulation of organic compounds, higher PAH concentrations in more urbanized areas and at sites close to port activities (stations 1, 2, 5 and 6) suggests that the PAH accumulation in this case is related to anthropogenic influence rather than to grain size. The correlation between the TOC and PAH concentrations was also poor (R2 = 0.19), as expected, considering the large number of possible sources that can influence the TOC concentration.
In estuarine environments, PAH are related to (i) pyrolytic sources, such as vehicle and other exhaust emissions, the burning of biomass, petroleum and its derivatives; (ii) petrogenic sources, such as effluents from oil refineries and small oil spills due to shipping traffic; (iii) natural sources (diagenetic origin) include the post-depositional transformation of biogenic precursors.59,60 In order to identify potential sources of PAH in marine sediments several ratios have been proposed. In this study, the PAH ratios and transition values used to evaluate the sediment data were based on a comprehensive study by Yunker et al.59 In order to reduce the influence of factors such as differences in volatility, water solubility and adsorption, the ratio between isomer pairs, such as phenantrene and anthracene (molecular mass of 178 u) and fluoranthene and pyrene (molecular mass of 202 u), were examined. An anthracene to anthracene plus phenantrene (Ant/Phe + Ant) ratio < 0.10 usually is taken as an indication of petroleum, whereas a ratio > 0.10 indicates a dominance of combustion.23,59 Although the (Ant/Phe + Ant) ratio could not be calculated for some stations due to the absence of
one or both compounds, all stations where these compounds were present showed values > 0.10, indicating inputs from pyrolytic sources.
According to Yunker et al.,59 a ratio of fluoranthene to fluoranthene plus pyrene (Fluo/Fluo + Pyr) > 0.5 indicates grass, wood or coal combustion, whereas values < 0.4 suggest petrogenic origin and values between 0.4 and 0.5 are indicative of liquid fossil fuel combustion. As shown in Table 2, the values for this ratio were > 0.5 at most stations, excluding the sites where they were not measured and station 6, indicating that the origin of the PAH is mainly pyrolytic, most probably from the burning of grass, wood or coal, although nautical activities cannot be ruled out. At station 6, the ratio was 0.5, suggesting inputs also from fossil fuel combustion, which is very strong at this station, as revealed by the high concentration of Σ16 PAH (1237.2 ± 27.3 ng g-1), which is consistent with the activities at the site location (close to the Itajaí harbor). Alkyl PAH were identified at all sampling stations. Petrogenic inputs are the primary source of alkyl PAH and these compounds are associated with recent deposition, since they are rapidly degraded in early diagenesis.61
The ratio between the sum of alkylated homologues and the parent compound was also calculated in order to assess the potential sources of PAH. According to Garrigues et al.,62 the methylphenantrenes/phenantrene ratios (MP/P) measured in combustion products are generally < 0.5, whereas unburned fossil PAH mixtures typically range from 2 to 6. The MP/P ratios in the Itajaí-Açu estuarine sediments varied between 0.2 and 7.9 (Table 2), indicating that the PAH at stations 3, 5 and 6 also had contributions from petrogenic sources. This ratio could not be calculated for some stations due to the absence of one or both compounds.
Moreover, in systems where PAH can be introduced by different routes and can be derived from several activities, source identification and an assessment of source relevance are difficult to perform. Although the PAH ratios used in this study provided evidence regarding the sources of these compounds, the complete separation of combustion and petroleum sources of PAH in surface sediment samples is not an easy task, as verified by the findings of other studies. 63-66
Statistical analysis
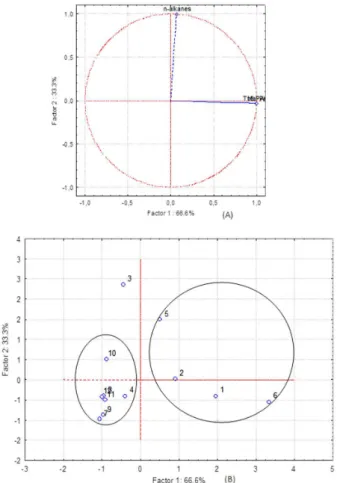
A principal component analysis was used to distinguish between the sampling stations and to assess the sources of the hydrocarbons determined in this study. The PCA reorganized the original data into four main factors and the first two components accounted for 98.8% of the total variance. Figure 5 displays a pair of charts that show the relations between the variables (loadings) (Figure 5A) and cases (scores) (Figure 5B). The first principal component (PC1), which explained 66.6% of the variability, is strongly positive associated with total PAH and 16 priority PAH concentrations (Figure 5). The second principal component (PC2) associated inversely the concentrations of n-alkanes with the concentrations of total and 16 priority PAH, explaining 33.3% of the variability.
The discrimination presented by PC2, showed positive correlations between compounds from biogenic sources (n-alkanes), while the compounds with negative correlations (PAH) are associated with anthropogenic sources such as pyrolitic and petrogenic.
The PCA ordination performed resulted in the formation of two groups of stations and one station was isolated (Figure 5B). One of the groups was formed by stations 1, 2, 5 and 6, with total PAH concentrations higher than 500 ng g-1, which are the samples highly contaminated, according to Notar et al.45 A second group was formed by stations 4, 7, 8, 9, 10, 11 and 12, which showed total PAH concentrations lower than 300 ng g-1 and total n-alkane concentrations lower than 40 µg g-1. On the other hand, the station 3 was isolated from the groups because its total PAH concentrations were lower than 300 µg g-1 and the n-alkane concentration was the highest of the sampling stations.
Conclusions
This study provided data on the aliphatic and polycyclic aromatic hydrocarbon concentrations in the surface sediments of the Itajaí-Açu estuarine system. Although the total n-alkane concentrations were not very high, CPI values were close to unity for most of the samples evaluated, indicating that the Itajaí-Açu estuarine system
is contaminated by petroleum-related sources, mainly at station located in the Itajaí harbor, where an intense UCM was observed. Based on selected PAH ratios, the sedimentary PAH composition reflects a mixture of both petrogenic and pyrolytic sources. Comparing the PAH concentrations found in the sediments with published SQGs, the results indicated that adverse biological effects on the living biota are expected to occur rarely to occasionally. However, it is important to note that higher PAH concentrations were observed at sites located around Itajaí harbor and near two shipyards, where shipping traffic is intense, demonstrating that the harbor is a major source of sediment contamination. These stations (1, 2, 5 and 6) were also grouped by the PCA, indicating that they have received the same input. The presence of biomarker hopanes with αβ stereochemistry, widely used as molecular markers for oil pollution, indicated petrogenic inputs at all stations. These petroleum biomarkers were found to be useful for the investigation of petrogenic inputs in sediments
Figure 5. Charts (A) variables (loadings) and (B) cases (scores) for two
and the values were consistent with the low CPI values and PAH ratios, revealing that the local activities are significant pollution sources to the Itajaí-Açu estuarine system. Results obtained in this study provided useful information related to hydrocarbon concentrations and sources in the sediments of the Itajaí-Açu estuarine system, which is an important economic area in Brazil due to activities related to the port, fishing industry and tourism. In addition, the results reported herein can be considered as baseline concentrations to be used as a reference for future hydrocarbon monitoring programs and can promote the management of coastal environments as well as aid an understanding of the cycling of organic matter in estuarine systems of tropical regions.
Supplementary Information
Supplementary information on the n-alkanes and PAH figures of merit, n-alkane and PAH concentrations for various sediments and a comparison of Itajaí-Açu estuarine sediment PAH concentrations with SQGs are available free of charge at http://jbcs.sbq.org.br as PDF file.
Acknowledgments
The authors are grateful to Petróleo Brasileiro S.A. (Petrobras), Conselho Nacional de Desenvolvimento Científico e Tecnológico (CNPq) 304209/2013-9 and Coordenação de Aperfeiçoamento de Pessoal de Nível Superior (CAPES) for financial support and to Fundação de Amparo a Pesquisa do Estado de São Paulo (FAPESP) for the scholarship awarded to G.A.B. (process number 2012/21395-0).
References
1. Soniju, S. O.; Sonibare, O. O.; Ekundayo, O.; Zeng, E. Y.; Sci. Total Environ. 2012, 441, 89.
2. Cabrita, M. T.; Environ. Pollut. 2014, 191, 17.
3. Buruaem, L. M.; Castro, I. B.; Hortellani, M. A.; Taniguchi, S.; Fillmann, G.; Sasaki, S. T.; Petti, M. A. V.; Sarkis, J. E. S.; Bícego, M. C.; Maranho, L. A.; Davanso, M. B.; Nonato, E. F.; Cesar, A.; Costa-Lotufo, L. V.; Abessa, D. M. S.; Estuarine, Coastal Shelf Sci. 2013, 130, 179.
4. Pereira Filho, J.; Spillere, L. C.; Schettini, C. A. F.; Atlântica
2003, 25, 11.
5. Schettini, C. A.; Rev. Bras. Rec. Hídric. 2002, 7, 123. 6. Frena, M.; Bataglion, G. A.; Tonietto, A. E.; Eberlin, M. N.;
Alexandre, M. R.; Madureira, L. A. S.; Sci. Total Environ. 2016, 544, 432.
7. http://www.portoitajai.com.br/novo/c/localizacao, accessed in June 2016.
8. Asia, L.; Mazouz, S.; Guiliano, M.; Doumenq, P.; Mille, G.; Mar. Pollut. Bull. 2009, 58, 424.
9. Guo, W.; He, M.; Yang, Z.; Lin, C.; Quan, X.; J. Hazard. Mater.
2011, 186, 1193.
10. Mille, G.; Asia, L.; Guiliano, M.; Malleret, L.; Doumenq, P.; Mar. Pollut. Bull. 2007, 54, 566.
11. Hu, L.; Guo, Z.; Shi, X.; Qin, Y.; Lei, K.; Zhang, G.; Org. Geochem. 2011, 42, 1181.
12. Tolosa, I.; Mora, S. J.; Fowler, S. W.; Villeneuve, J. P.; Bartocci, J.; Cattini, C.; Mar. Pollut. Bull. 2005, 50, 1619.
13. Qiu, Y.-W.; Zhang, G.; Liu, G.-Q.; Guo, L.-L.; Li, X.-D.; Wai, O.; Estuarine, Coastal Shelf Sci. 2009, 83, 60.
14. Commendatore, M. G.; Nievas, M. L.; Amin, O.; Esteves, J. L.; Mar. Environ. Res. 2012, 74, 20.
15. Meyers, P. A.; Ishiwatari, R.; Org. Geochem. 1993, 20, 867. 16. Volkman, J. K.; Holdsworth, D. G.; Neill, G. P.; Bavor Jr., H.
J.; Sci. Total Environ. 1992, 112, 203.
17. Peters, K. E.; Moldowan, J. M.; The Biomarker Guide: Interpreting Molecular Fossils in Petroleum and Ancient
Sediments; Prentice-Hall Inc.: New Jersey, 1993.
18. Bost, F. D.; Frontera-Suau, R.; McDonald, T. J.; Peters, K. E.; Morris, P. J.; Org. Geochem. 2001, 32, 105.
19. Philp, R. P.; Fossil Fuel Biomarkers, Applications and Spectra, Methods in Geochemistry and Geophysics; Elsevier: Amsterdam, 1985.
20. Abreu-Mota, M. A.; Barboza, C. A. M.; Bícego, M. C.; Martins, C. C.; Chemosphere 2014, 103, 156.
21. Readman, J. W.; Fillmann, G.; Tolosa, I.; Bartocci, J.; Villeneuve, J. P.; Cattini, C.; Mee, L. D.; Mar. Pollut. Bull.
2002, 44, 48.
22. Zaghden, H.; Kallel, M.; Elleuch, B.; Oudot, J.; Saliot, A.; Mar. Chem. 2007, 105, 70.
23. Soclo, H. H.; Garrigues, P.; Ewald, M.; Mar. Pollut. Bull. 2000, 40, 387.
24. Feng, J.; Zhai, M.; Sun, J.; Liu, Q.; Environ. Sci. Pollut. Res.
2012, 19, 1097.
25. Gonul, L. T.; Kucuksezgin, F.; Environ. Sci. Pollut. Res. 2012, 19, 31.
26. Silva, T. R.; Lopes, S. R. P.; Sporl, G.; Knoppers, B. A.; Azevedo, D. A.; Microchem. J. 2013, 109, 178.
27. He, X.; Pang, Y.; Song, X.; Chen, B.; Feng, Z.; Ma, Y.; Mar. Pollut. Bull. 2014, 80, 52.
28. Wang, M.; Wang, C.; Hu, X.; Zhang, H.; He, S.; Lv, S.; Mar. Pollut. Bull. 2015, 90, 88.
29. Oliveira, C. R.; Madureira, L. A. S.; Environ. Monit. Assess.
2011, 173, 91.
30. Branco, J. O.; Lunardon-Branco, M. J.; Bellotto, V. R.; Estuário do Rio Itajaí-Açú, Santa Catarina: Caracterização Ambiental
e Alterações Antrópicas; Editora Univali: Itajaí, 2009. 31. Suguio, K.; Introdução à Sedimentologia; Edgard Buckler,
32. EPA 3540 C: Soxhlet Extraction, Ohio, USA, 1996.
33. Tarozo, R.; Frena, M.; Madureira, L. A. S.; J. Braz. Chem. Soc.
2010, 21, 2308.
34. Meyers, P. A.; Org. Geochem. 2003, 34, 261.
35. Maioli, O. L. G.; Rodrigues, K.; Knoppers, B. A.; Azevedo, D. A.; J. Braz. Chem. Soc. 2010, 21, 1543.
36. Lima, M. B.; Feitosa, E. A.; Emídio, E. S.; Dórea, H. S.; Alexandre, M. R.; Mar. Pollut. Bull. 2012, 64, 1721.
37. Mater, L.; Alexandre, M. R.; Hansel, F. A.; Madureira, L. A. S.; J. Braz. Chem. Soc. 2004, 15, 1.
38. Venturini, N.; Tommasi, L. R.; Mar. Pollut. Bull. 2004, 48, 97. 39. Harji, R. R.; Yvenat, A.; Bhosle, N. B.; Environ. Int. 2008, 34,
959.
40. Gao, X.; Chen, S.; Xie, X.; Long, A.; Ma, F.; Environ. Pollut.
2007, 148, 40.
41. Bray, E. E.; Evans, E. D.; Geochim. Cosmochim. Acta 1961, 22, 2.
42. Eglinton, G.; Hamilton, R. J.; Science 1967,156, 1322. 43. Silva, T. R.; Lopes, S. R. P.; Sporl, G.; Knoppers, B. A.;
Azevedo, D. A.; Org. Geochem. 2012, 53, 25. 44. Simoneit, B. R. T.; Atmos. Environ. 1984, 18, 51.
45. Notar, M.; Leskovsek, H.; Faganeli, J.; Mar. Pollut. Bull. 2001, 42, 36.
46. Baumard, P.; Budzinski, H.; Garrigues, P.; Sorbe, J. C.; Burgeot, T.; Bellocq, J.; Mar. Pollut. Bull. 1998, 36, 951.
47. Long, E. R.; MacDonald, D. D.; Smith, S. I.; Calder, F. D.; J. Environ. Manage. 1995, 19, 18.
48. MacDonald, D. D.; Carr, R. S.; Calder, F. D.; Long, E. R.; Ingersoll, C. G.; Ecotoxicology 1996, 5, 253.
49. MacDonald, D. D.; Ingersoll, C. G.; Berger, T. A.; Arch. Environ. Contam. Toxicol. 2000, 39, 20.
50. Rahmanpoor, S.; Ghafourian, H.; Hashtroudi, S. M.; Darvish, K.; Mar. Pollut. Bull. 2014, 78, 224.
51. Sanches Filho, P. J.; Luz, L. P.; Betemps, G. R.; Caramão, E. B.; Mar. Pollut. Bull. 2012, 64, 1933.
52. Maciel, D. C.; de Souza, J. R. B.; Taniguchi, S.; Bícego, M. C.; Zanardi-Lamardo, E.; Mar. Pollut. Bull. 2015, 101, 429. 53. Lourenço, R. A.; Araújo Jr., M. A. G.; Meireles Jr., R. O.;
Macena, L. F.; Lima, E. F. A.; Carneiro, M. E .R.; Cont. Shelf Res. 2013, 71, 37.
54. Maioli, O. L. G.; Rodrigues, K. C.; Knoppers, B. A.; Azevedo, D. A.; Org. Geochem. 2010, 41, 966.
55. Chen, C. W.; Chen, C. F.; Mar. Pollut. Bull. 2011, 63, 417. 56. Cavalcante, R. M.; Sousa, F. W.; Nascimento, R. F.; Silveira,
E. R.; Freire, G. S. S.; J. Environ. Manage. 2009, 91, 328. 57. Martins, C. C.; Bícego, M. C.; Mahiques, M. M.; Figueira, R.
C. L.; Tessler, M. G.; Montone, R. C.; Mar. Pollut. Bull. 2011, 63, 452.
58. Araghi, P. E.; Bastami, K. D.; Rahmanpoor, S.; Mar. Pollut. Bull. 2014, 89, 494.
59. Yunker, M. B.; Macdonald, R. W.; Vingarzan, R.; Mitchell, R. H.; Goyette, D.; Sylvestre, S.; Org. Geochem. 2002, 33, 489. 60. Oren, A.; Aizenshtat, Z.; Chefetz, B.; Environ. Pollut. 2006,
141, 265.
61. Wang, Z.; Fingas, M.; Page, D. S.; J. Chromatogr. A 1999, 843, 369.
62. Garrigues, P.; Budzinski, H.; Manitz, M. P.; Wise, S. A.; Polycyclic Aromat. Compd. 1995, 7, 275.
63. Silva, D. A. M.; Bícego, M. C.; Mar. Environ. Res. 2010, 69, 277.
64. Martins, C.; Bícego, M. C.; Figueira, R. C. L.; Angelli, J. L. F.; Combi, T.; Gallice, W. C.; Mansur, A. V.; Nardes, E.; Rocha, M. L.; Wisnieski, E.; Ceschim, L. M. M.; Ribeiro, A. P.; Sci. Total Environ. 2012, 417-418, 158.
65. Bastami, K. D.; Afkhami, M.; Ehsanpour, M.; Kazaali, A.; Mohammadizadeh, M.; Haghparast, S.; Soltani, F.; Zanjani, S. A.; Ghorghani, N. F.; Pourzare, R.; Mar. Pollut. Bull. 2013, 76, 411.
66. Wagener, A. L. R.; Meniconi, M. F. G.; Hamacher, C.; Farias, C. O.; Silva, G. C.; Gabardo, I. T.; Scofield, A. L.; Mar. Pollut. Bull. 2012, 64, 284.
Submitted: January 15, 2016
Published online: July 13, 2016